

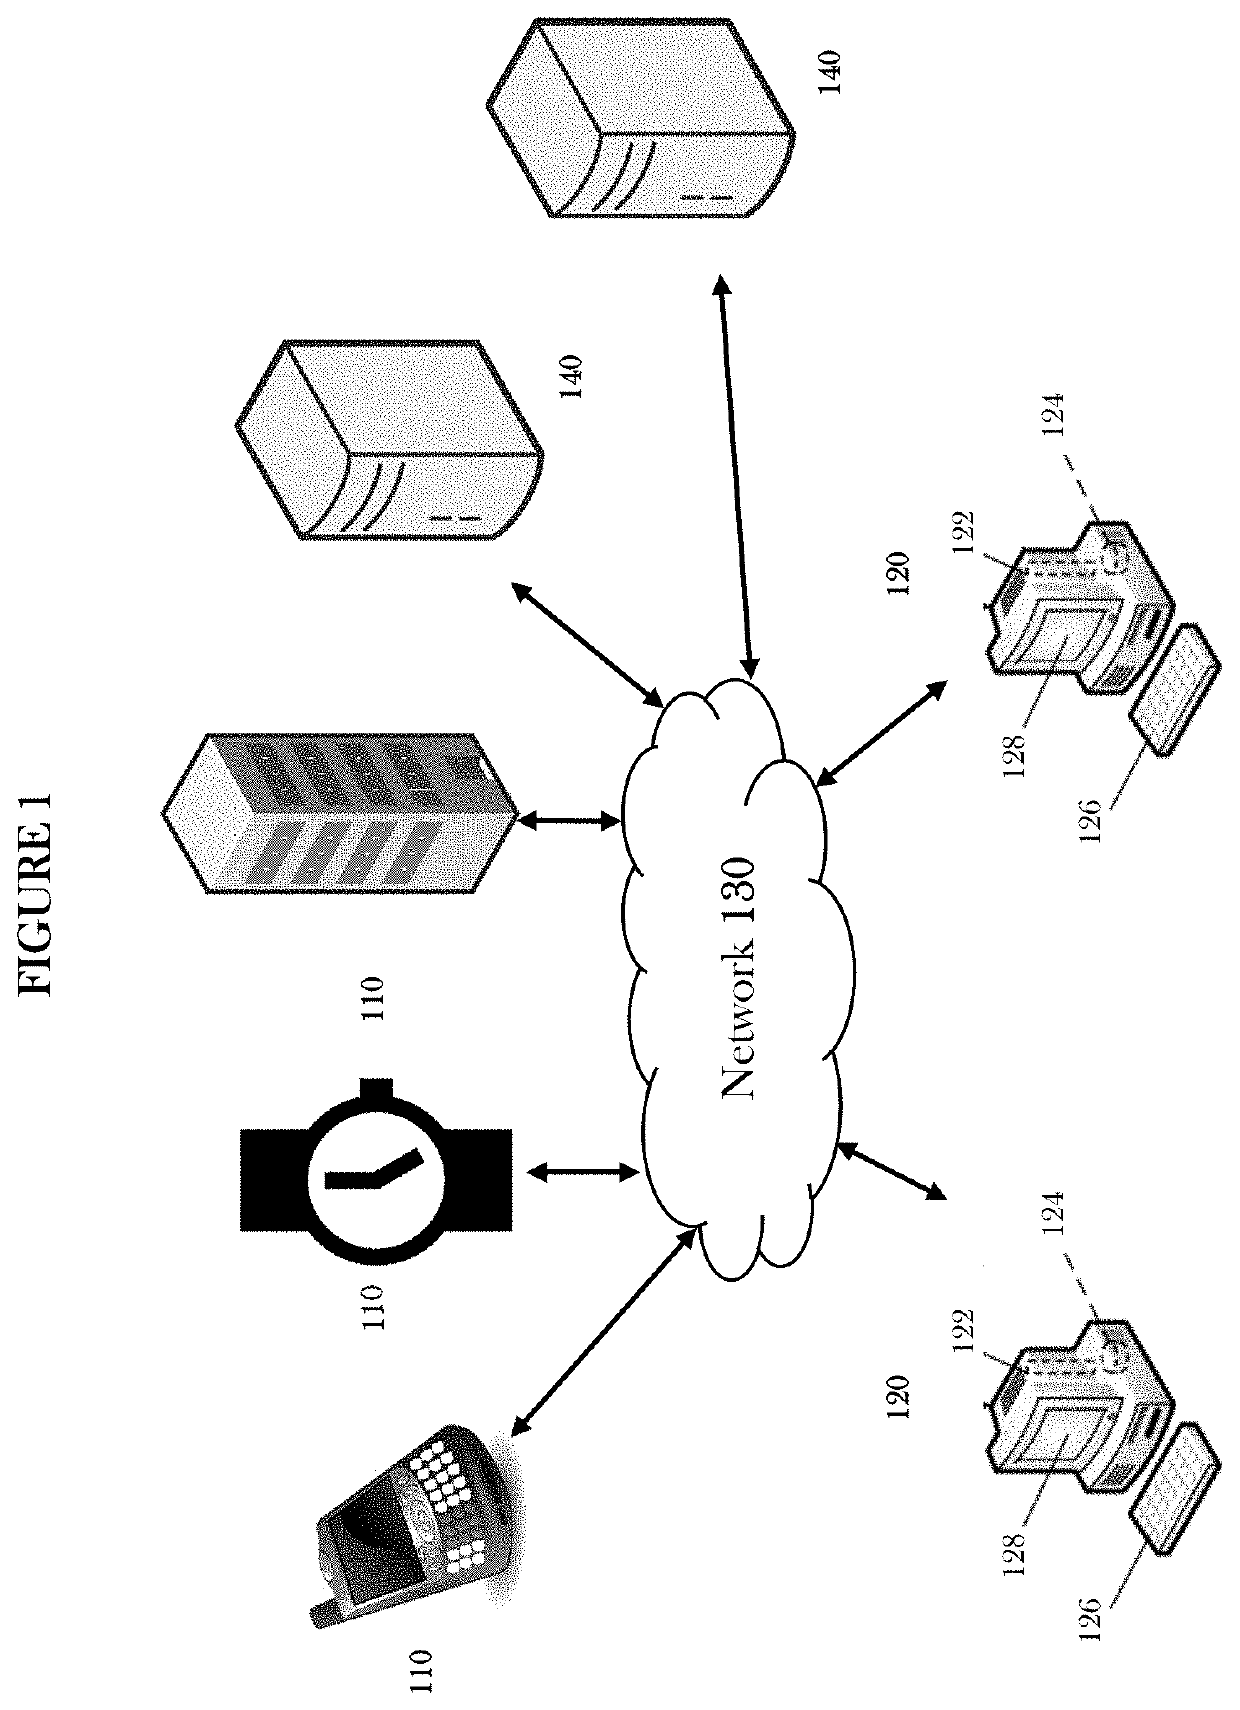
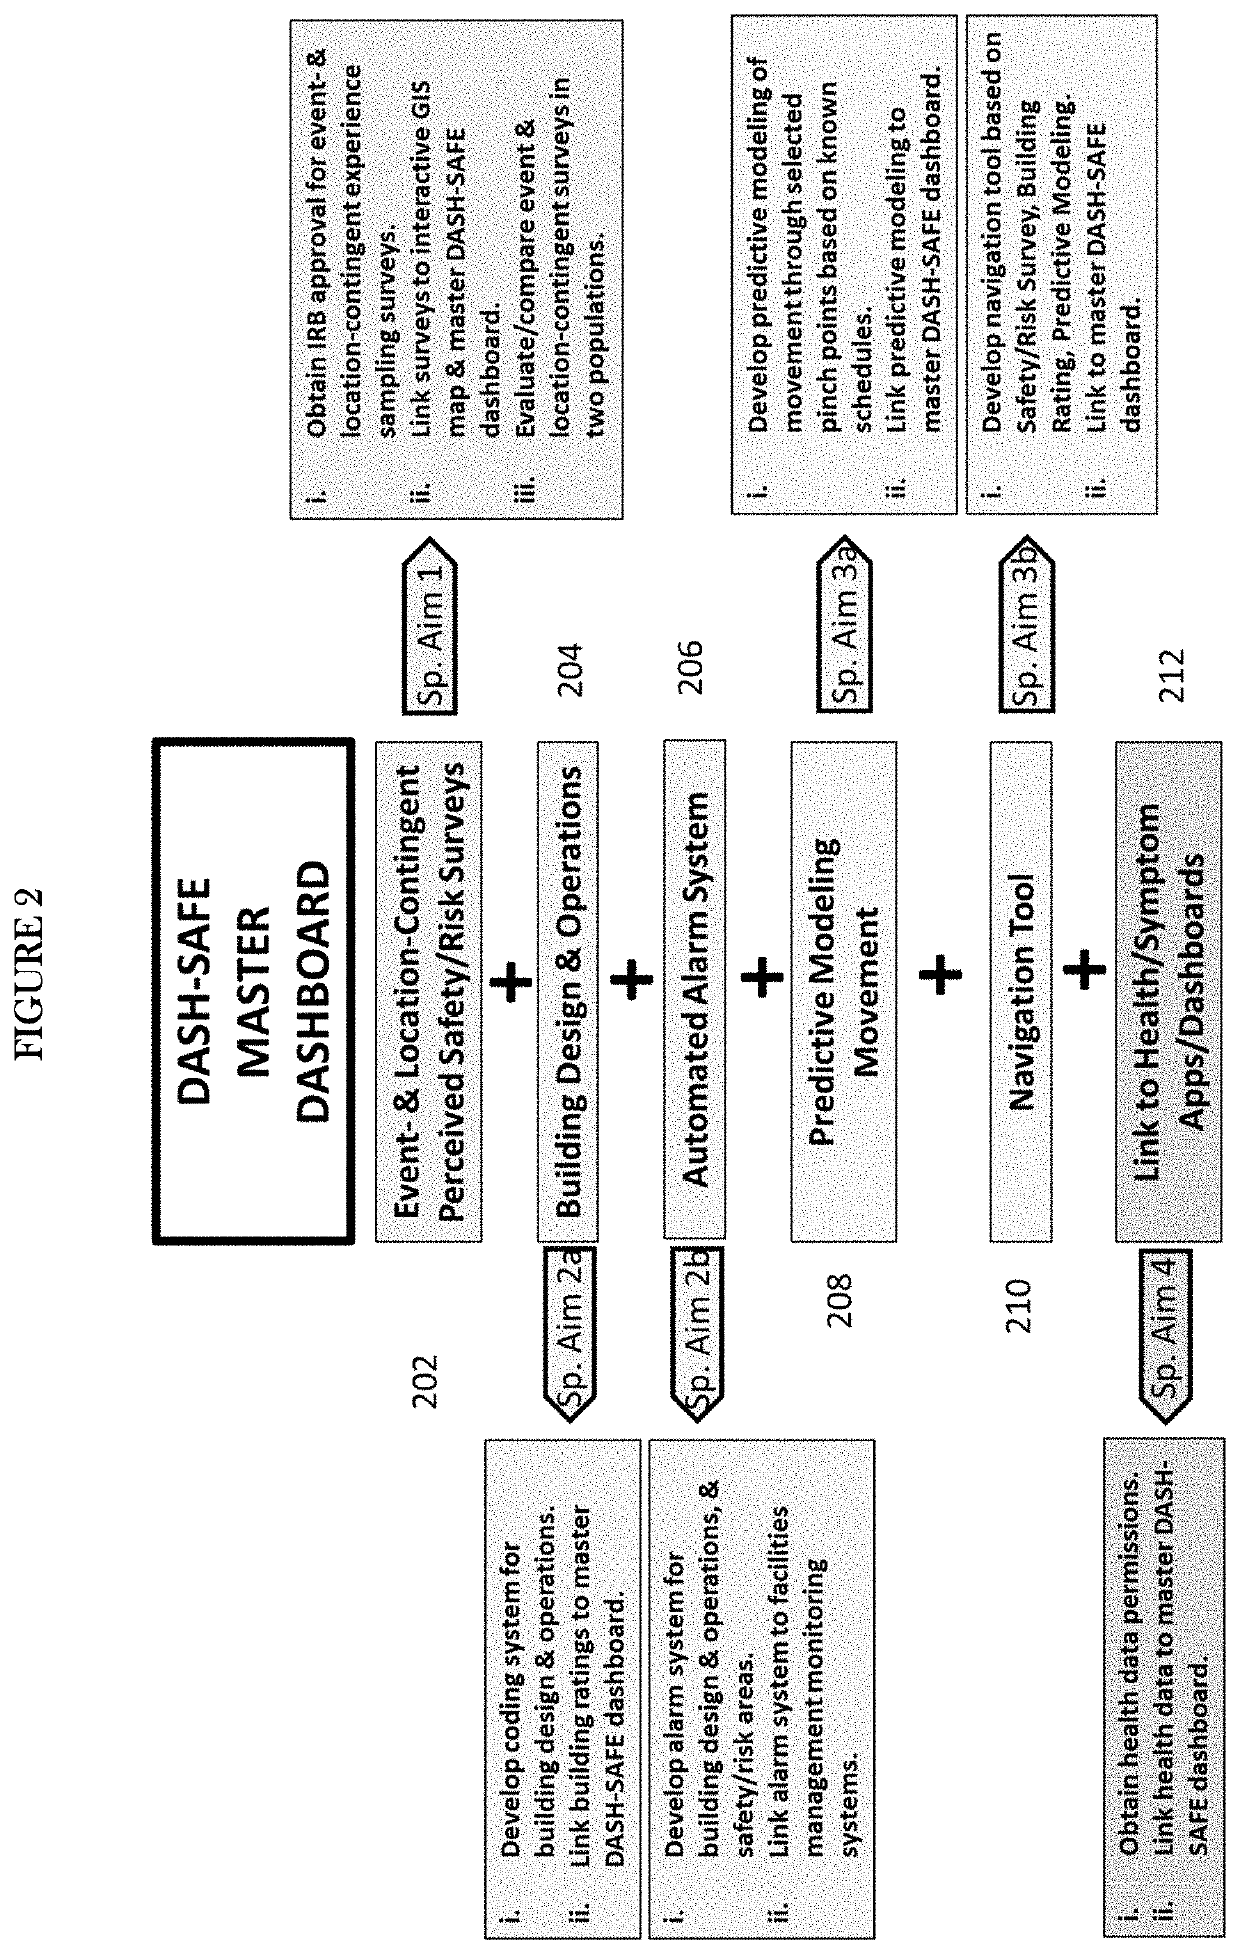
Systems and methods for a multi-modal geographic information system (GIS) dashboard for real-time mapping of perceived stress, health and safety behaviors, facilities design and operations, and movement
a geographic information system and dashboard technology, applied in the field of dashboardstress at risk facilities, can solve the problems of disease transmission, contact tracing, and achieve the effects of reducing the risk of disease transmission, enhancing the usability of the dashboard, and facilitating the navigation of clustered environments
- Summary
- Abstract
- Description
- Claims
- Application Information
AI Technical Summary
Benefits of technology
Problems solved by technology
Method used
Image

Examples
example 1
Event-Contingent Program
[0078](a) Population: Stfudent ambassadors, part of the University of Arizona T3 Re-Entry plan. These comprise x males and y females, ages a-z.
[0079](b) Recruitment plan: A briefing will be presented regarding the survey to the Incident Command System leadership and committee for their buy-in and will work closely with the ICS to recruit and train the ambassadors.
[0080](b) Availability of population and past successes in recruitment: The population is highly available, as they are an important part of the T3 Re-Entry program team.
[0081]Location: The program is carried out on the University of Arizona campus and in selected buildings across campus.
[0082]Infection Control: All student ambassadors wear PPE (masks and gloves) when interacting with each participant at all stages of the program. Their primary role is to hand out masks and viral safety information as they move about campus, and wear masks at all times. The University of Arizona has mandatory precaut...
example 2
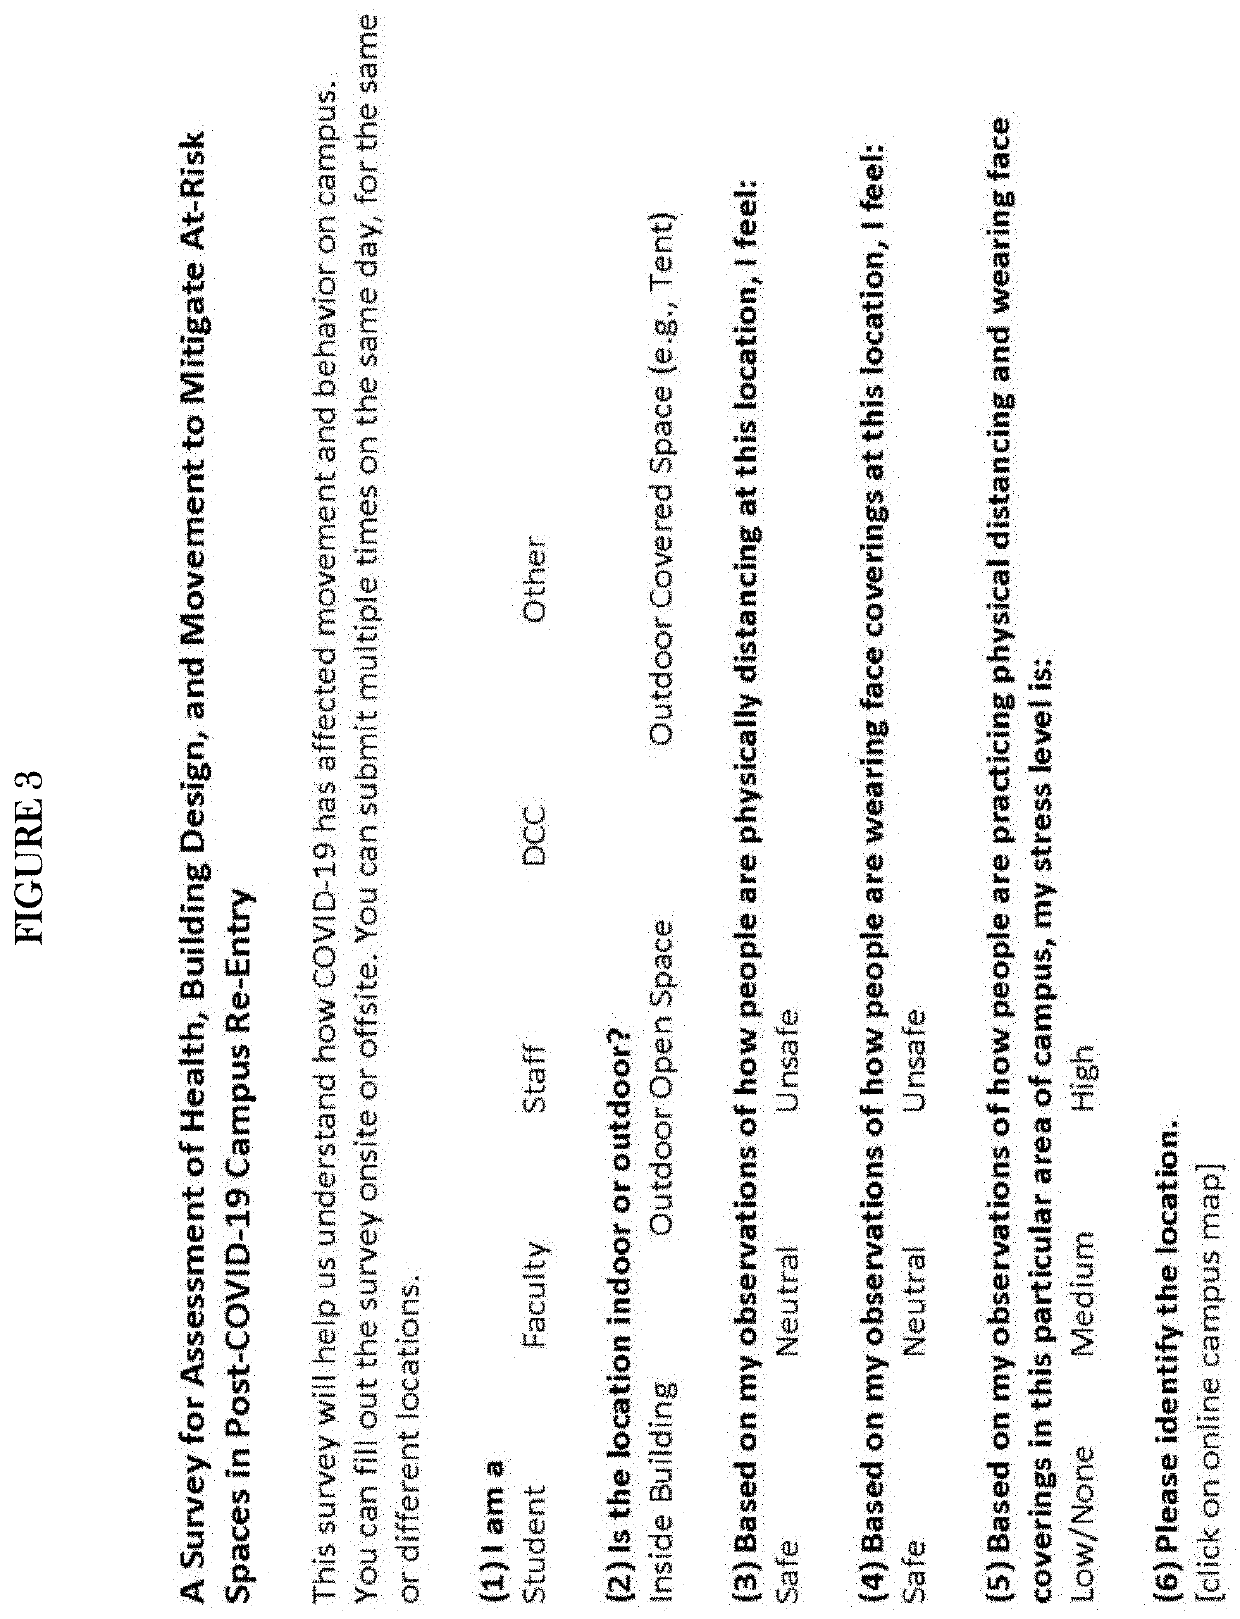
Location-Contingent Program
[0084]Population: All University of Arizona campus occupants.
[0085]Recruitment plan: A marketing plan will be developed to disseminate information about the DASH-SAFE dashboard including using social media, listservs, posters and postings of QR codes on information LCD screens across campus and on “Talk-Back” boards at libraries, and campus-wide zoom symposia presentations.
[0086]Availability of population and past successes in recruitment: The population is highly available as it is comprised of all campus occupants.
[0087]Location: The program was carried out on the University of Arizona campus both outdoors and at entrances and exits of selected buildings across campus.
[0088](a) Infection Control: As this is a touchless system of simply aiming the smart phone at the QR codes, infection control does not apply other than the standard University of Arizona mandatory precautions in place for infection control including restricted entrances, mandatory temperat...
PUM
 Abstract
Description
Claims
Application Information