System and apparatus for the detection of randomness in three dimensional time series distributions made up of sparse data sets

a time series distribution and randomness technology, applied in the field of signal processing/data processing systems, can solve the problems of weakening the theoretical approach, not necessarily true for small sample methods applied to large data sets, and failure of large sample methods

Inactive Publication Date: 2002-10-15
THE UNITED STATES OF AMERICA AS REPRESENTED BY THE SECRETARY OF THE NAVY
View PDF3 Cites 36 Cited by
  • Summary
  • Abstract
  • Description
  • Claims
  • Application Information

AI Technical Summary

Problems solved by technology

It is well known that large sample methods often fail when applied to small sample distributions, but that the same is not necessarily true f

Method used


Image

  • System and apparatus for the detection of randomness in three dimensional time series distributions made up of sparse data sets
  • System and apparatus for the detection of randomness in three dimensional time series distributions made up of sparse data sets
  • System and apparatus for the detection of randomness in three dimensional time series distributions made up of sparse data sets

Examples


Embodiment Construction

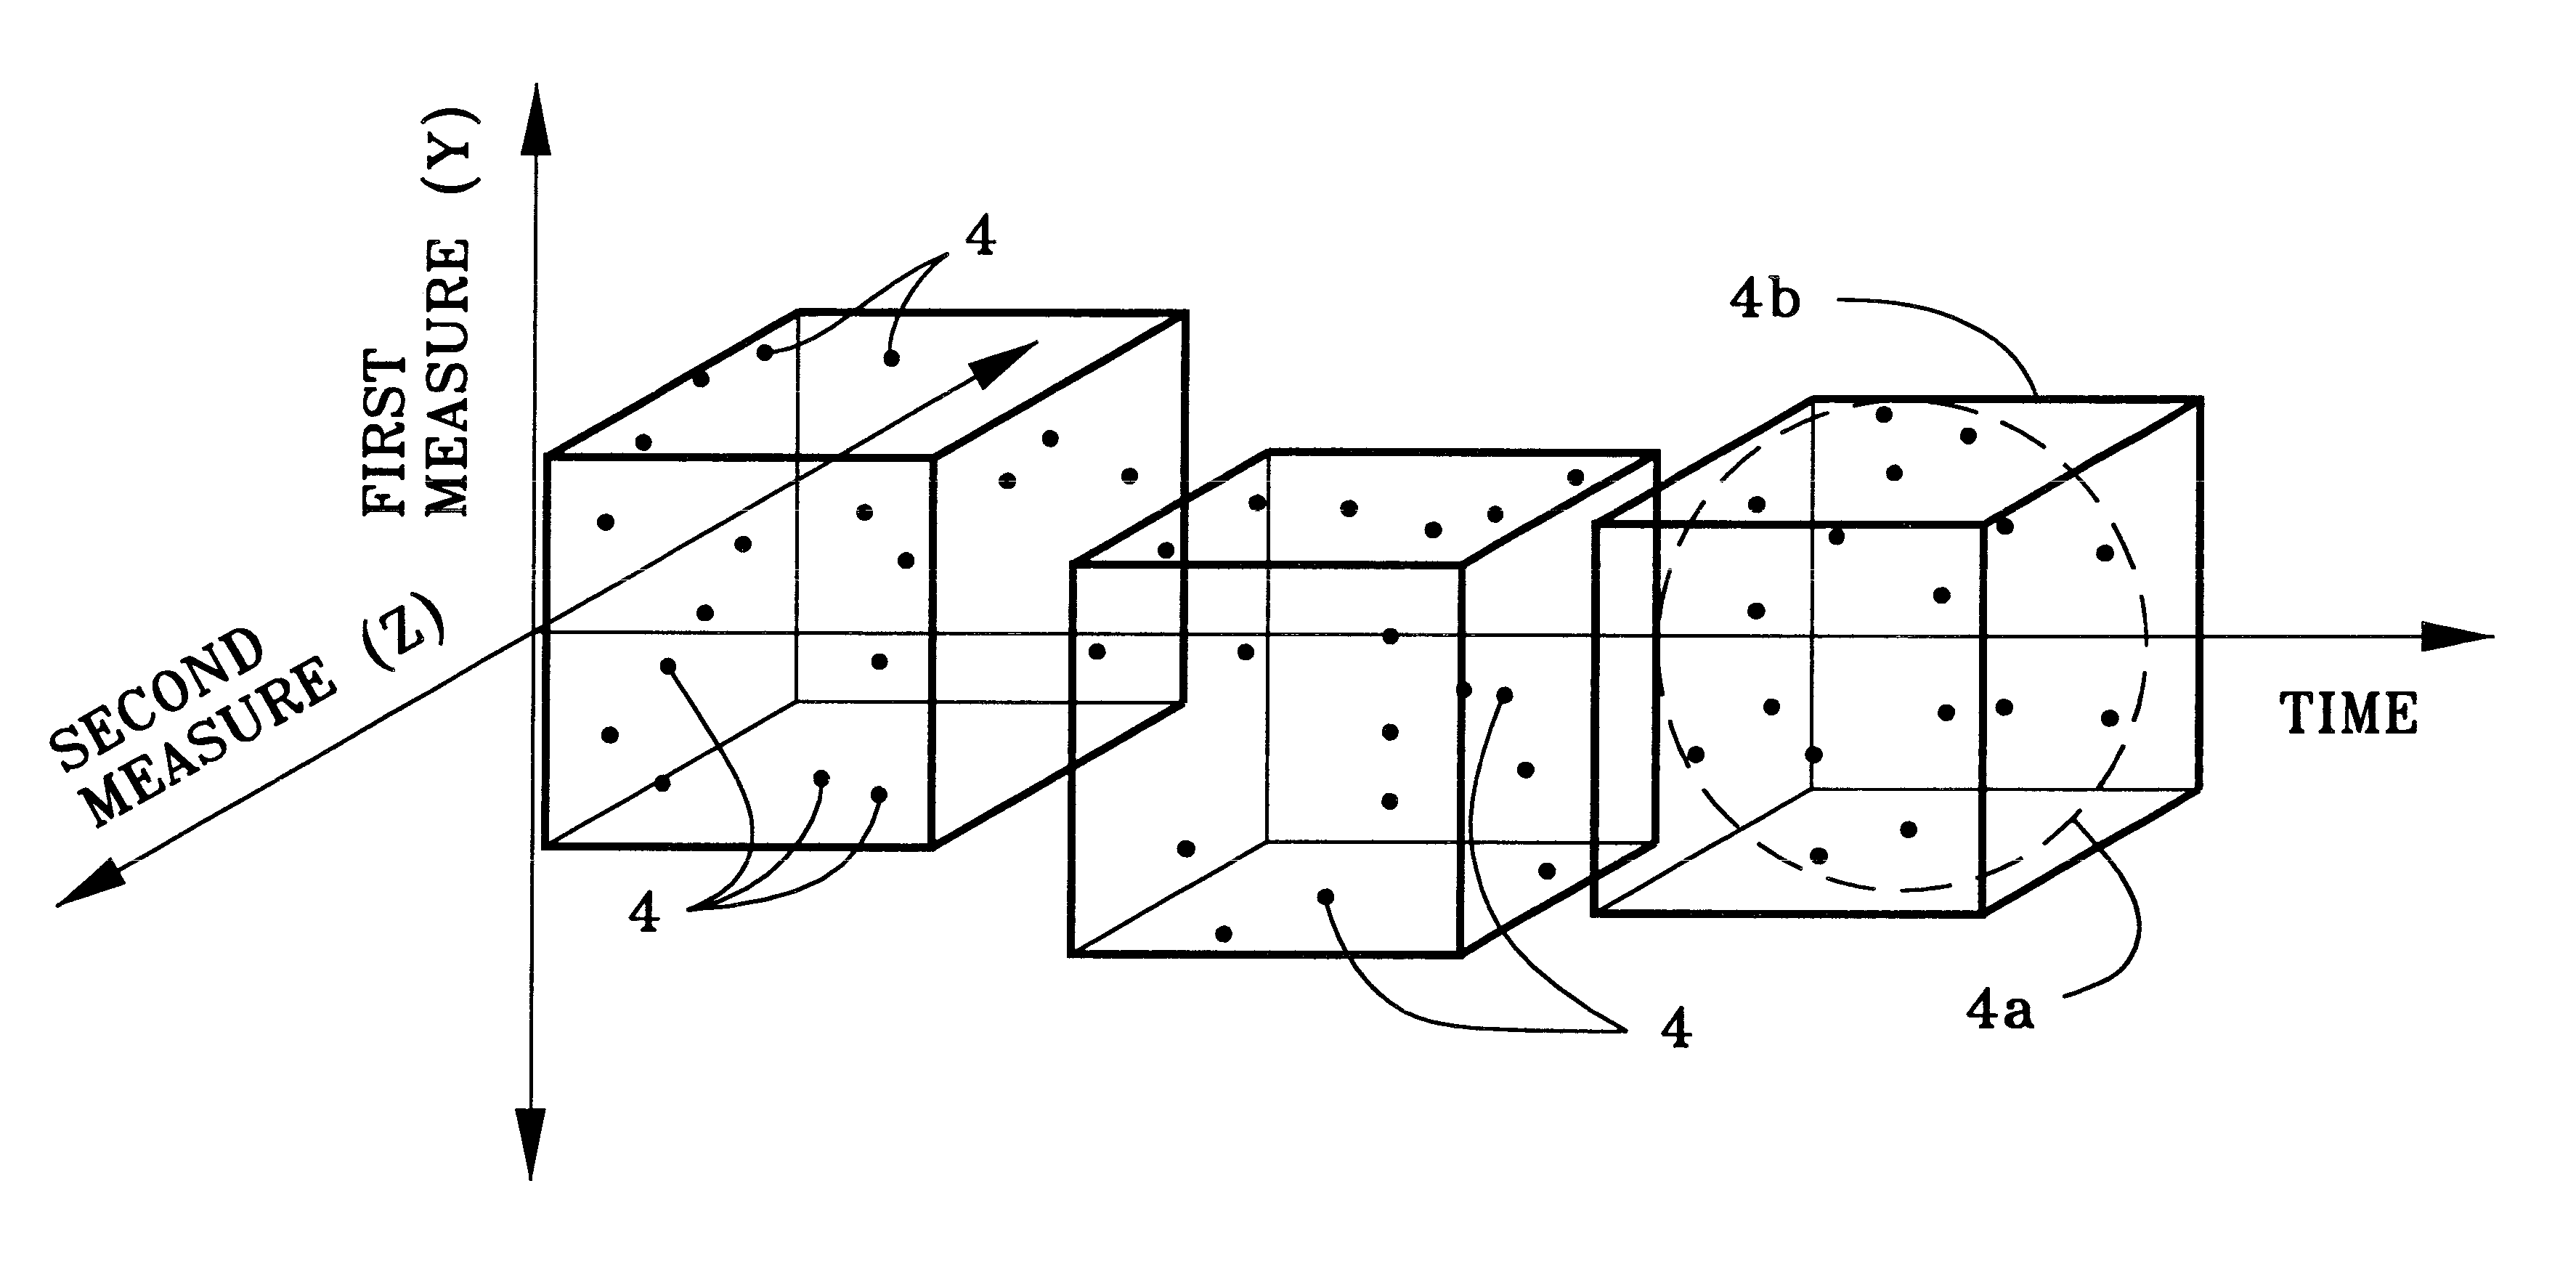
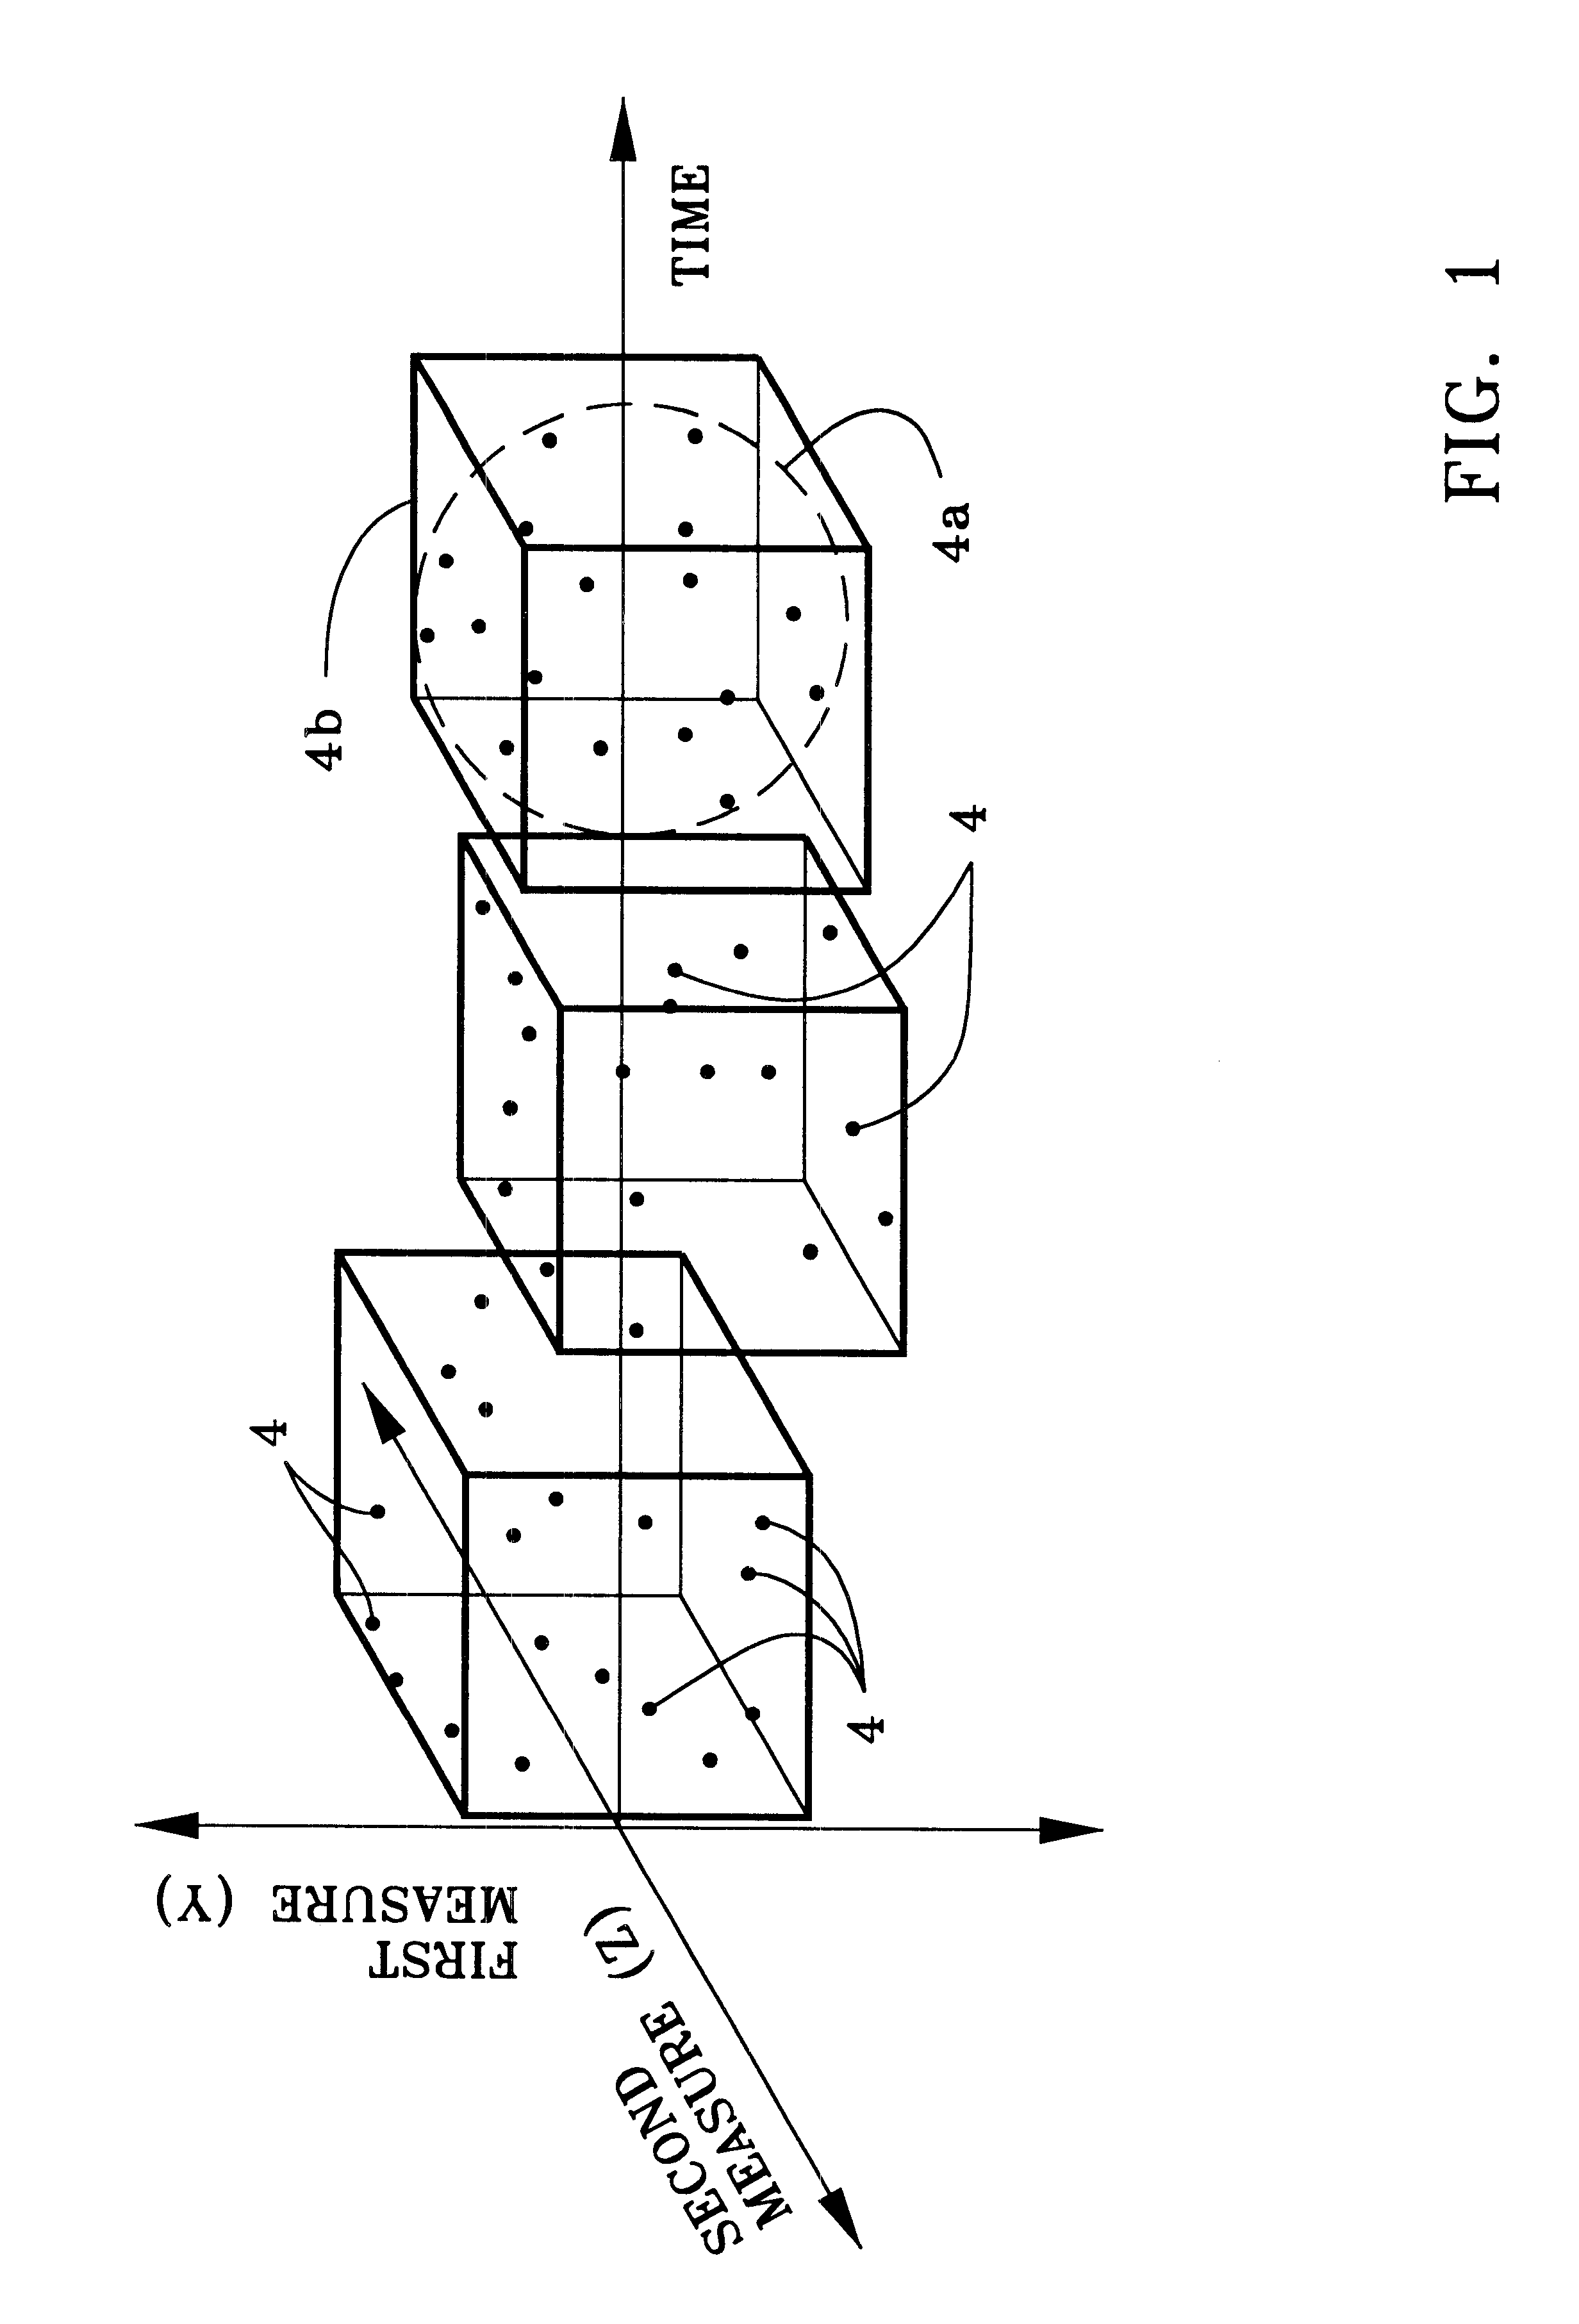
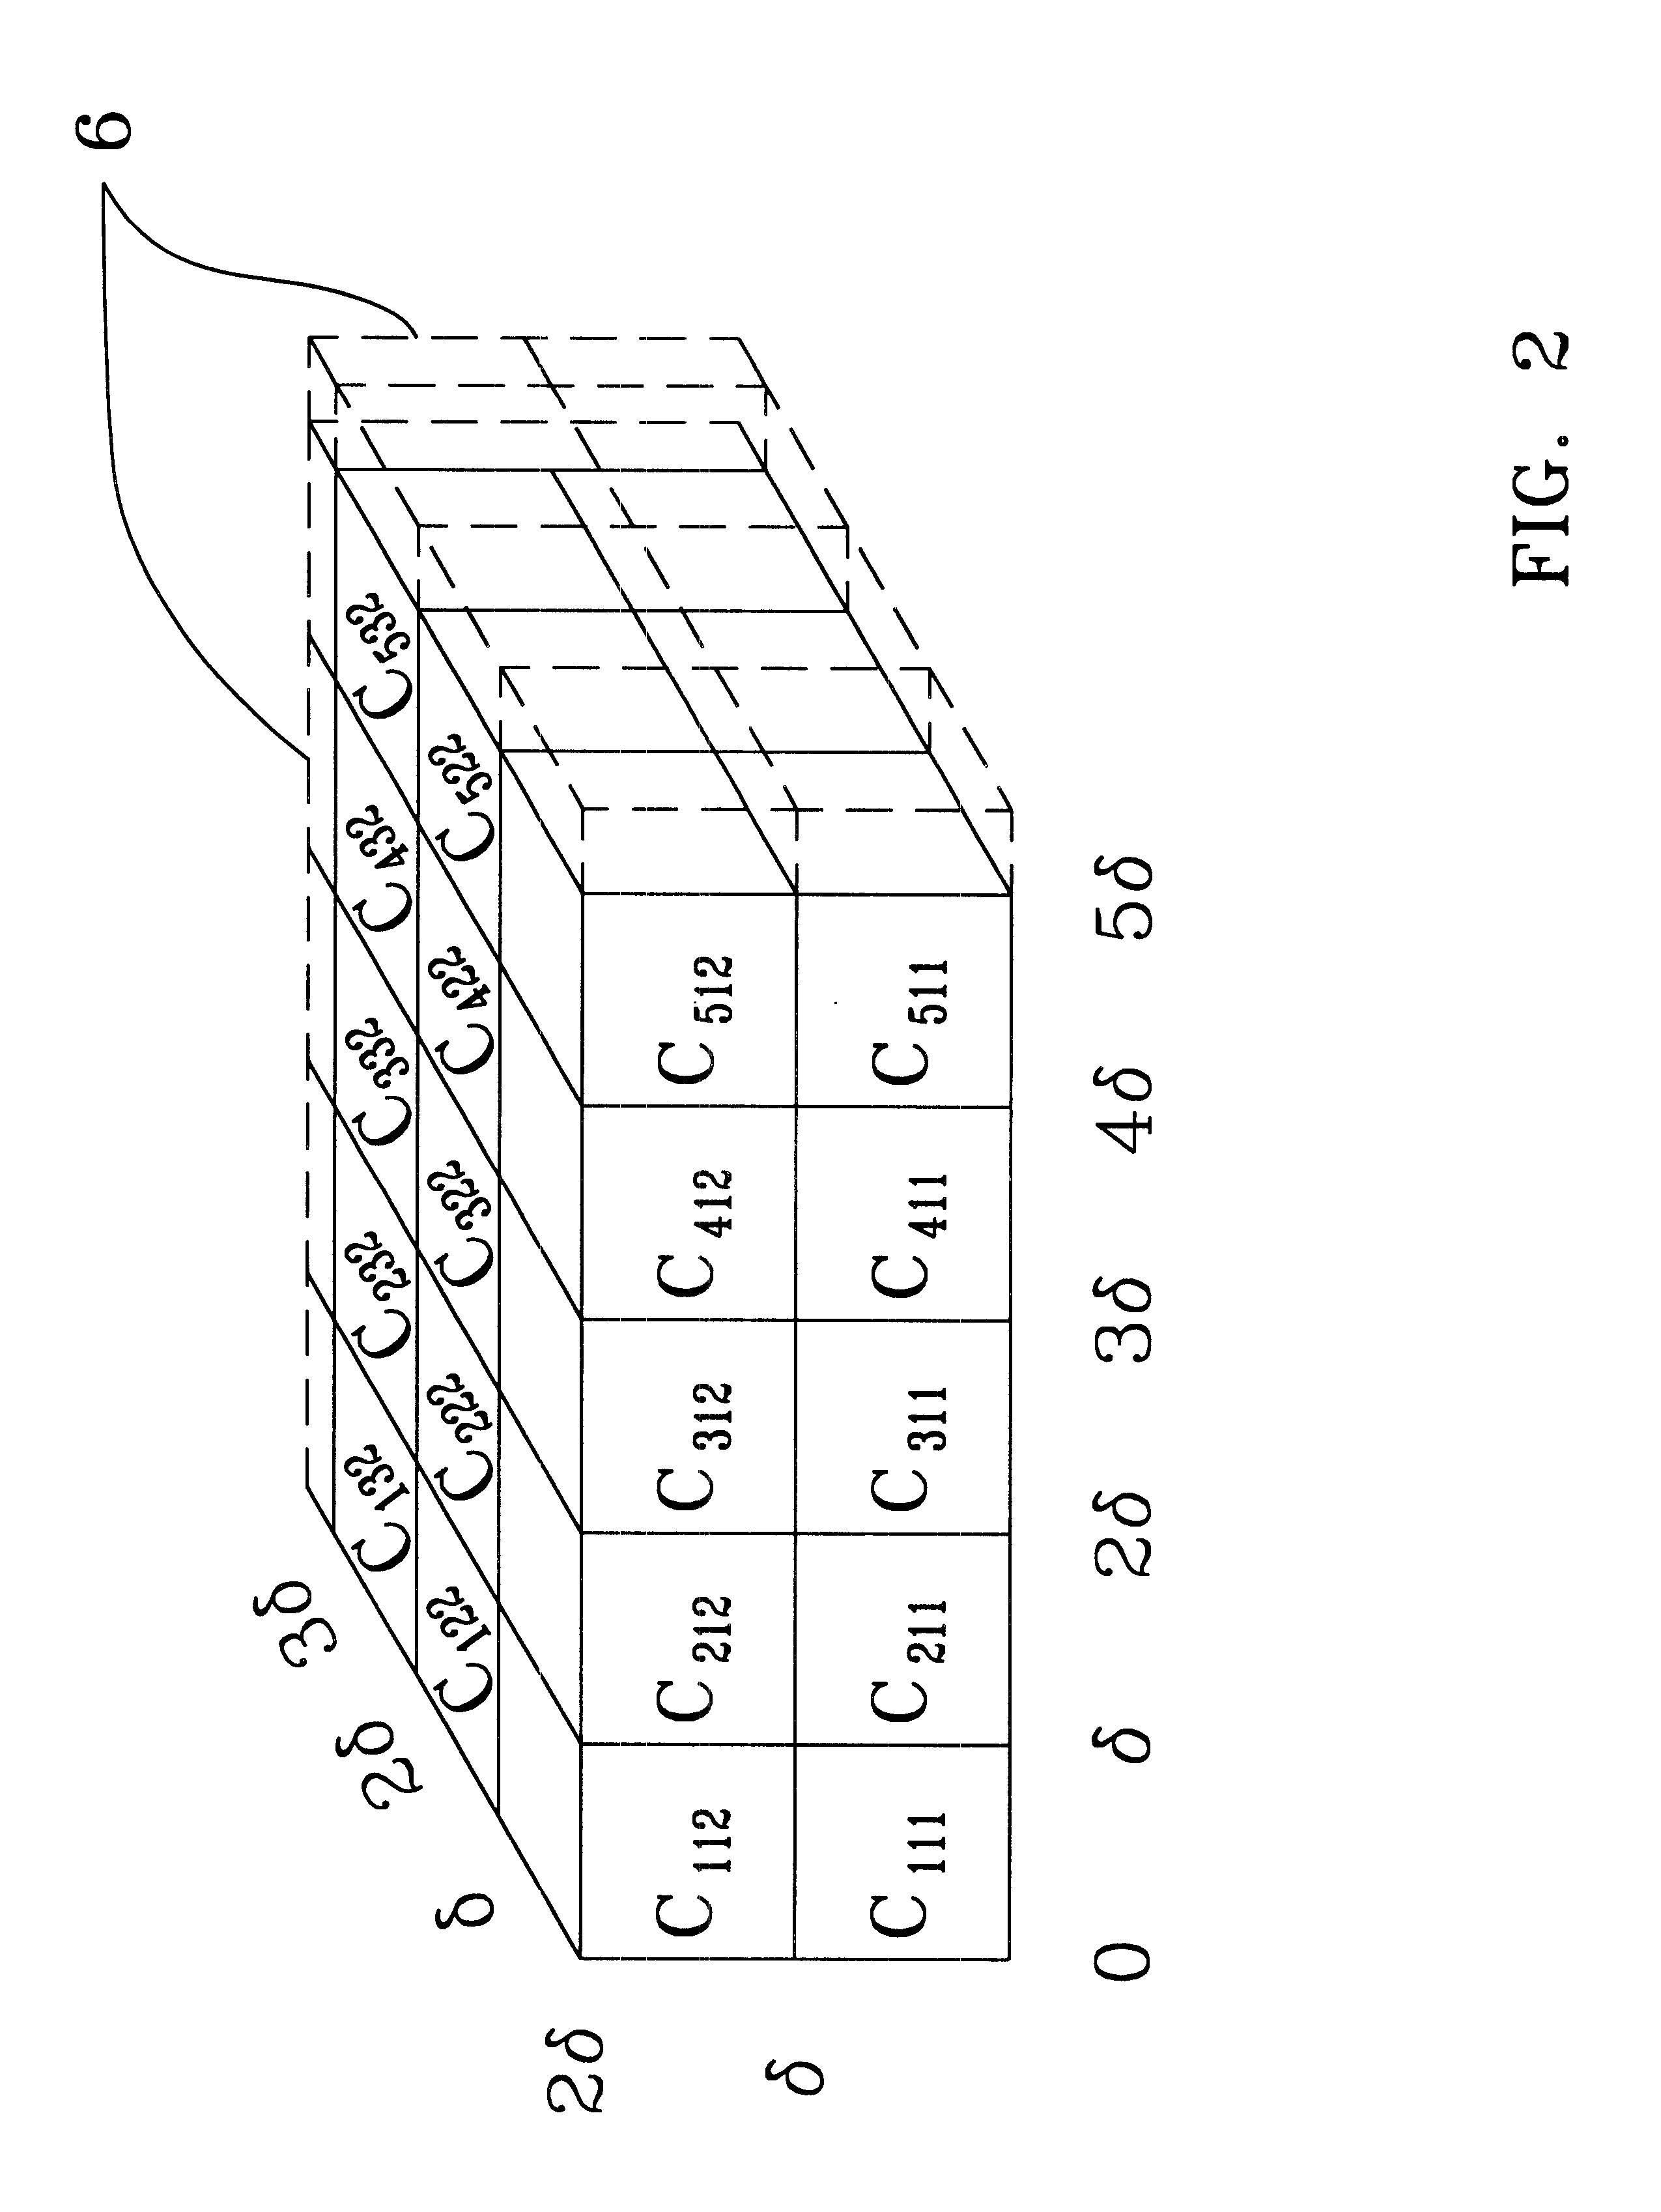
Having thus explained the theory of the invention, an example thereof will now be presented for purposes of further illustration and understanding (see, FIGS. 3 and 4). A value for N is first selected, here N=30 (step 100, FIG. 3). A time series distribution of data points is then read into a display / operating subsystem .delta. adapted to accommodate a data set of size N from data processing system 10 (step 102). Thereafter, the absolute value of the difference between the largest and the smallest data points for each measure, .DELTA.Y and, is determined by a first comparator device 12 (step 104). In this example, it will be assumed that N=.DELTA.t=30 measurements with a measured amplitudes of .DELTA.Y=20 units and .DELTA.Z=9 units. The N, .DELTA.Y and .DELTA.Z values are then used by window creating device 14 to create a virtual volume in the display / operating system enclosing the input time series distribution, the size of the volume so created being .DELTA.t*.DELTA.Y*.DELTA.Z=540...


PUM


Abstract

A method and apparatus are provided for automatically characterizing the spatial arrangement among the data points of a three-dimensional time series distribution in a data processing system wherein the classification of said time series distribution is required. The method and apparatus utilize grids in Cartesian coordinates to determine (1) the number of cubes in the grids containing at least one input data point of the time series distribution; (2) the expected number of cubes which would contain at least one data point in a random distribution in said grids; and (3) an upper and lower probability of false alarm above and below said expected value utilizing a discrete binomial probability relationship in order to analyze the randomness characteristic of the input time series distribution. A labeling device also is provided to label the time series distribution as either random or nonrandom, and/or random or nonrandom within what probability, prior to its output from the invention to the remainder of the data processing system for further analysis.

Description

(1) Field of the InventionThe invention generally relates to signal processing / data processing systems for processing time series distributions containing a small number of data points (e.g., less than about ten (10) to fifteen (15) data points). More particularly, the invention relates to a method and apparatus for classifying the white noise degree (randomness) of a selected signal structure comprising a three dimensional time series distribution composed of a highly sparse data set. As used herein, the term "random"(or "randomness") is defined in terms of a "random process" as measured by the probability distribution model used, namely a nearest-neighbor stochastic (Poisson) process. Thus, pure randomness, pragmatically speaking, is herein considered to be a time series distribution for which no function, mapping or relation can be constituted that provides meaningful insight into the underlying structure of the distribution, but which at the same time is not chaos.(2) Descriptio...

Claims


Application Information

Patent Timeline
IPC IPC(8): G06F17/18G06K9/00
CPCG06F17/18G06K9/0051G06F2218/04
Inventor O'BRIEN, JR., FRANCIS J.NGUYEN, CHUNG T.BATES, BRUCE J.
Owner THE UNITED STATES OF AMERICA AS REPRESENTED BY THE SECRETARY OF THE NAVY
Why Eureka
Try Eureka