Filtering to measure gas concentrations from spectral features

a filtering and gas concentration technology, applied in the field of digital signal processing of spectral data, can solve the problems of many digital steps, less robust than the linear algorithm, and the non-linear least squares are much slower and less robust than the linear algorithm, and the matrix inversion step is usually the most computationally intensive part of the solution

Inactive Publication Date: 2003-09-02
SOUTHWEST SCI
View PDF8 Cites 38 Cited by
  • Summary
  • Abstract
  • Description
  • Claims
  • Application Information

AI Technical Summary

Problems solved by technology

However, it makes use of only a small portion of the recorded spectrum and it is sensitive to changes in the baseline signal that may be present in the absence of the analyte.
Non-linear least squares is much slower and less robust than the linear algorithm.
This method is only accurate to the nearest digital step, so that many digital steps are required.
However, this method requires recalculation of the derivative vector after each new measurement of a sample spectrum.
The matrix inversion step is usually the most computationally intensive part of the solution.
Thus, the procedure disclosed by Ivaldi requires a more expensive, high speed computer for its implementation, or limitations on the update rate.
The cross-correlation algorithm has good signal / noise properties but is relatively slow.
This approach is simple and computationally fast, but has the disadvantage that only a few points are used to determine the spectral shift, resulting in greater susceptibility to noise.
This approach requires that only a small part of the scanned spectrum is digitized, thus, much of the scanned region is not available for analysis.

Method used


Image

  • Filtering to measure gas concentrations from spectral features
  • Filtering to measure gas concentrations from spectral features
  • Filtering to measure gas concentrations from spectral features

Examples


Embodiment Construction

)

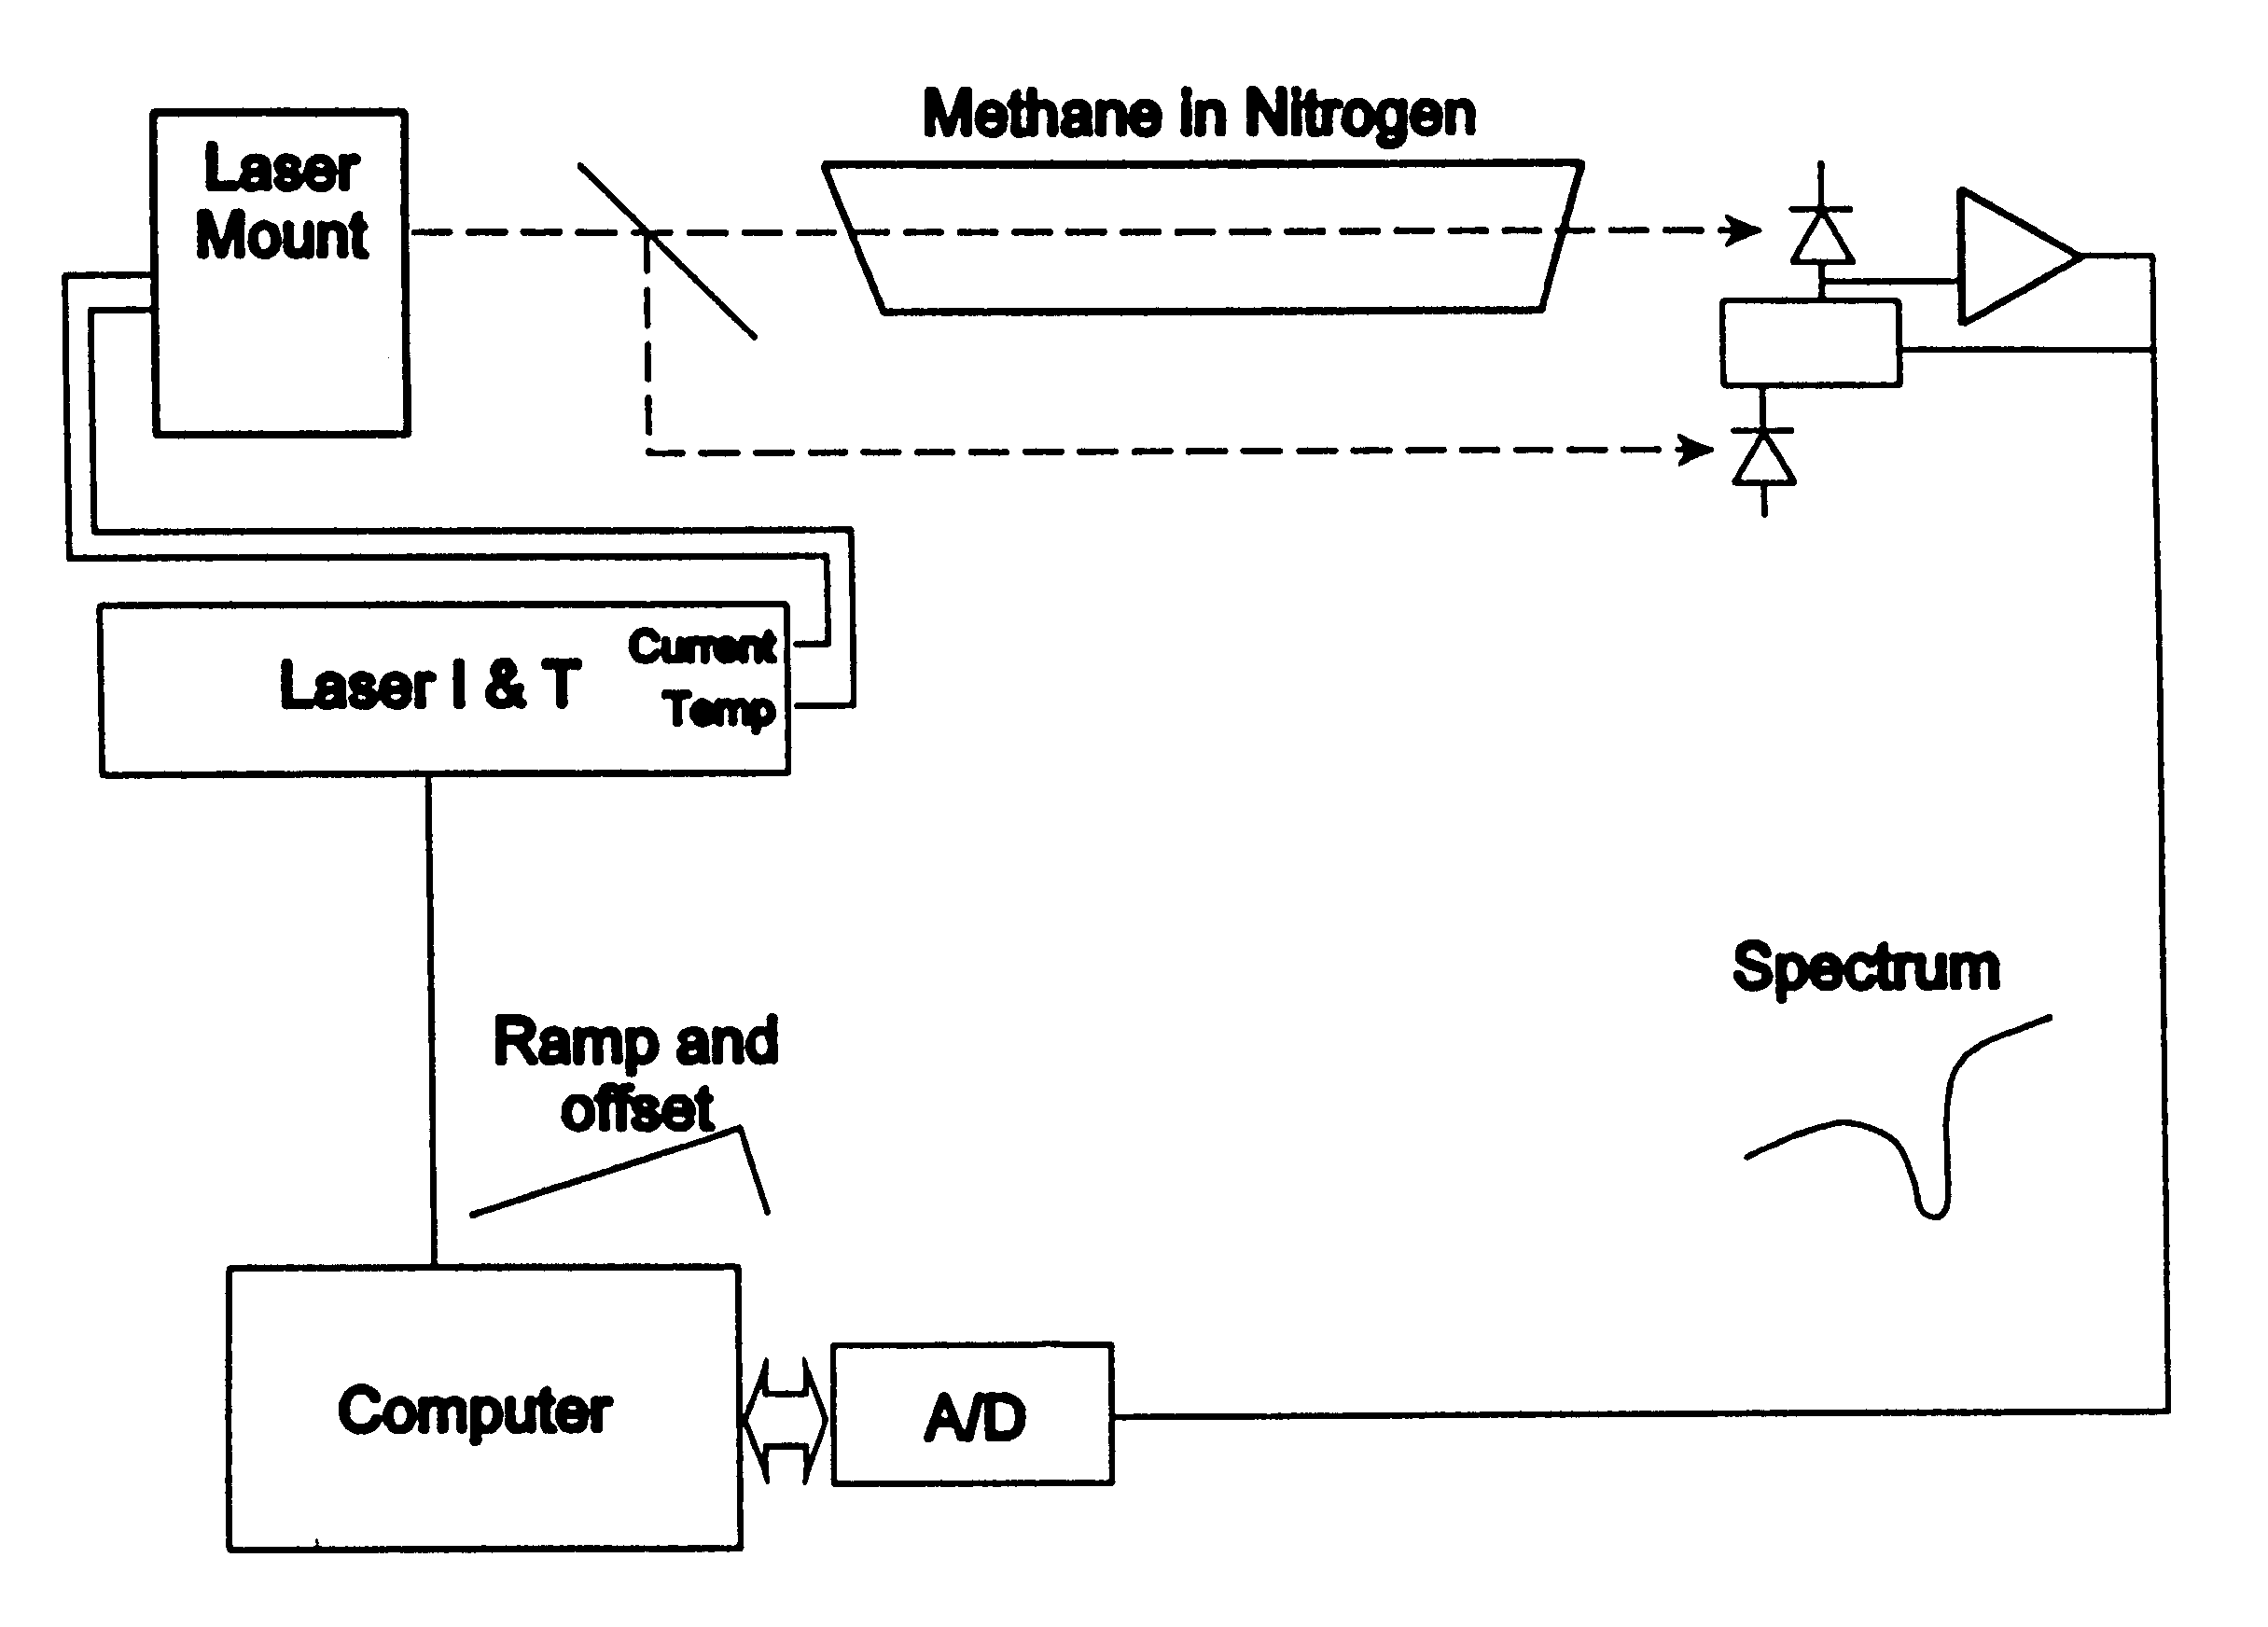
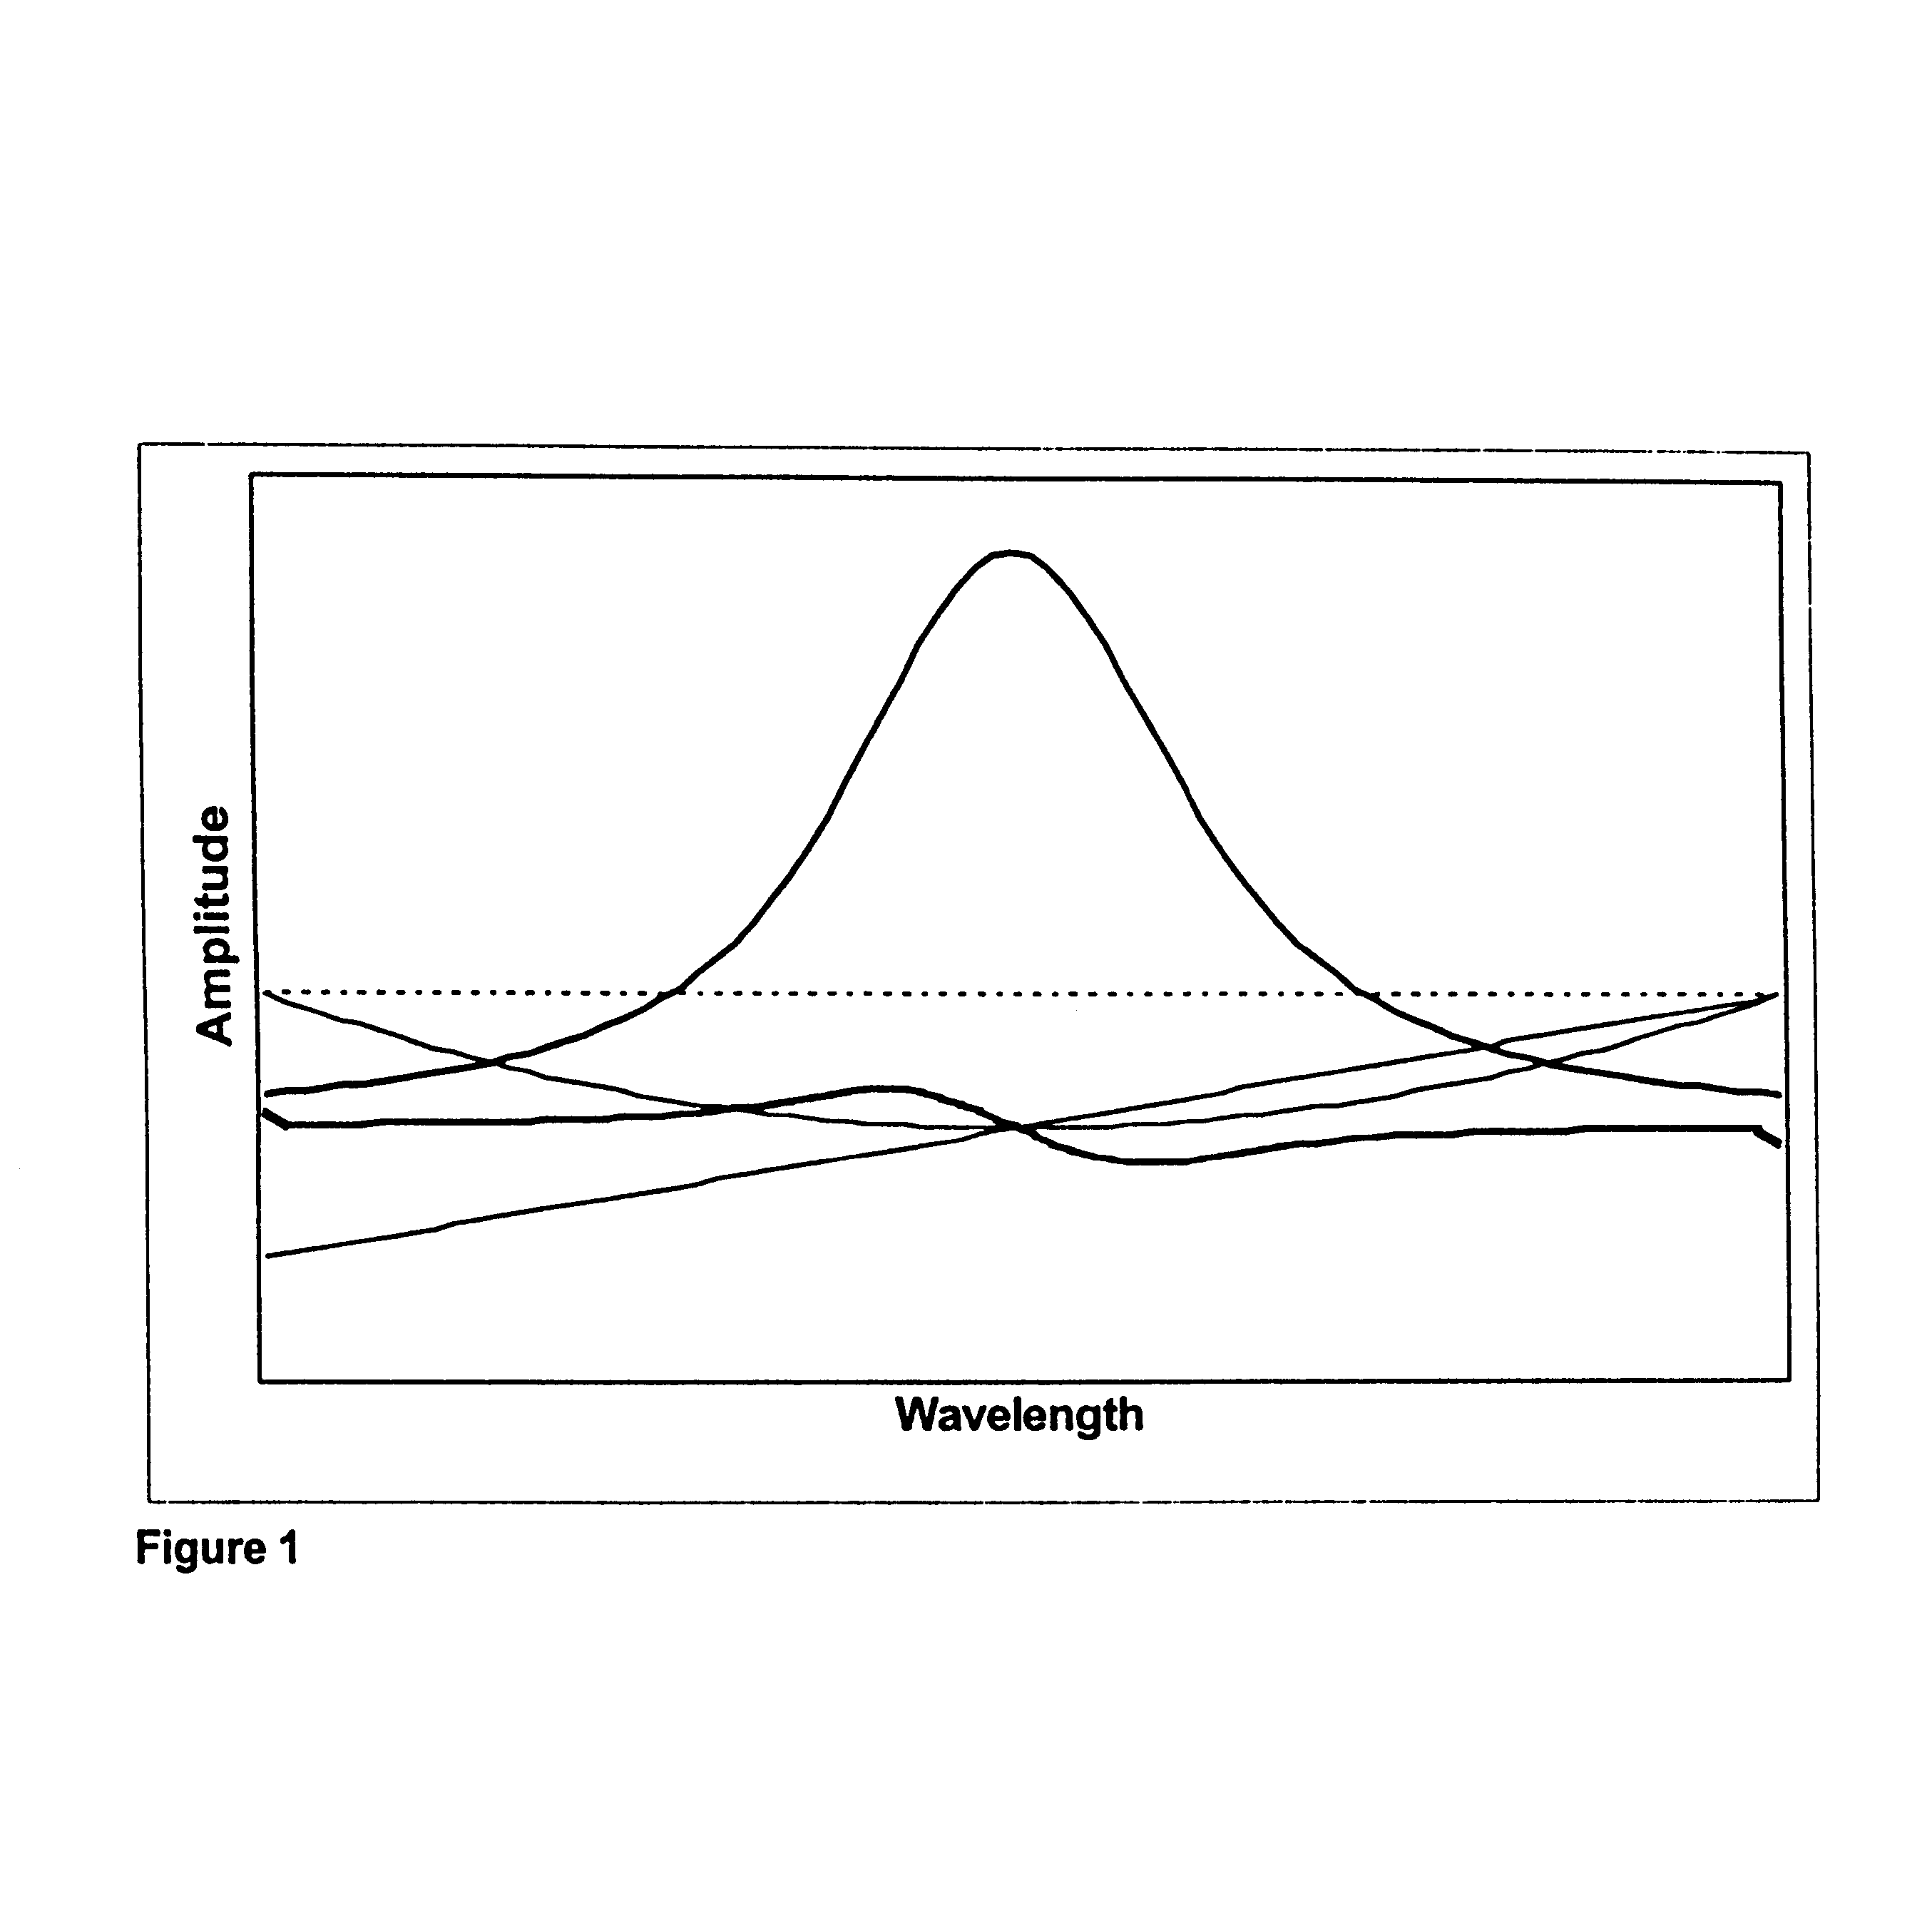
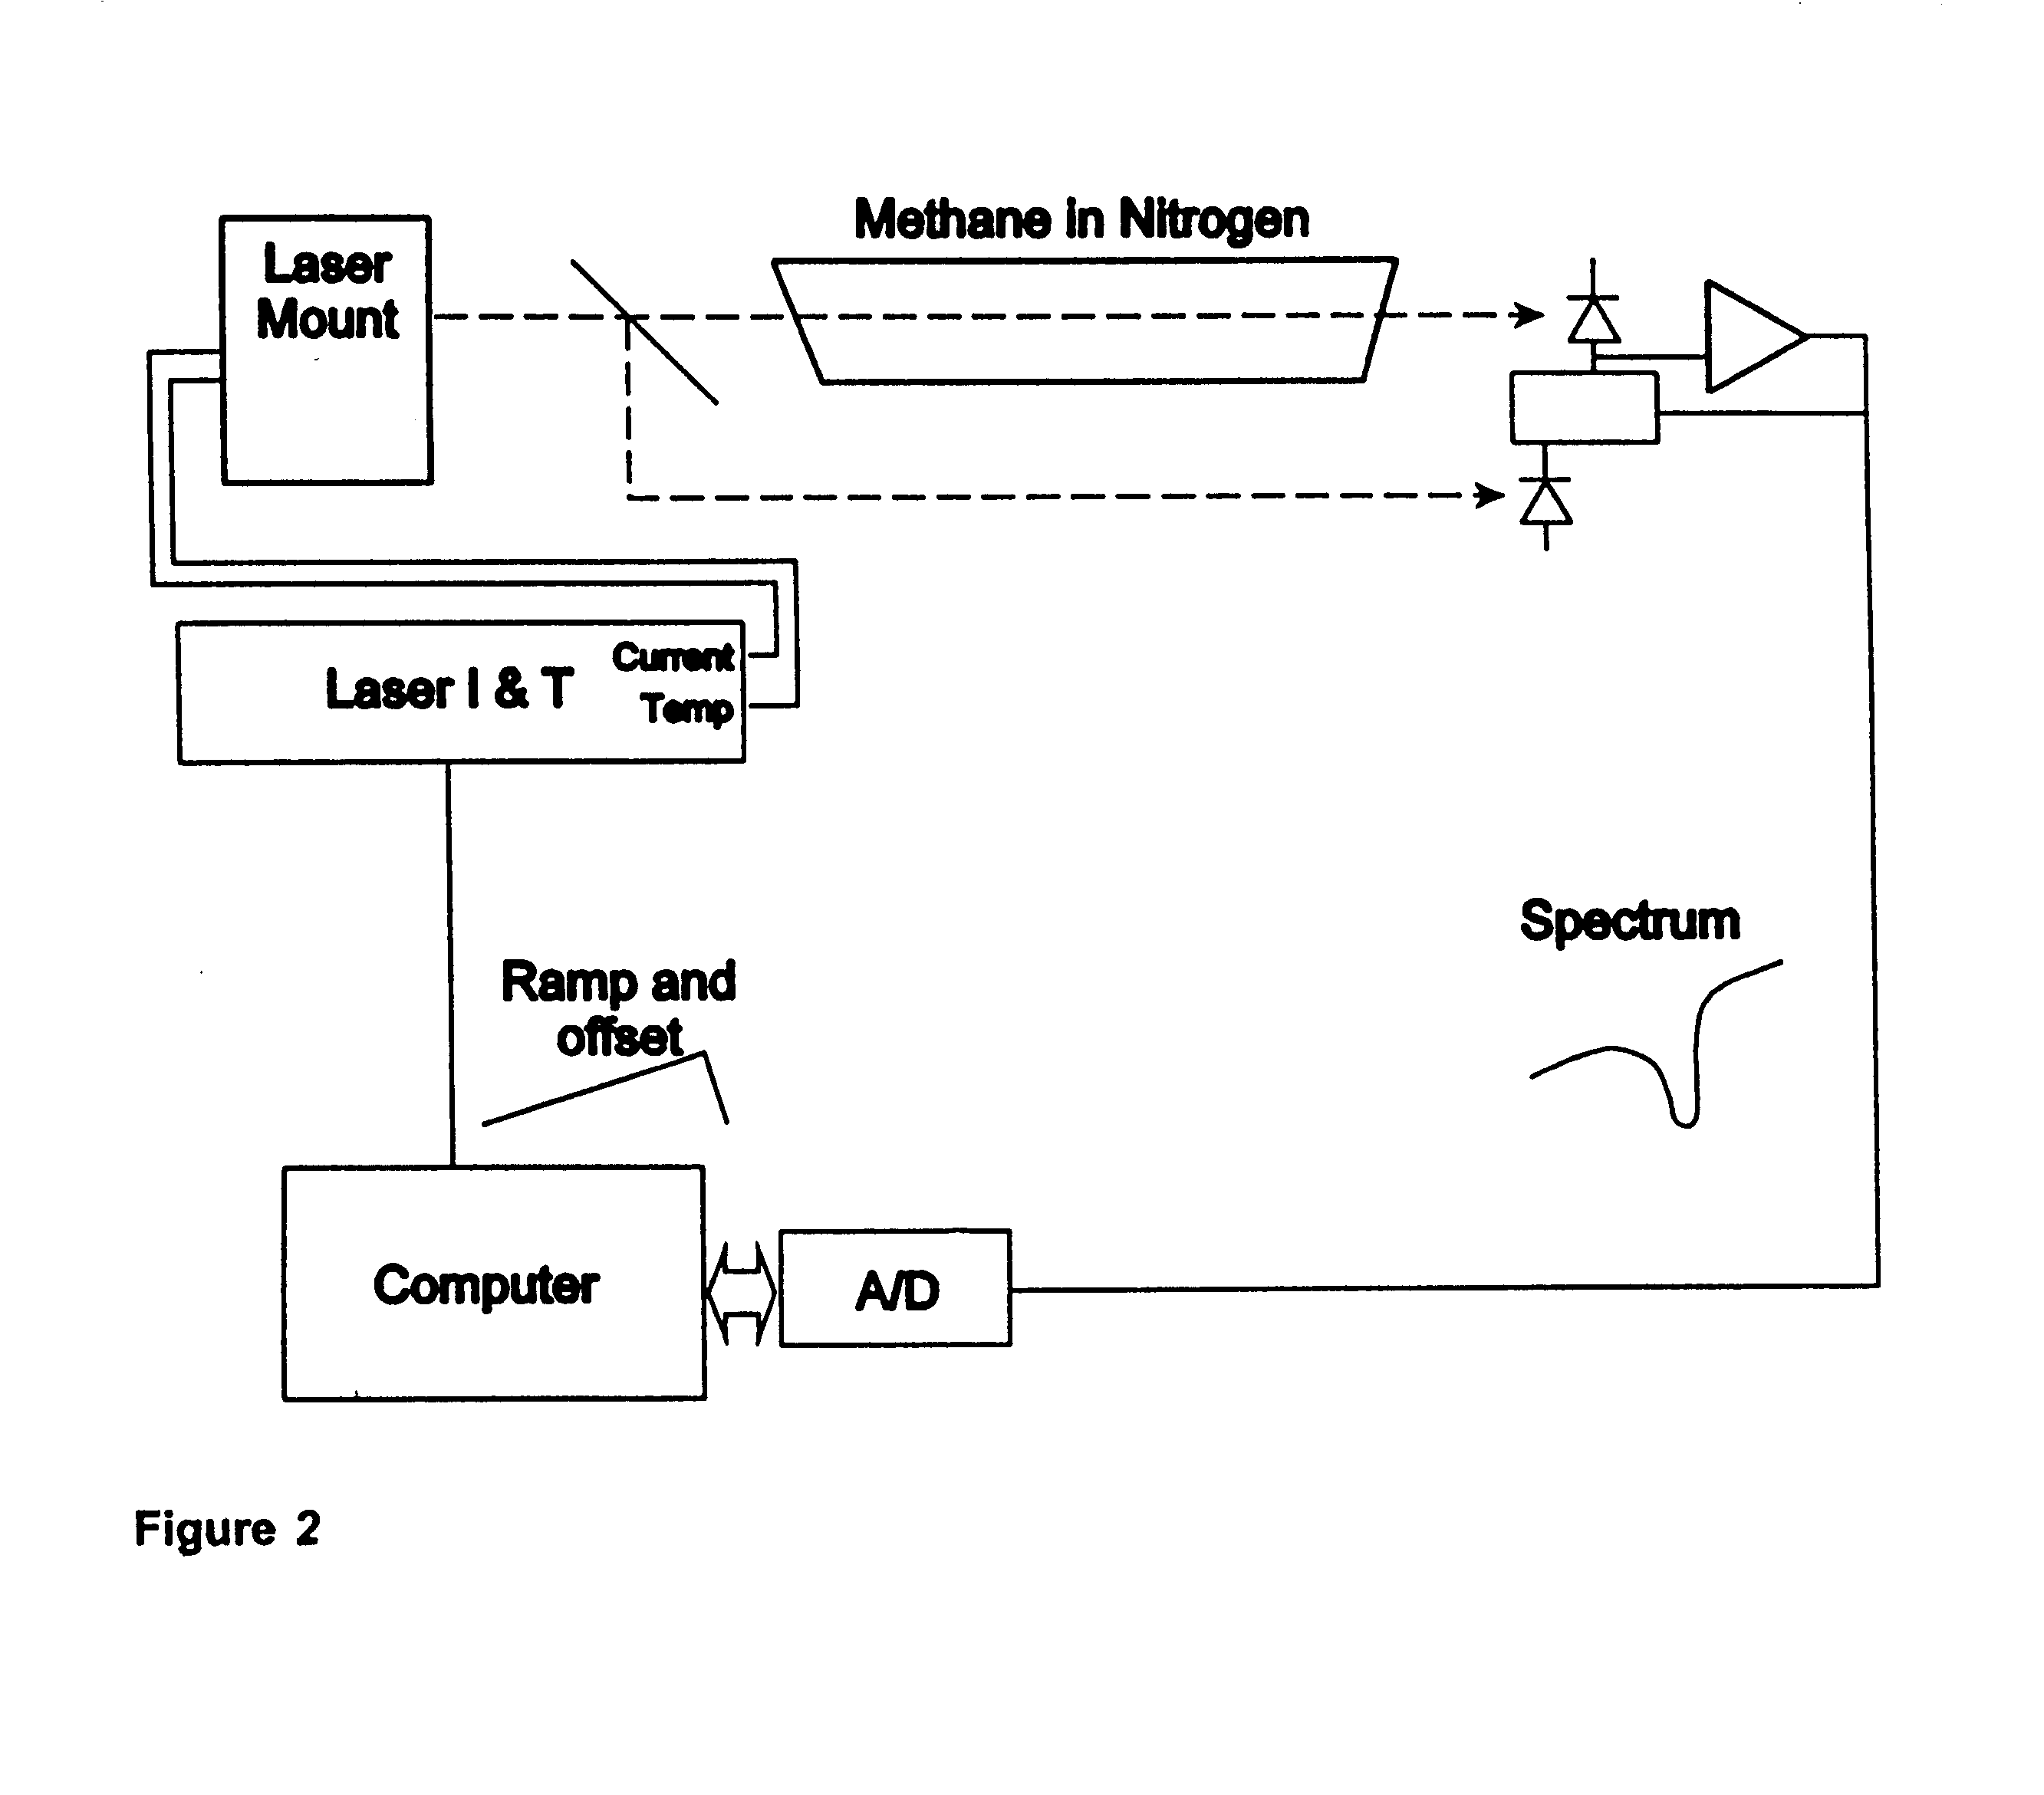
This invention is of a method of and apparatus for digital signal processing of spectral data using a linear least squares algorithm to fit spectral peaks. The invention is computationally rapid and sufficiently flexible to accommodate variations in the spectral parameters, such as peak position or peak width, without loss of accuracy in the computed concentration measurement. It is useful in laser monitoring of gases, Fourier transform spectroscopy, and other fields where spectral peaks are detected or quantified. It can be used to adjust the wavenumber of a laser to stabilize the position of a peak within a spectrum in a manner equivalent to line locking.

The invention provides a method and apparatus for determining the concentration of an analyte or analytes in a sample by analysis of a spectrum of that sample. The analysis uses linear least squares with a model that includes the expected spectral shape of the analyte or analytes under reference conditions of temperature and pres...


PUM


Abstract

A spectrographic apparatus and method comprising providing a spectrometer, digitizing a sample spectrum in a spectral range that includes at least one feature of an analyte, and comparing, via a linear least squares computation, the sample spectrum to a spectrum known to closely approximate the sample spectrum at a reference condition and to one or more derivatives of the known spectrum taken with respect to one or more parameters of the reference condition.

Description

1. Field of the Invention (Technical Field)The present invention relates to digital signal processing of spectral data, particularly for measuring gas concentrations from spectral features.2. Background ArtNote that the following discussion refers to a number of publications by author(s) and year of publication, and that due to recent publication dates certain publications are not to be considered as prior art vis-a-vis the present invention. Discussion of such publications herein is given for more complete background and is not to be construed as an admission that such publications are prior art for patentability determination purposes.In order to detect or quantify the amount of a substance from a measurement of its spectrum, such as a diode laser spectrum of a single absorption line of a trace gas, several approaches have been used. The simplest is to measure the peak height at the wavenumber of its maximum absorbance, which is related to the gas concentration by Beer's Law. This...

Claims


Application Information

Patent Timeline
Patent Type & Authority Patents(United States)
IPC IPC(8): G06F17/10
CPCG06F17/10
Inventor HOVDE, DAVID CHRISTIAN
Owner SOUTHWEST SCI
Why Eureka
Try Eureka