
Method and display for multivariate classification

a multi-variate, classification technology, applied in the field of tissues classification methods, can solve the problems of insatiable statistics and data display methods for this application, prior art approaches lack methods for analyzing large quantities of multi-variate data, and methodologies suffer from a requirement for sophisticated analysis and interpretation by the end user, etc., to achieve the effect of rapid classification of “objects

Inactive Publication Date: 2005-03-15
THE BRIGHAM & WOMEN S HOSPITAL INC
View PDF6 Cites 23 Cited by
  • Summary
  • Abstract
  • Description
  • Claims
  • Application Information

AI Technical Summary

Benefits of technology

The present invention represents a new approach to data analysis for multivariate classification, particularly as used in medical diagnostics. The invention is in part an intuitive decision making tool for rapid classification of “objects” (e.g., cell, tissue or tumor samples) from evaluation of many simultaneous “variables” (e.g., quantitative gene expression profiles). The data analysis methods of the invention provide the end user with a simplified and robust output for diagnostic classification of objects based on identifying and evaluating multiple variables of predetermined diagnostic relevance. The raw data generated by analysis of the variables is transformed by application or appropriate algorithms to scaleless rank differentials between the variables. The rank orders of variables are used to classify tissues based on readily observable user interfaces, such as a graphical (e.g., visual) user interface or an auditory user interface.

Problems solved by technology

The challenge of identifying the data useful in tissue classification from the raw data is a problem that requires a solution that can be applied in clinical settings.
Present statistical and data display methods are not satisfactory for this application.
These methodologies suffer from a requirement for sophisticated analysis and interpretation by the end user.
The prior art approaches thus lack methods for analyzing large quantities of multivariate data using statistically proven methods, yet providing for ready interpretation of the data.
Highly parallel quantitative measurement systems are increasingly available for analysis of complex biological systems, but practical data reduction systems limit application.
This is not readily possible if the different platforms have independent units of measurement, and different sensitivity thresholds.
Diagnostic and prognostic evaluation of tissues is hampered by this cross-platform incompatibility.
Similar problems exist with respect to sample-to-sample, run-to-run and user-to-user variability when using the same device or an identical device.
In addition, the variables are not easily evaluated for any sample, even with the training set data as a comparison.

Method used


Image

  • Method and display for multivariate classification
  • Method and display for multivariate classification
  • Method and display for multivariate classification

Examples


examples

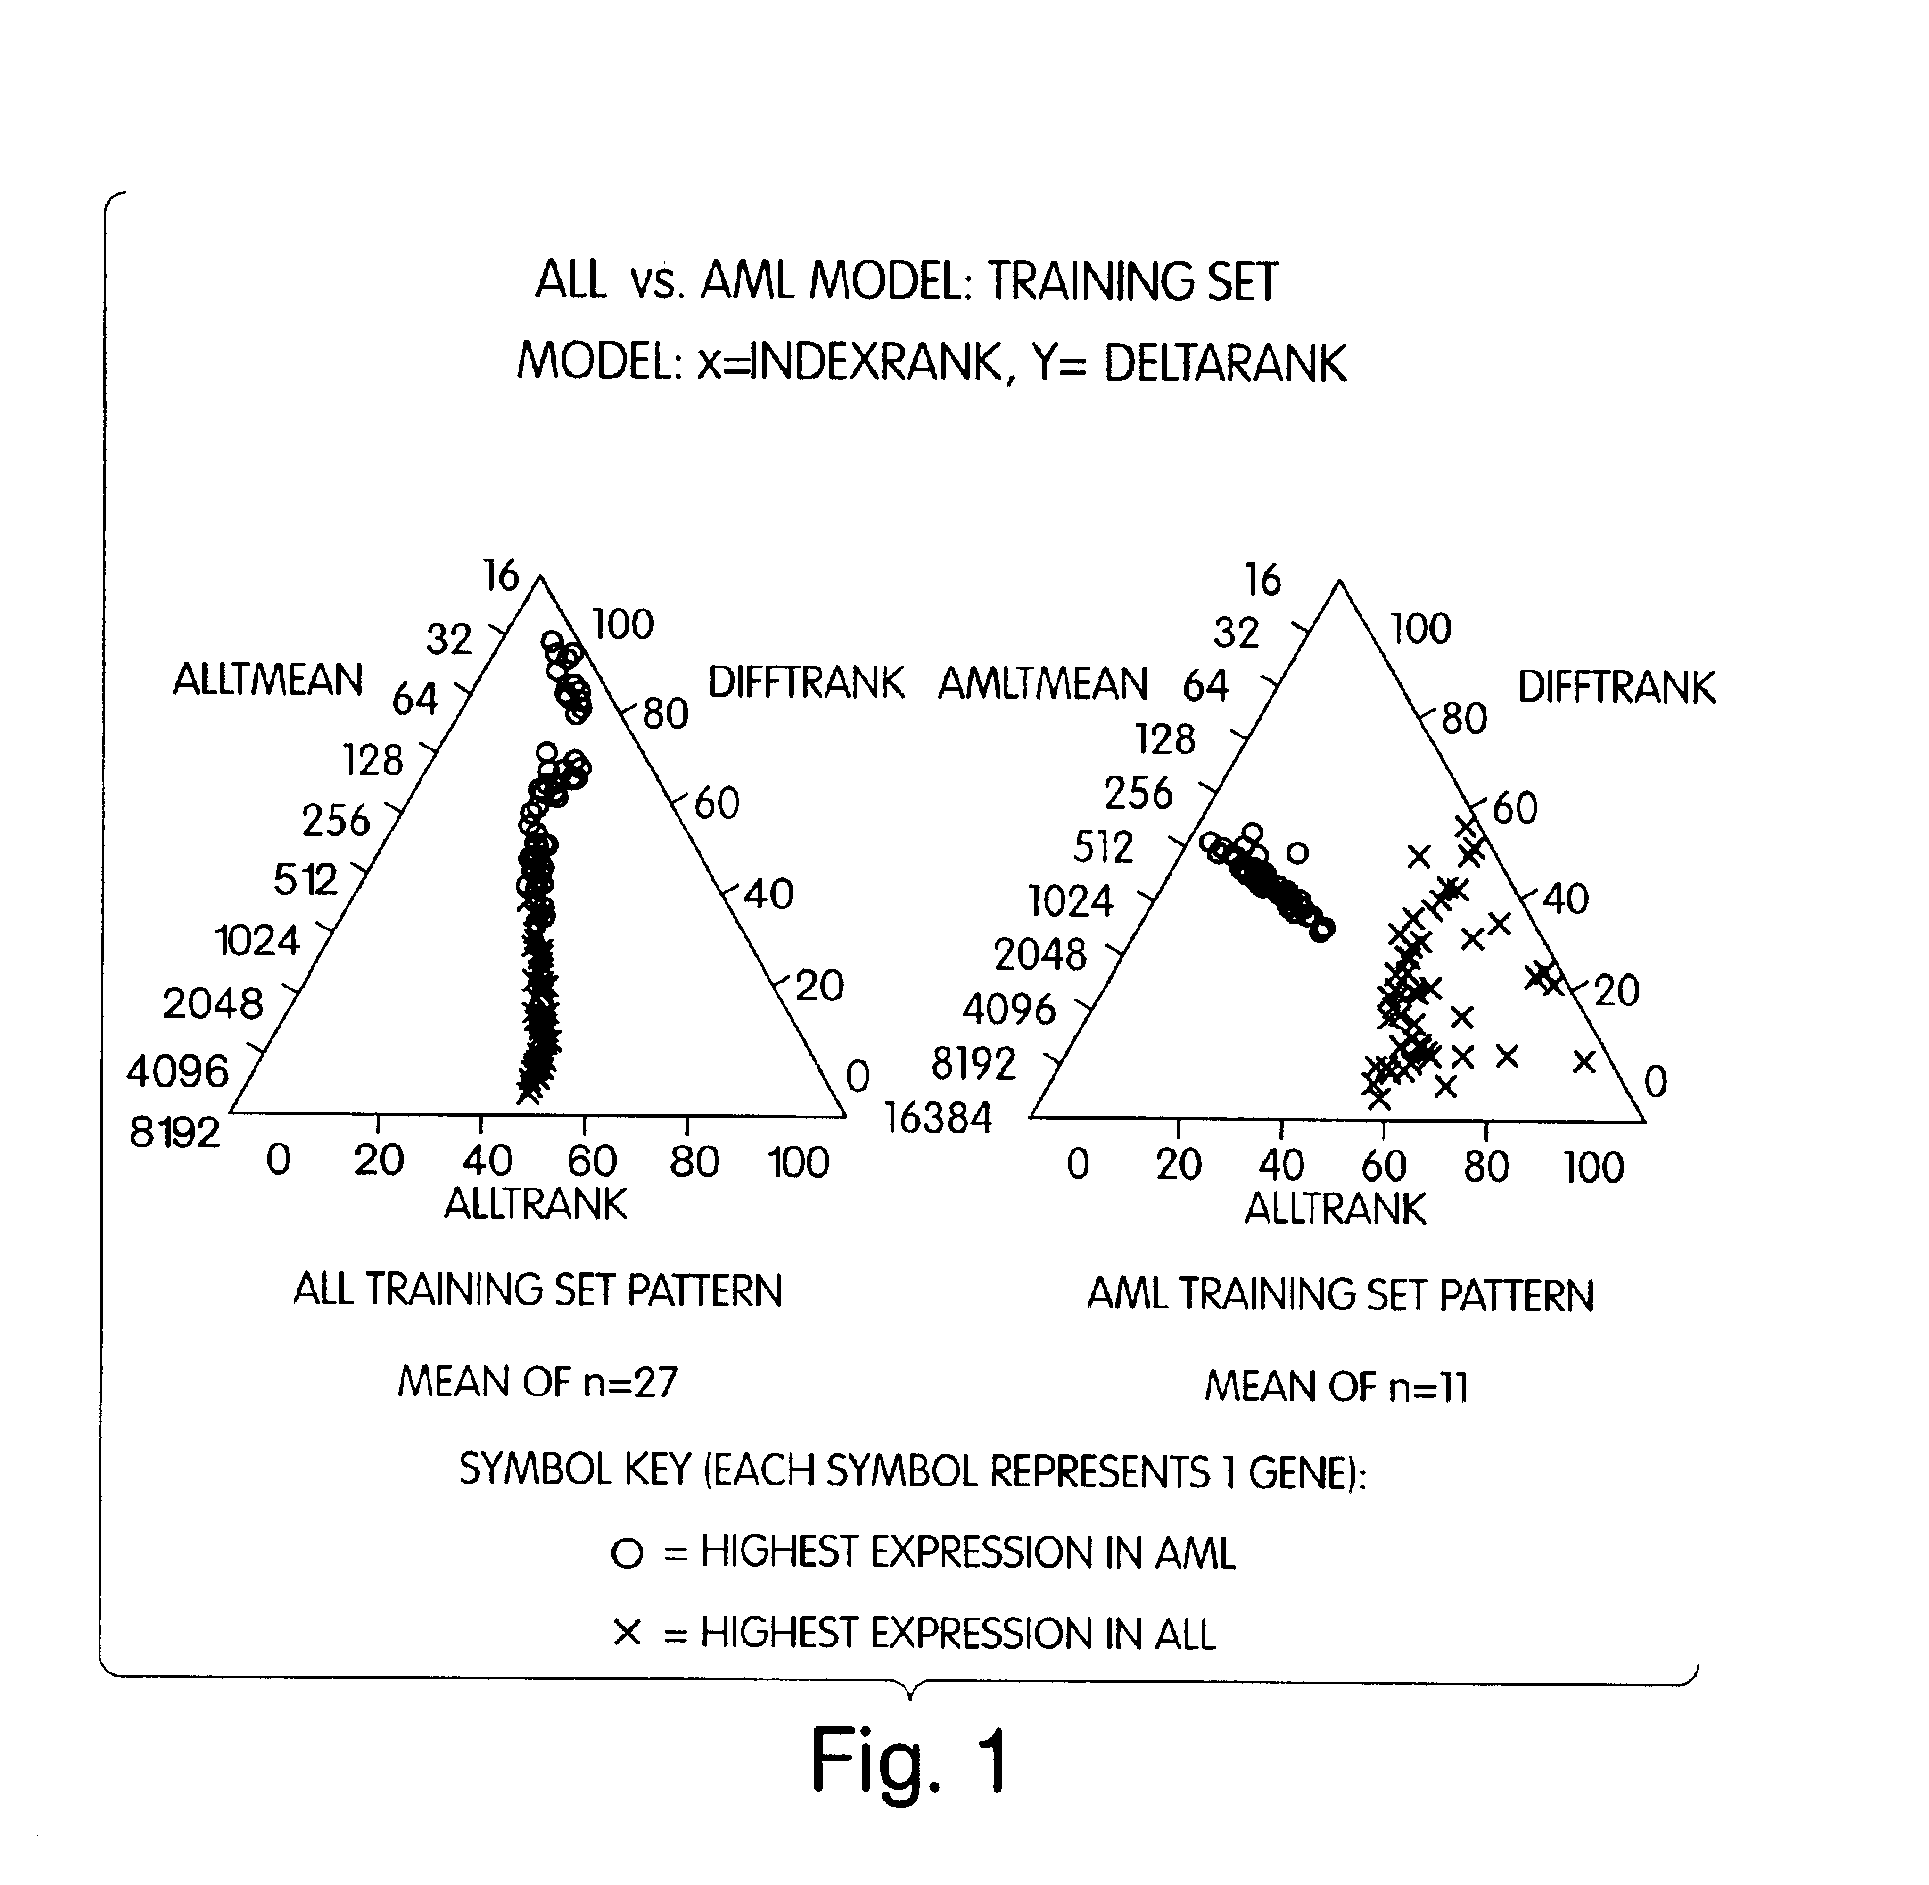
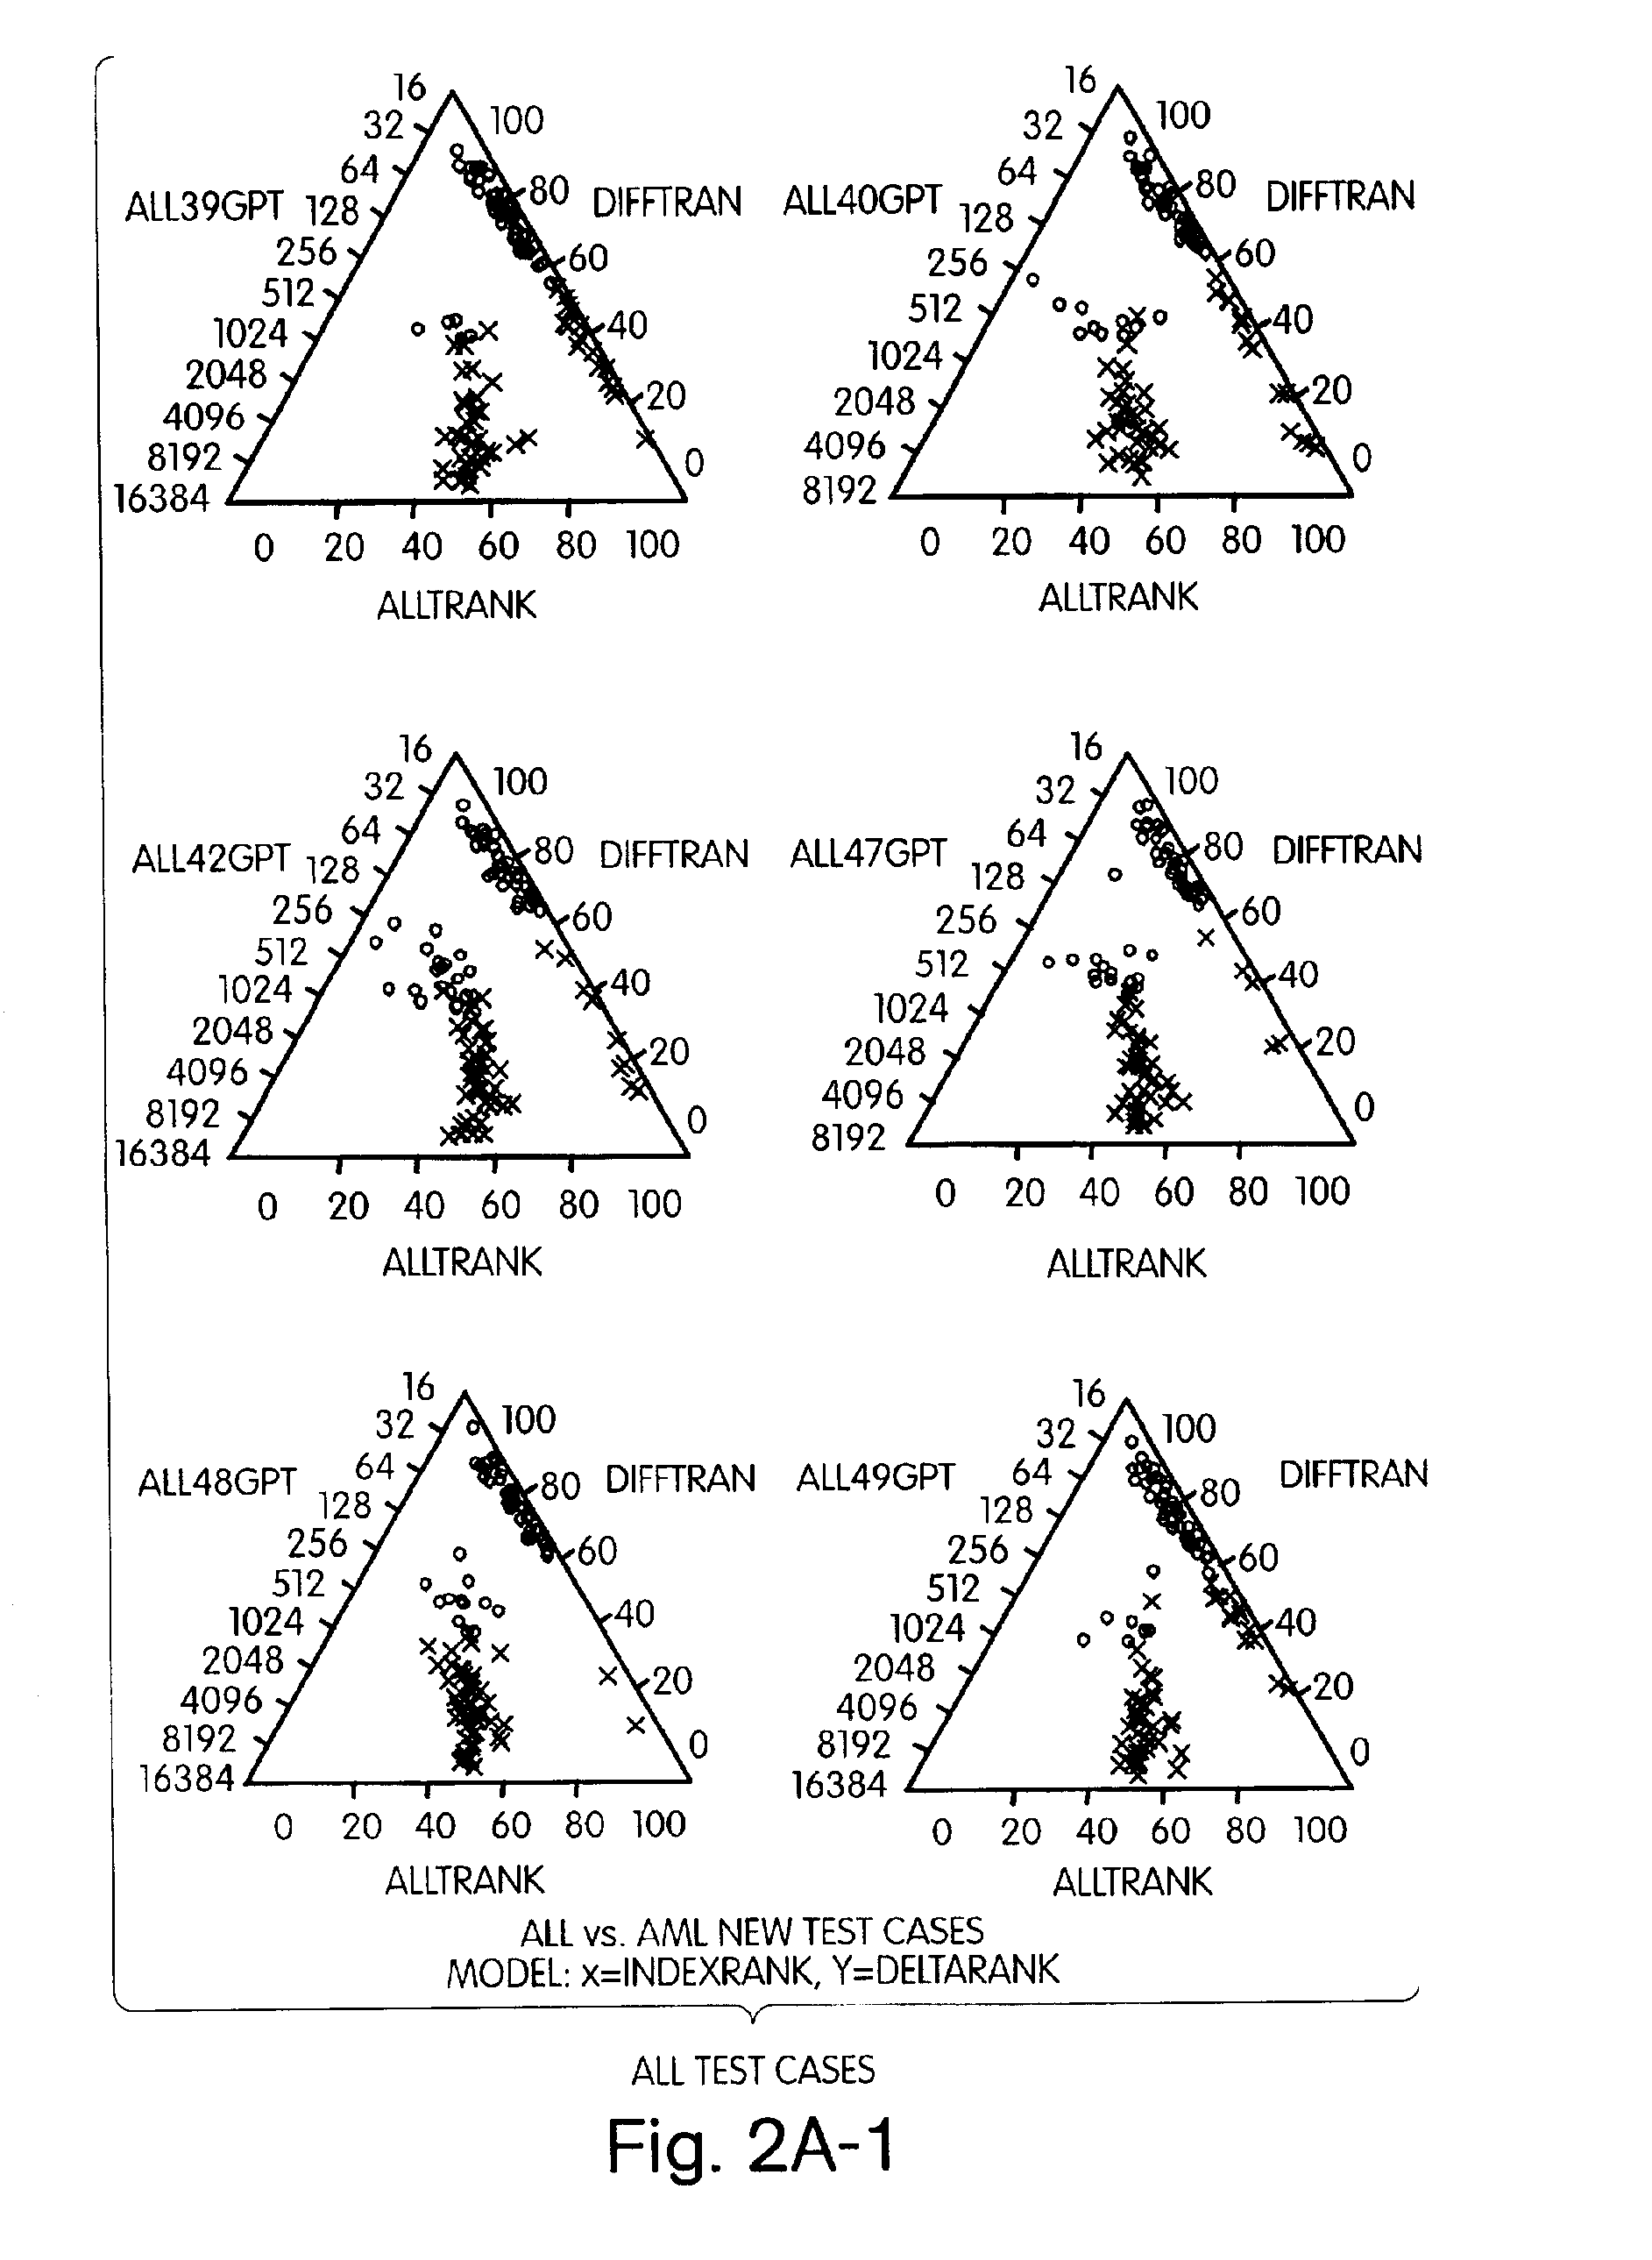
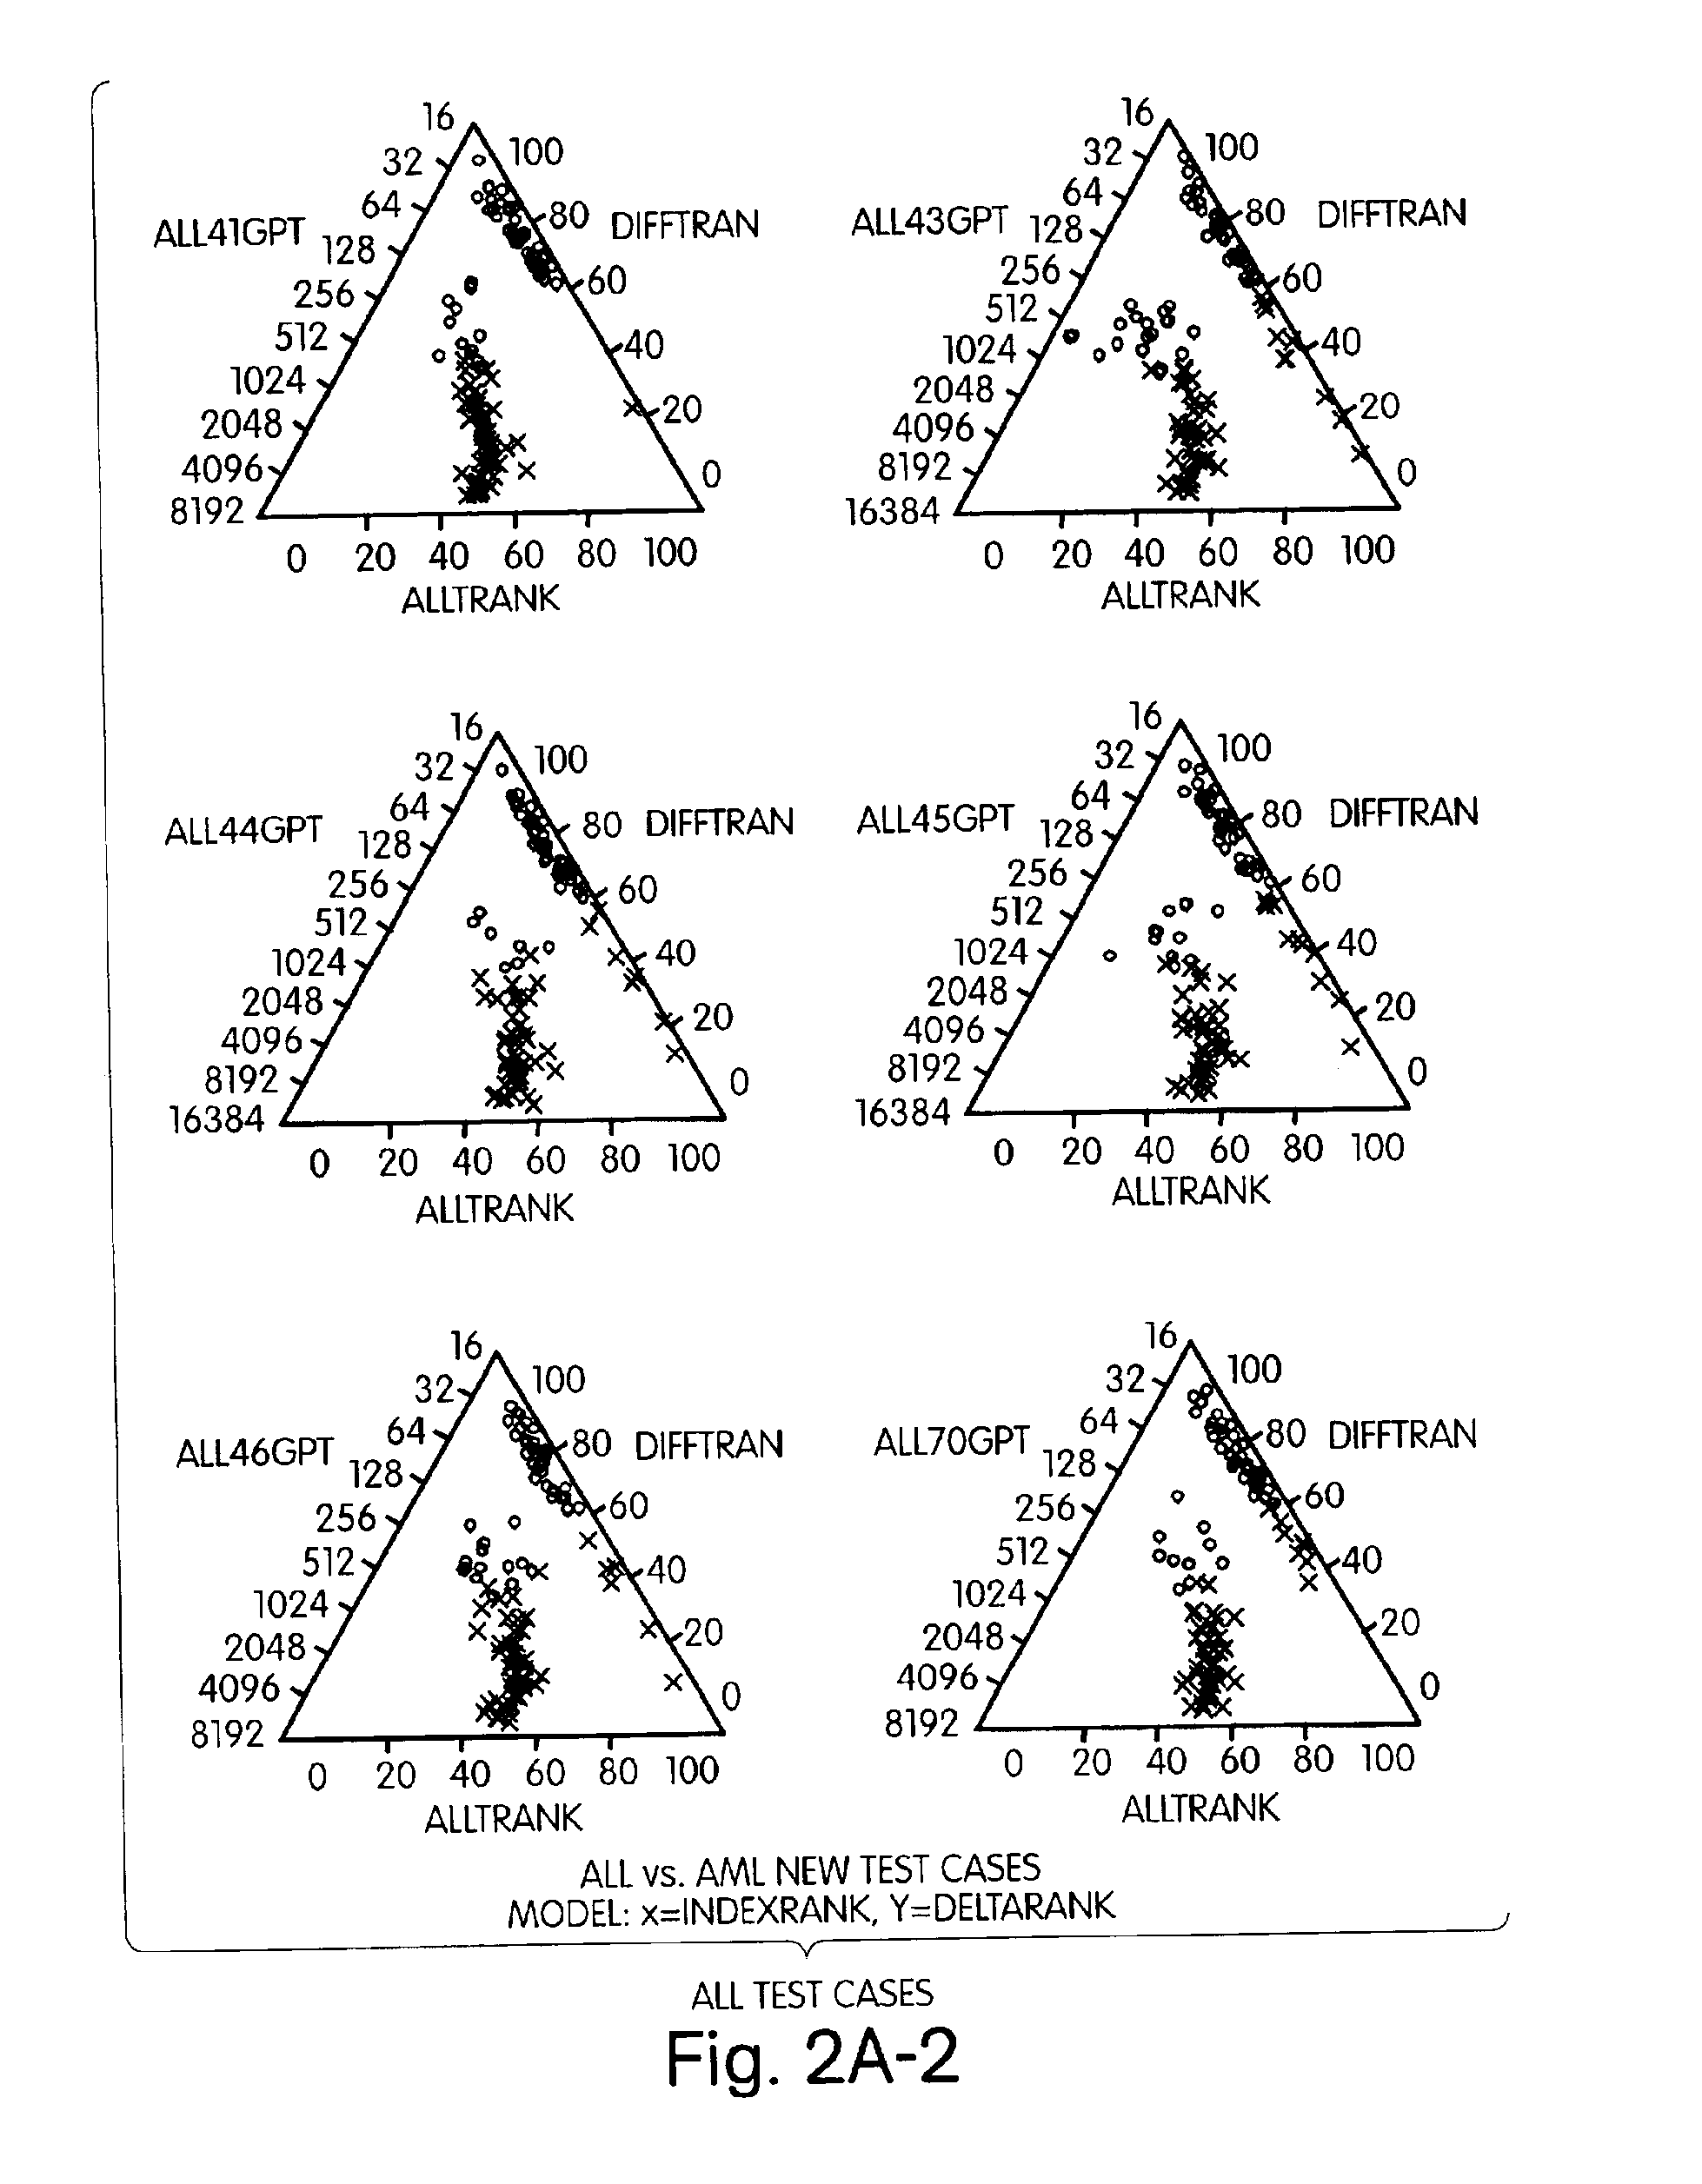
As a proof of concept, gene expression in tissues of Acute Lymphocytic Leukemia (ALL) and Acute Myelogenous Leukemia (AML) were classified. The gene expression data show that the two tumor types have systematic differences in gene expression. The data published by Golub et al. (Science 286:531-537, 1999) were used; expression of 5000+ genes was analyzed from 27 (ALL) and 11 (AML) training tissues.

The 100 genes which best distinguish the two groups were selected by standard statistical approaches (FIG. 7). First, the mean expression values of the two groups were compared, and only those with a minimum-3-fold and 100-unit difference between means were retained. The logged means were then rank ordered by t-test and the top 50 genes which were upregulated in AML, and the top 50 upregulated in ALL were selected for modeling. This represented 100 genes, or variables, which distinguish the two groups of AML and ALL. The objective was to develop a model of how these variables can distinguis...


PUM


Abstract

The present invention represents a new approach to data analysis for multivariate classification, particularly as used in medical diagnostics. The invention is in part an intuitive decision making tool for rapid classification of “objects” (e.g., cell, tissue or tumor samples) from evaluation of many simultaneous “variables” (e.g., quantitative gene expression profiles). The data analysis methods of the invention provide the end user with a simplified and robust output for diagnostic classification of objects based on identifying and evaluating multiple variables of predetermined diagnostic relevance. The raw data generated by analysis of the variables is transformed by application or appropriate algorithms to scaleless rank differentials between the variables. The rank orders of variables are used to classify tissues based on readily observable user interfaces, such as a graphical (e.g., visual) user interface or an auditory user interface.

Description

FIELD OF THE INVENTIONThe invention relates to methods of classifying tissues based on multivariate data for diagnostic, prognostic or therapeutic purposes. The invention also relates to methods and user interfaces for displaying such multivariate data to facilitate rapid decision making.BACKGROUND OF THE INVENTIONClassification of tissues historically depended on an examination of the gross morphology and histology of the tissues. The inadequacy of these methods for classification of tissues that are similar in appearance, such as different tumors arising from the same tissue or organ, is known. More recently, methods of tissue analysis and classification have been developed that rely on genetic analysis of tissues. While these genetic analytical methods are more powerful for distinguishing tissue types, and are simple to practice, the methods also generated quantities of data that are orders of magnitude greater than classical histology methods. For example, gene expression profil...

Claims


Application Information

Patent Timeline
IPC IPC(8): G01N33/50G06F19/00G16B40/00G16B25/10
CPCG06F19/20G06F19/24G06F19/26G16B25/00G16B40/00G16B45/00G16B25/10
Inventor MUTTER, GEORGE L.
Owner THE BRIGHAM & WOMEN S HOSPITAL INC
Learn More