Visualization method and visualization system

a visualization method and visualization system technology, applied in the field of computerized system modeling, can solve problems such as problems, weak connection, and difficulty in seeing and comprehending the overall significance, and achieve the effect of flexible visualization methods

Inactive Publication Date: 2005-03-29
BAYES INFORMATION TECH
View PDF9 Cites 17 Cited by
  • Summary
  • Abstract
  • Description
  • Claims
  • Application Information

AI Technical Summary

Benefits of technology

An object of the invention is to realize a flexible visualization method. A further object of the invention is to realize a method, which is able to handle heterogeneous data straightforwardly and enables the visualization of heterogeneous data.

Problems solved by technology

In a complex domain, where each data point may have several attributes, this conventional approach produces typically a great number of charts, with a very weak connection to each other.
From such a sequence of charts it is usually very difficult to see and comprehend the overall significance of the results.
If each data vector has a great number of components, which are usually called attributes, problems are encountered since besides the three dimensions offered by a three-dimensional display, only a few additional dimensions can be represented in this manner by using, for example, color and shape variations when representing the data.
Another even more significant limitation concerns the use of more elaborate conventional data dimension reduction methods that can be used to define a visualization vector for a data vector.
The geometric distances between the data vectors do not properly reflect the properties of complex data domains, where the data typically is not coded in a geometric or spatial form.
For example, as many data sets contain nominal or ordinal attributes, this means that some of the data vector components have nominal or ordinal values, and finding a reasonable coding with respect a geometric distance metric, for example the Euclidean distance metric, is a difficult task.
To circumvent this problem, the attributes can of course be normalized, but it is not at all clear what is the optimal way to implement the normalization.
A third significant limitation is related to data mining.
The probably invoked new requests cause a new processing cycle with a relatively long time delay.

Method used


Image

  • Visualization method and visualization system
  • Visualization method and visualization system
  • Visualization method and visualization system

Examples


second embodiment

In a method according to the invention, the pairwise distance between two data vectors xi and xj is defined by

d(xi,xj)=−log P(MAP(xi)=MAP(xj)),  (4)

where MAP(xi) denotes the maximum posterior probability assignment for the target attributes X1, . . . , Xm with respect to the selected predictive distribution. Similarly as the distance metric defined in Equation 3, also here the distance between two data vectors xi and xj is determined using a first instance P(X1, . . . , Xm|xiC) and a second instance P(X1, . . . , Xm|xjC) of the selected predictive distribution. The distance metrics defined in Equations 3 and 4 are supervised, as some attributes are selected as target attributes. Consequently, a visualization method using either of these distance metrics is a supervised method.

third embodiment

It is possible to define the pairwise distances by using more than one conditional predictive distribution. In a method according to the invention, the pairwise distance between two data vectors xi and xj is defined in the following way d⁢ ⁢(xi,xj)=-∑k=1n⁢ ⁢log⁢ ⁢P⁢ ⁢(MAPk⁢ ⁢(xi)=MAPk⁢ ⁢(xj)),(5)

where MAPk denotes the maximum posterior probability value of target attribute Xk with respect to predictive distribution P(X1|xC). This means that each attribute Xk is in turn selected as a target attribute in a conditional predictive distribution. The distance metric defined in Equation 5 is unsupervised, as all attributes are treated equally. When this metric is used with unsupervised models, it is usually enough to construct one model, as various conditional predictive distribution can be obtained from an unsupervised model. If this metric is used With supervised models, it may be necessary to construct several probabilistic models. For example, if the naive Bayes model is used, typicall...

fourth embodiment

In a method according to the invention, the pairwise distance between two data vectors xi and xj is defined as the symmetric Kullback-Leibler-divergence (see, for example, (Gelman, Carlin, Stern, Rubin, 1995)) between a first instance P(X1, . . . , Xm|xiC) and a second instance P(X1, . . . , Xm|xjC) of the predictive distribution conditioned with the variable value assignments present in a data vector. A Kullback-Leibler divergence has an infinite range, which may lead to computational problems with practical implementations. Preferably, the visualization vectors are found minimizing Equation 2, in other word using the Sammon's mapping.

It is also possible to use a predictive distribution to define the visual locations directly. In a method according to a further embodiment of the invention, the visualization space is a space where each dimension represents directly a component of an instance of a predictive distribution. A component of an instance of a predictive distribution means ...


PUM


Abstract

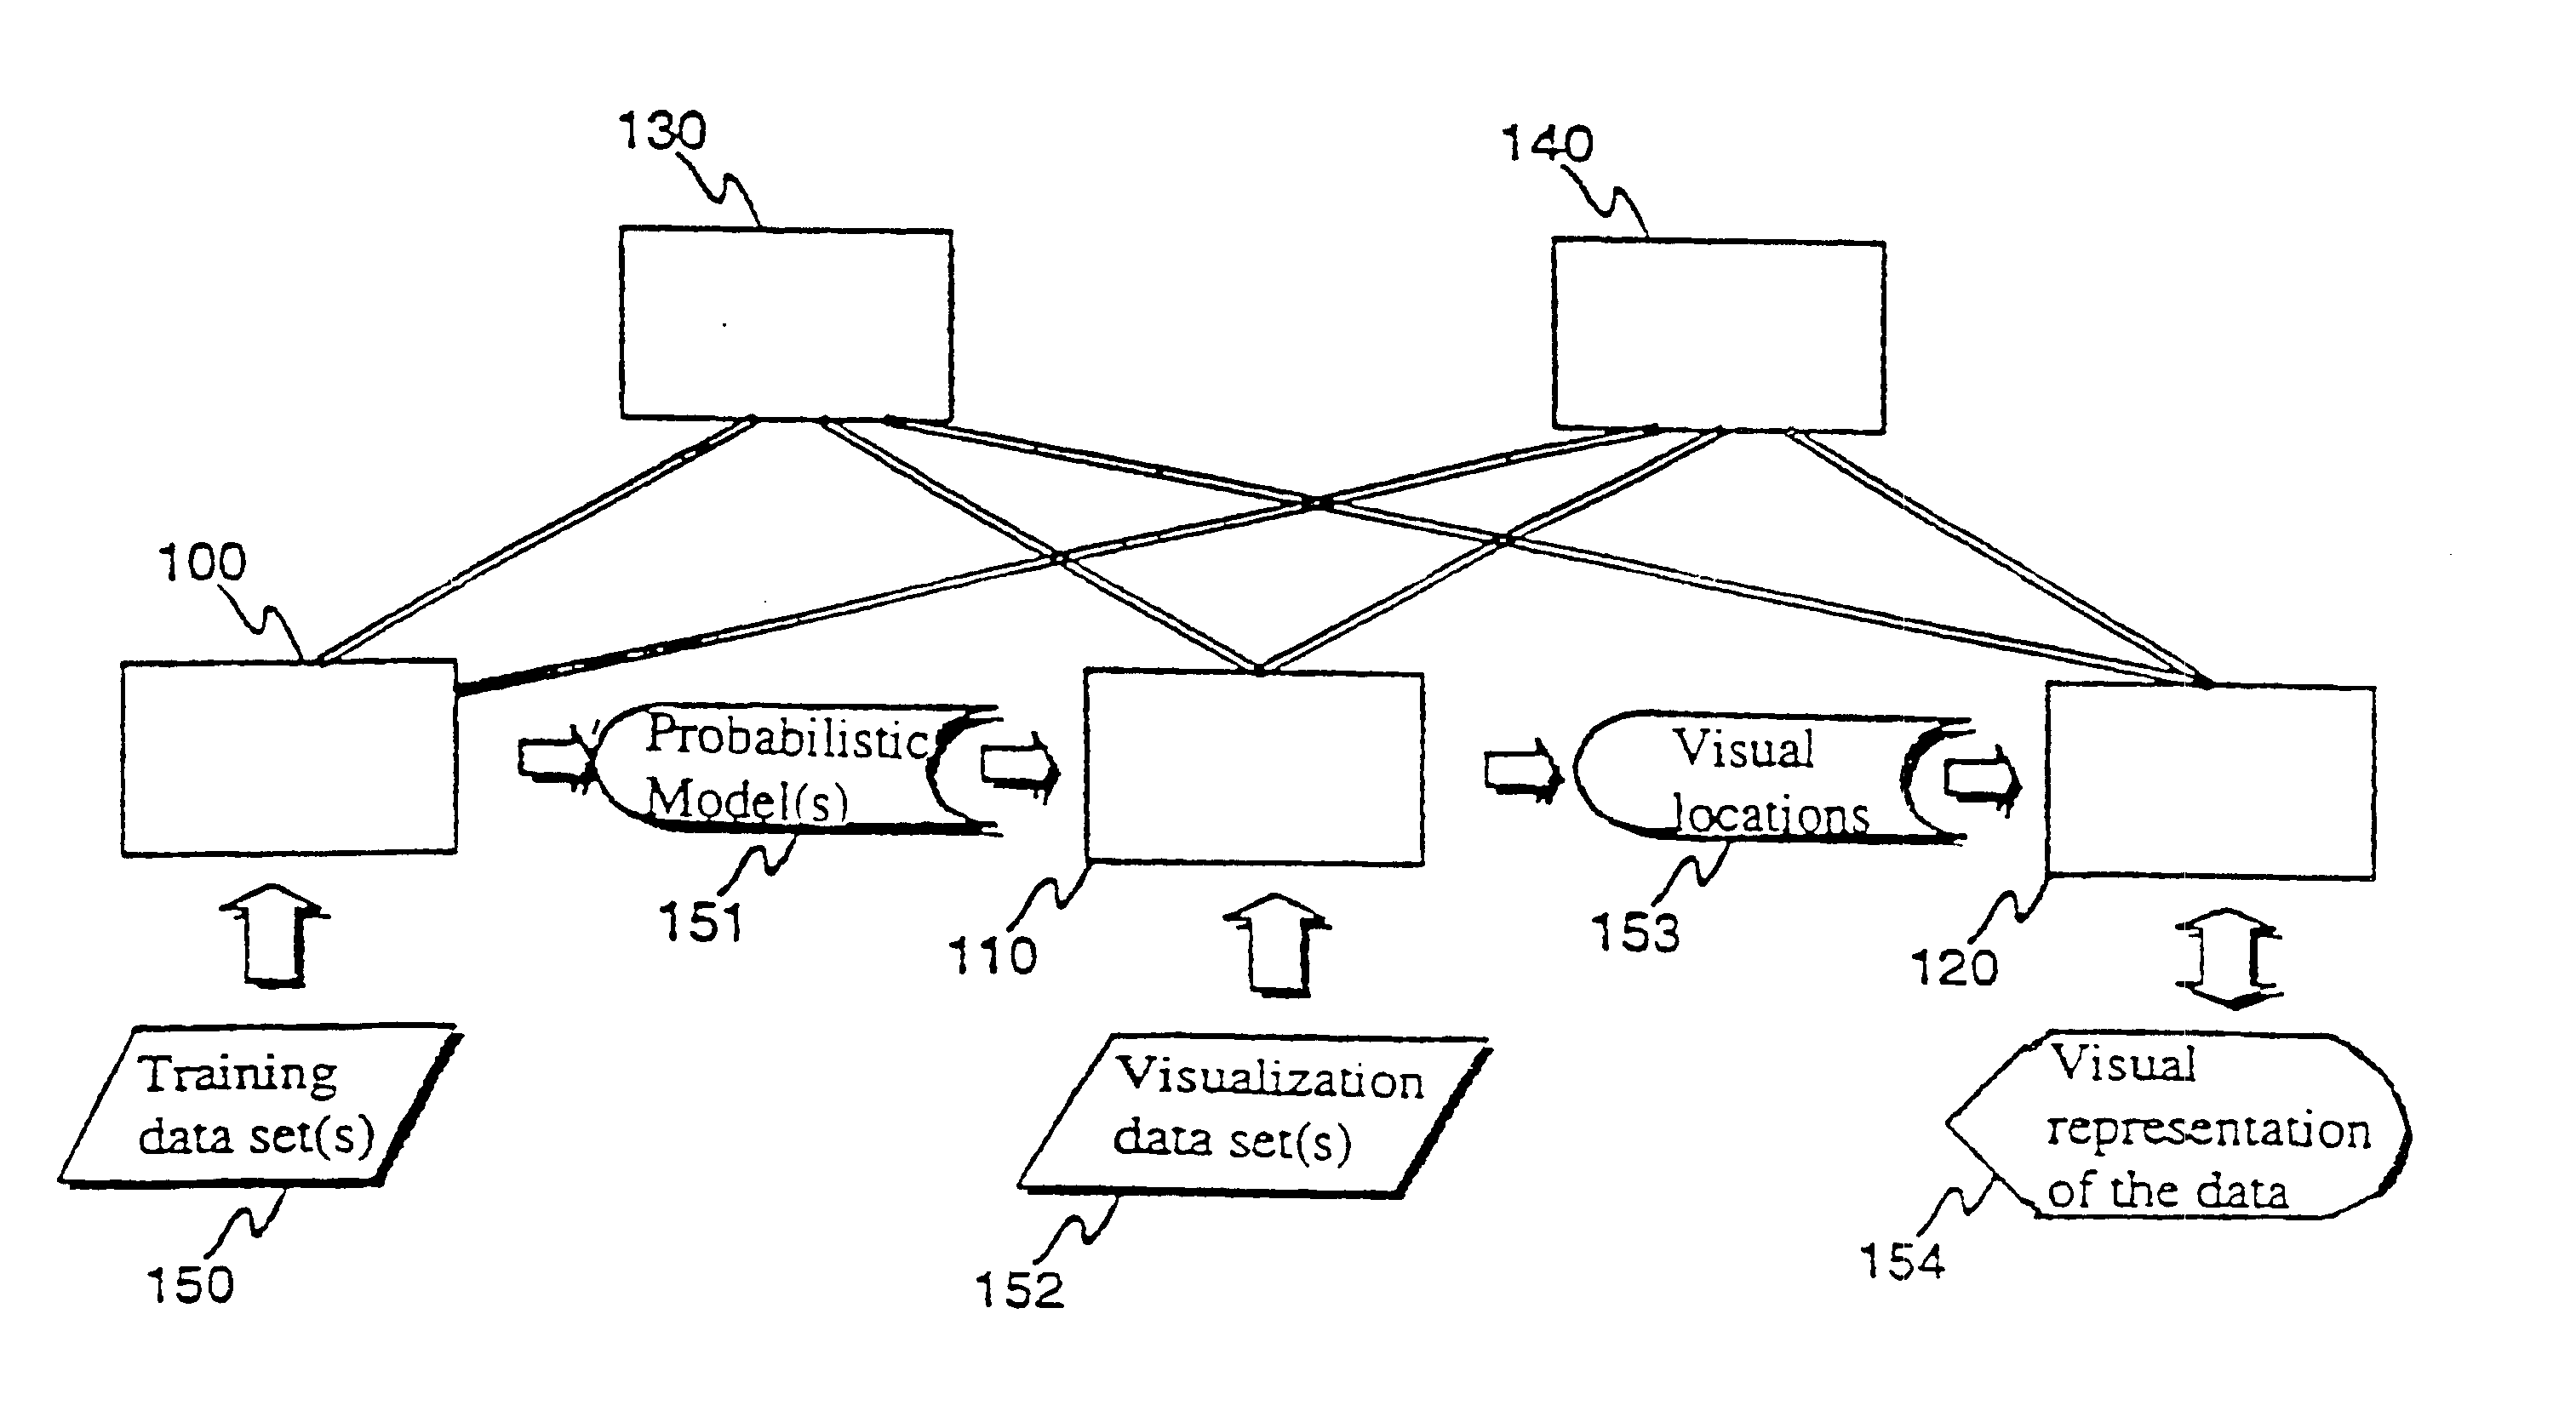
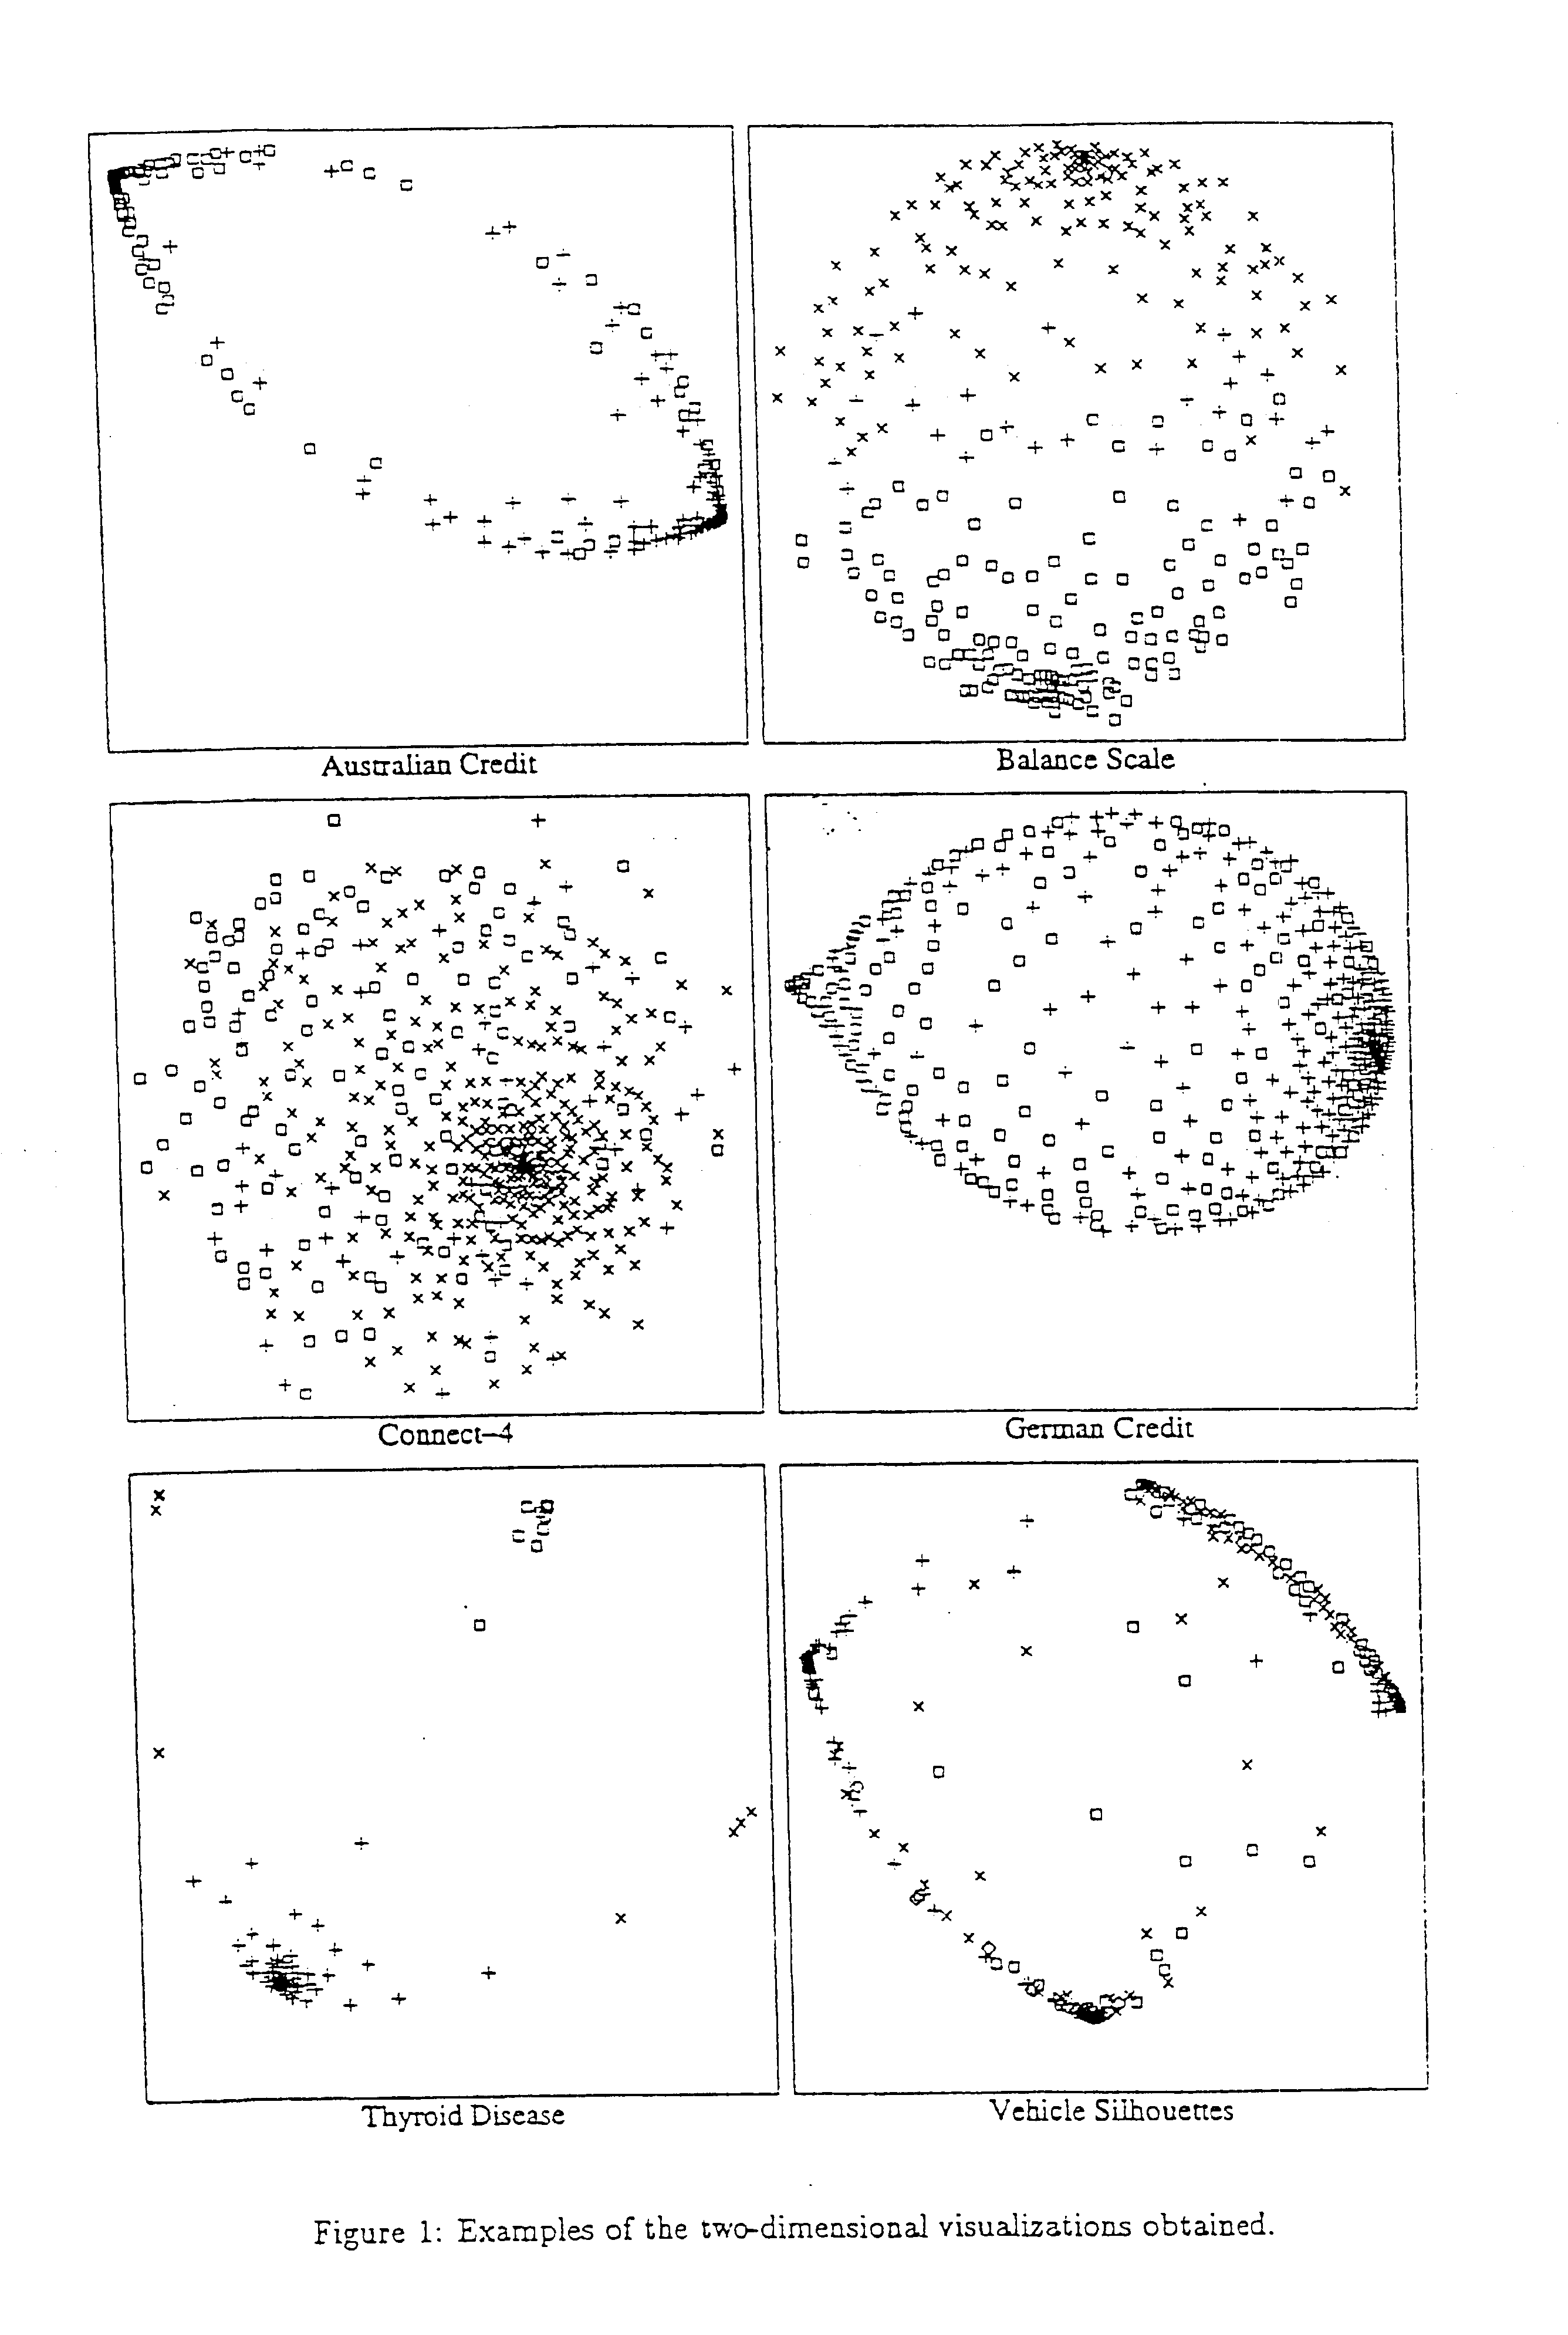
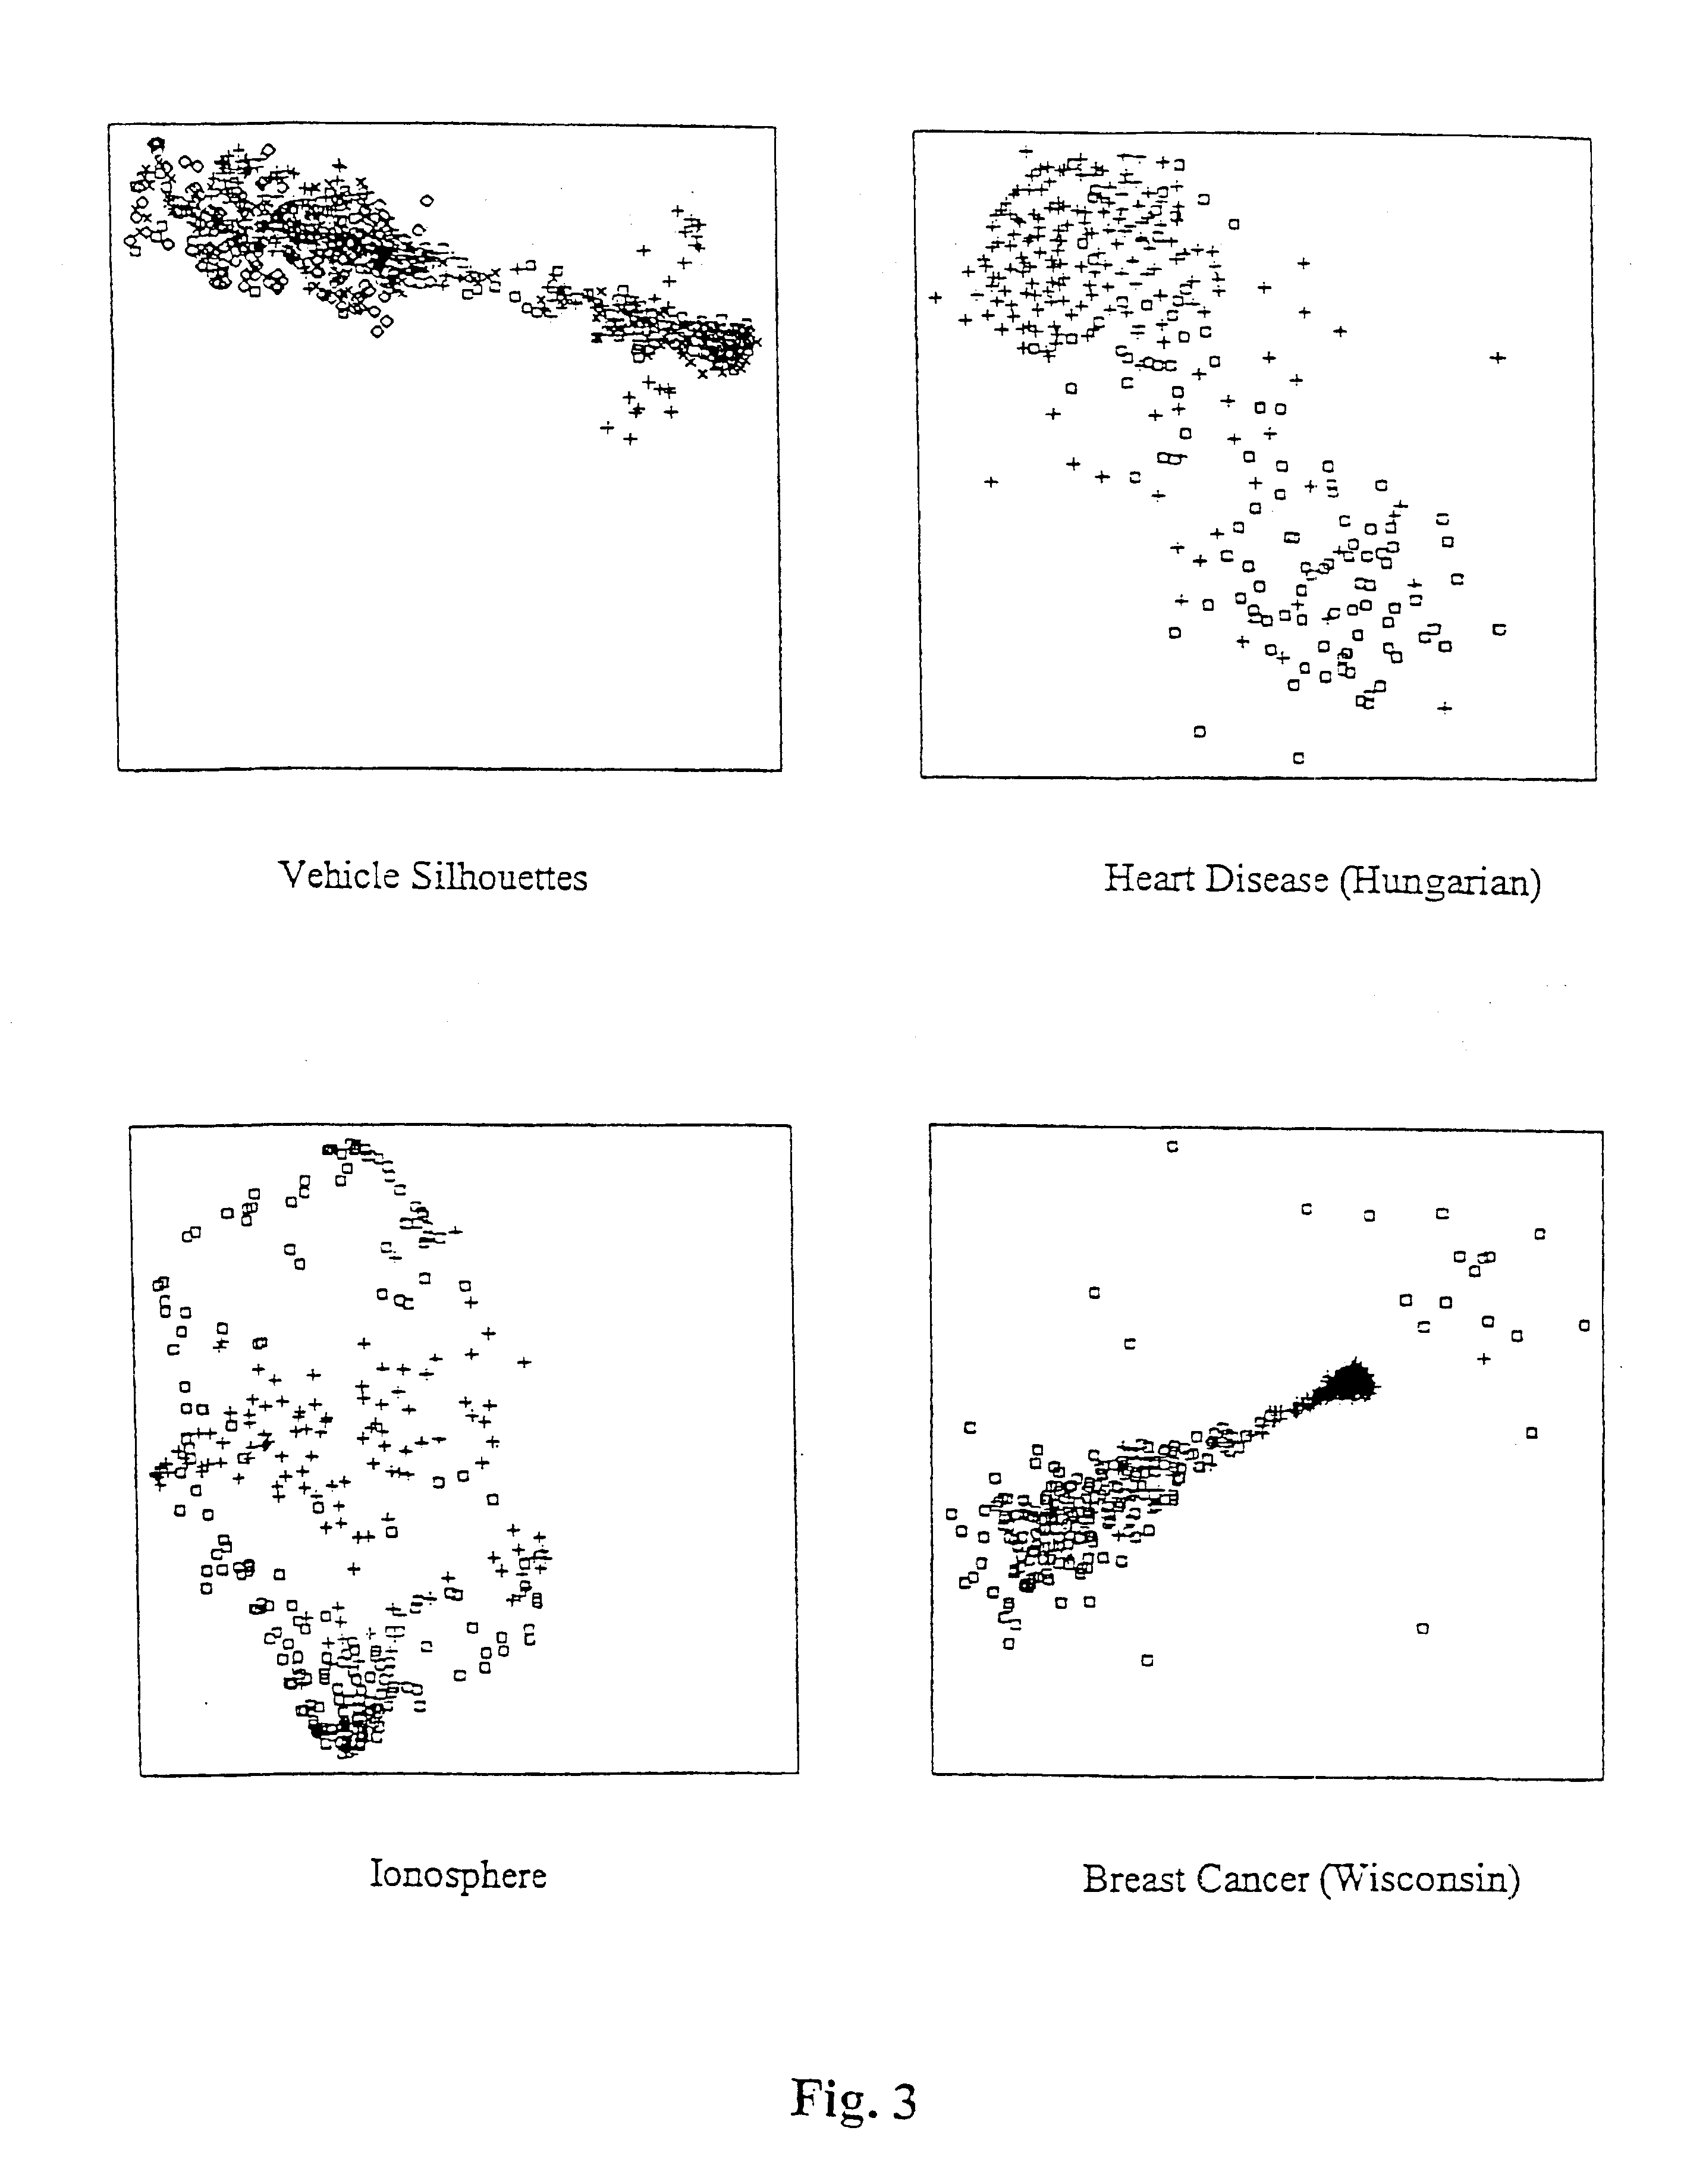
A method and system for transforming a multivariate data domain into a low-dimensional visual representation. Probabilistic models of the data domain are utilized, and at least one probabilistic model is used to produce at least one predictive distribution. The predictive distributions are used as inputs to the visualization process, where the multidimensional space is converted to a low-dimensional space. In this process data vectors are considered similar, for example, if the corresponding instances of a predictive distribution, conditioned with the variable value assignments found in the data vectors, are similar. Consequently, similarity is not defined directly using the physical properties of the data vectors, but indirectly through the probabilistic predictive model(s).

Description

TECHNICAL FIELD OF THE INVENTIONThe present invention relates to computerized system modeling, and more particularly to a method transforming a high-dimensional data domain into a low-dimensional visual representation. Specifically, the invention is directed to such a method as described in the preamble of claim 1.BACKGROUND OF THE INVENTIONComputer visualization tools are needed for presenting the results of ever increasing amounts of processed data. The conventional approach is to take some few variables at a time, process them and their relations, for example, with a spreadsheet, and display the result, for example, as bar charts and die charts. In a complex domain, where each data point may have several attributes, this conventional approach produces typically a great number of charts, with a very weak connection to each other. The charts are typically presented in as a sequence of charts. From such a sequence of charts it is usually very difficult to see and comprehend the over...

Claims


Application Information

Patent Timeline
Patent Type & Authority Patents(United States)
IPC IPC(8): G06K9/62
CPCG06K9/6232G06F18/213
Inventor KONTKANEN, PETRI TAPANILAHTINEN, JUSSI MIKA ANTEROMYLLYMAKI, PETRI JUKKASILANDER, TOMI VILJAMTIRRI, HENRY RAINERVALTONEN, KIMMO ANTERO
Owner BAYES INFORMATION TECH
Why Eureka
Try Eureka