Methods of calibrating an imaging system using calibration beads

Inactive Publication Date: 2005-06-14
AMNIS CORP
View PDF47 Cites 94 Cited by
  • Summary
  • Abstract
  • Description
  • Claims
  • Application Information

AI Technical Summary

Benefits of technology

[0012]The present invention is a method for utilizing calibration beads to enhance the performance of a flow imaging system. Related applications have described preferred flow imaging systems and prefe

Problems solved by technology

An optimal size calibration bead for a first imaging system m

Method used


Image

  • Methods of calibrating an imaging system using calibration beads
  • Methods of calibrating an imaging system using calibration beads
  • Methods of calibrating an imaging system using calibration beads

Examples


second embodiment

[0168]The velocity detector must adapt to variations in flow velocity and photodetector SNR in order to produce accurate and reliable velocity estimates. Supervisor program 142, shown in FIG. 19, is used to control the velocity detector and to coordinate the operations of the velocity detector with those of the rest of the imaging system. FIG. 24 is a flowchart showing the steps implemented by the supervisor program for the present invention. The program's three principal outputs, the SNR decision threshold, the spectrum integration limits, and the photodetector amplifier gain, are fed back to the velocity measurement system to optimize its performance.

[0169]Operation of the velocity detection system is initiated with an instrument calibration step 190, in which the noise from the photodetector channel is determined and analyzed in the absence of an optical signal. This can be accomplished by turning off the light sources in the system or stopping the flow of objects through the flo...

third embodiment

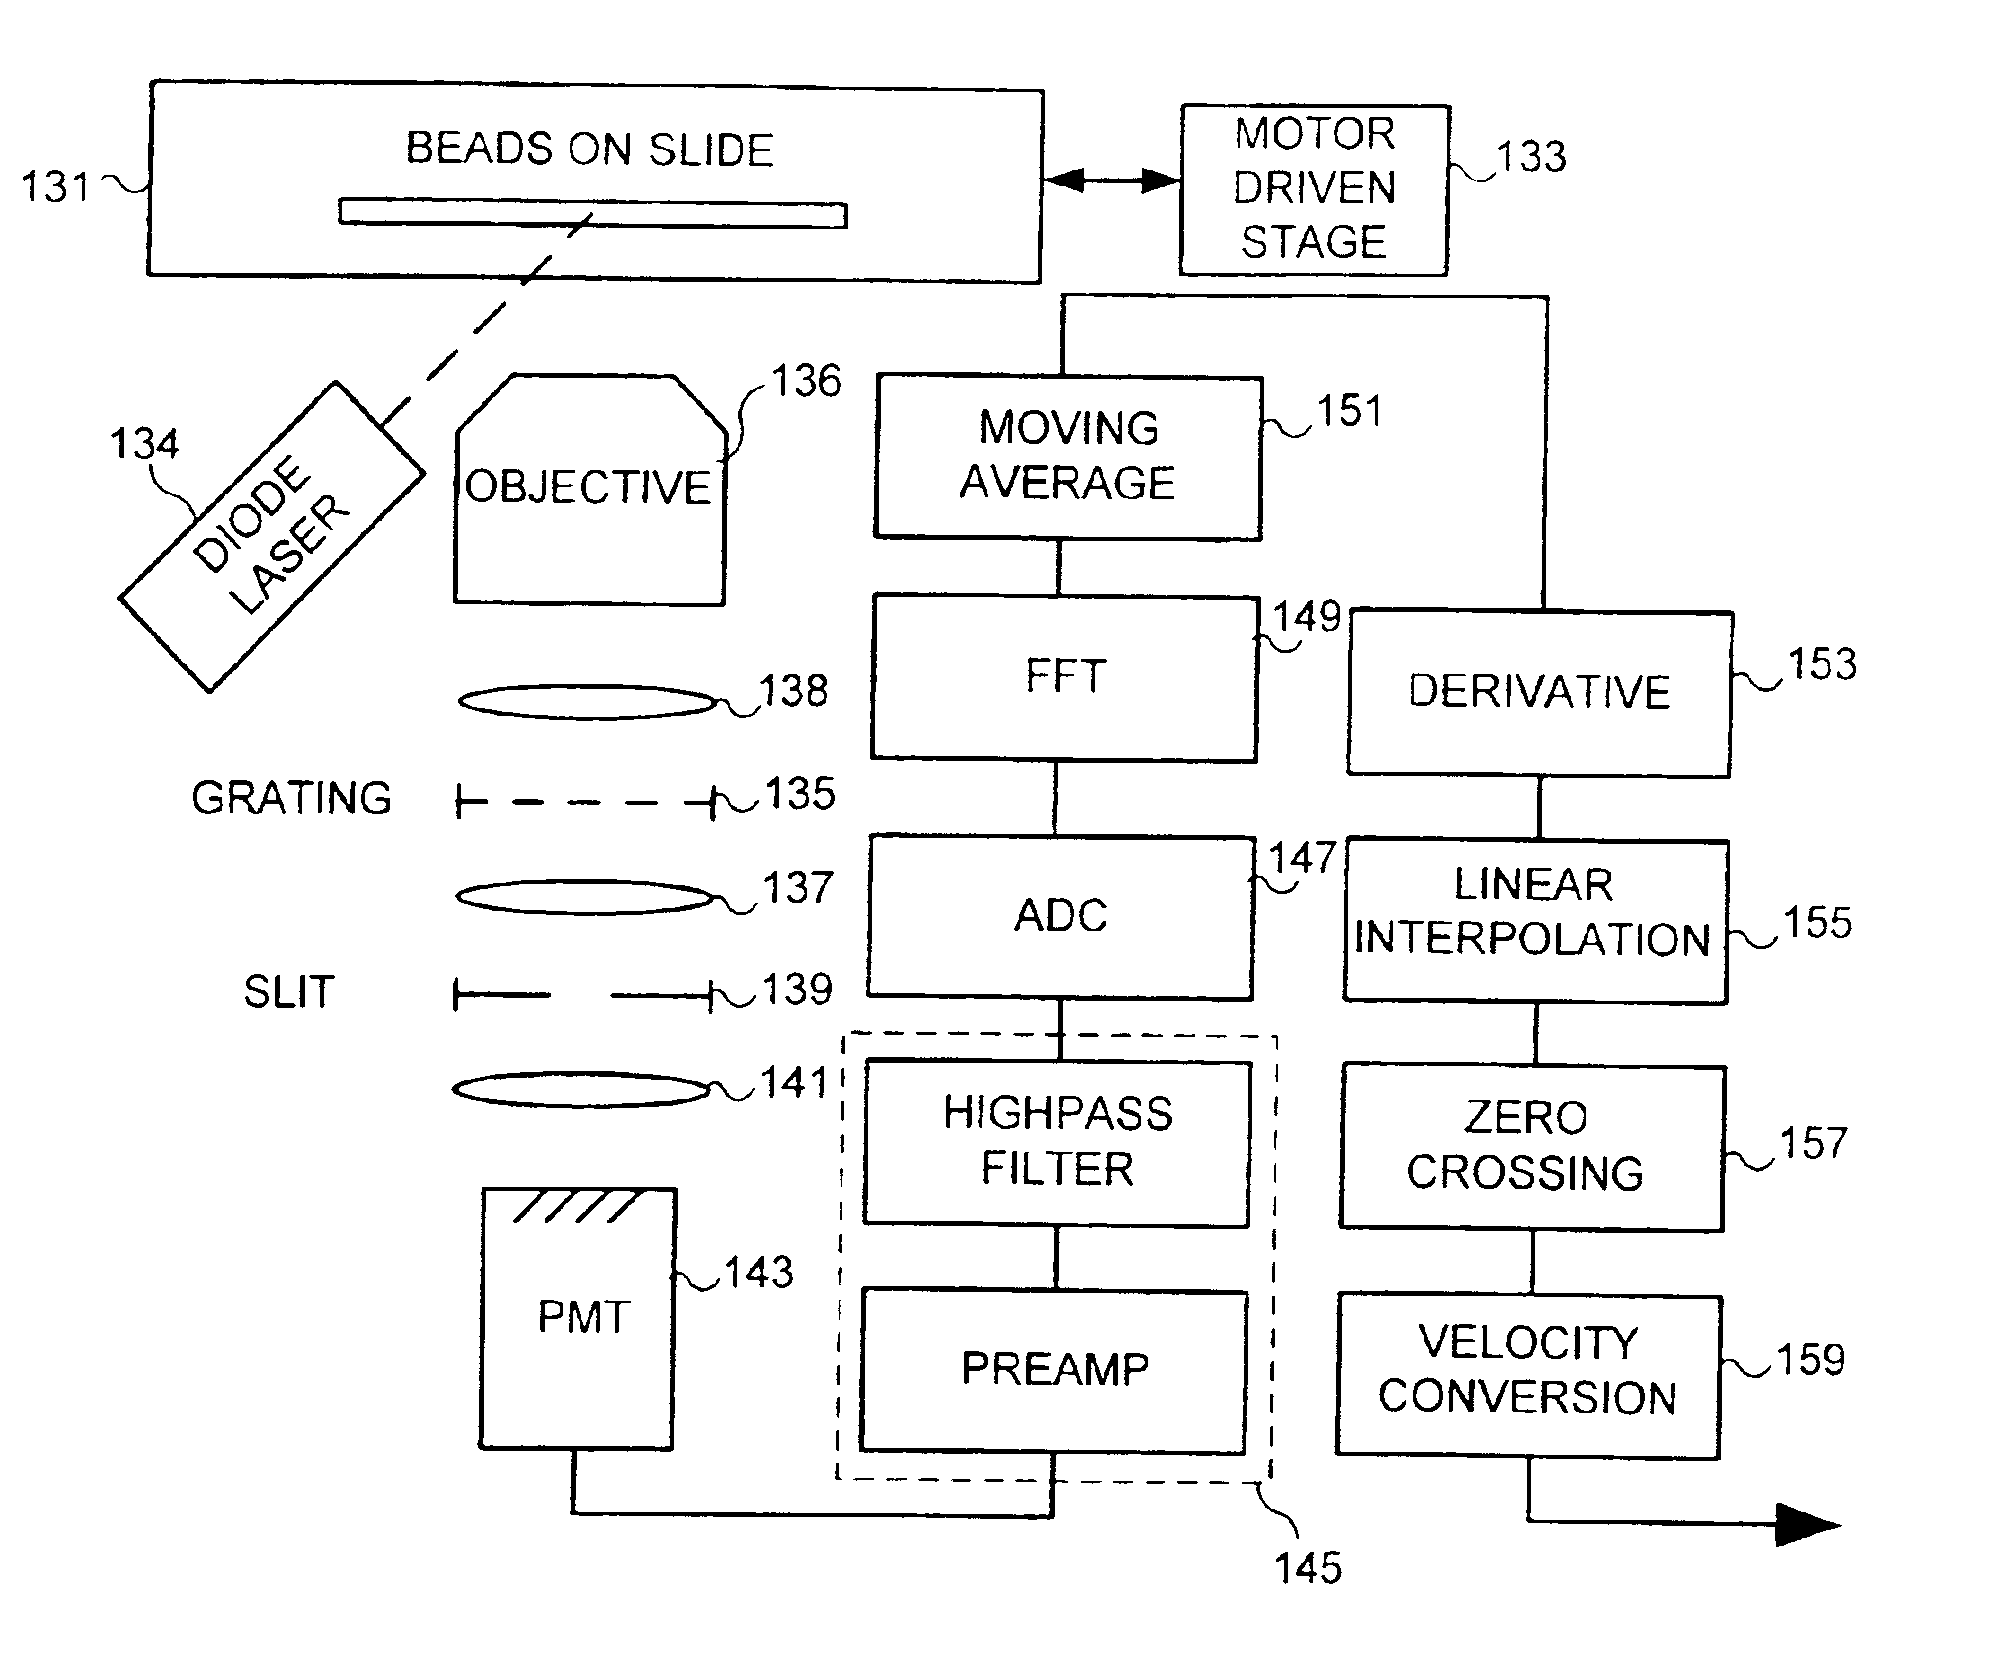
[0186]FIG. 32 shows the signal processing and data pathways for the The signal from photodetector 50 is applied to variable-gain amplifier 52, the gain of which is regulated by the supervisor program to optimize SNR. The amplified signal is applied to bandpass filter 54 to remove DC offset and to limit the signal bandwidth to prevent aliasing. The filtered signal is converted to a sequence of digital sample by ADC 56. Mixers 222 and 226 and lowpass filters 230 and 232 (FIG. 25) are implemented in the baseband conversion of a step 311. The baseband signal pair I(n), Q(n) is used for two steps. The first is the generation of the upper sideband and lower sideband signals 314 and 322 in a step 312. The second is the measurement of the velocity of objects passing through the flow cell.

[0187]FIG. 33 illustrates the generation of the upper and lower sideband signals from the I,Q signal pair. An I(n) signal 326 and a Q(n) signal 328 are each processed by the Hilbert Transform operator, app...

fourth embodiment

[0254]FIG. 50 shows the structure of the supervisor program for the present invention. System operation is initiated in a start block 510 when the gain of the variable gain amplifier is set to nominal values, and objects are introduced into the flow stream for image acquisition.

[0255]In a step 512, the supervisor program performs a cross-correlation between segments of the two photodetector signals using a wide span of correlation delays. The delay value yielding the largest peak in the correlogram is used in a step 514 to compute the initial velocity. The cross-correlation delay limits are set in a step 516 to bracket this initial delay value.

[0256]With the cross-correlation delay limits set, object velocity processing commences. During this processing, the supervisor program continuously measures the velocity using the cross correlation method and adjusts the correlation delay limits to maintain execution of a short-span cross-correlation in the neighborhood of the delay required ...


PUM


Abstract

When utilized in a flow imaging instrument, calibration beads provide a known data source that can be employed in various self-diagnostic, calibration and quality metric applications for the both the optical system of the flow imaging instrument, as well as the flow cell of the flow imaging instrument. Such data can be used to determine point spread functions associated with an imaging system, to determine a sensitivity of an imaging system, and to determine a focal point of the imaging system. Imagery collected from calibration beads can be used to determine core size and stability and TDI/flow speed synchronization. Calibration beads can be beneficially employed to enable stable system operation, even when very low sample concentration, or very small sample sizes are to be analyzed.

Description

RELATED APPLICATIONS[0001]This application is a divisional application, based on prior application Ser. No. 10 / 348,193, filed on Jan. 16, 2003 now U.S. Pat. No. 6,778,263, which in turn is a continuation in part of application Ser. No. 09 / 939,292, filed on Aug. 24, 2001 now U.S. Pat. No. 6,532,061, which itself is based on a prior copending provisional application Ser. No. 60 / 228,076, filed on Aug. 25, 2000, the benefits of the filing dates of which are hereby claimed under 35 U.S.C. § 119(e) and 35 U.S.C. § 120.FIELD OF THE INVENTION[0002]The present invention generally relates to a method for using calibration beads to enhance the performance of a flow imaging system, and more specifically, to using calibration beads to facilitate the reliable collection of velocity data used by the flow imaging system.BACKGROUND OF THE INVENTION[0003]Cells and cell groupings are three-dimensional objects containing rich spatial information. The distribution of a tremendous variety of bio-molecule...

Claims


Application Information

Patent Timeline
IPC IPC(8): G01N15/14G02B27/00G06T7/20G01N15/10
CPCG01N15/1012G06T7/20G02B27/0012G01N15/1463G01N15/147G01N15/1475G01N2015/1018G01N2015/1025G01N2015/1075G01N2015/144G01N2015/1443G01N2015/1447G01N2015/1452G01N2015/1465G01N2015/1472G01N2015/1477G01N2015/1497G01N15/1459
Inventor ORTYN, WILLIAM E.BASIJI, DAVID A.FROST, KEITH L.HALL, BRIAN E.SEO, MICHAEL J.
Owner AMNIS CORP
Why Eureka
Try Eureka