Process for manufacturing pigment dispersions

Inactive Publication Date: 2005-07-12
EI DU PONT DE NEMOURS & CO
View PDF20 Cites 29 Cited by
  • Summary
  • Abstract
  • Description
  • Claims
  • Application Information

AI Technical Summary

Benefits of technology

[0009]The invention provides an improved process for making a pigmented dispersion that matches a standard liquid dispersion. The process utilizes a novel wet measurement technique which measures the spectral transmittance of the wet dispersion over the visible spectrum and determines therefrom the tinting strength of the dispersion and whether additional grinding is needed to bring the dispersion within an ac

Problems solved by technology

One difficulty, however, is that commonly used indicators of particle size, such as gloss, Hegman Gage or conventional particle size measurement, are either indirect, inaccurate or time consuming.
In addition, there are no convenient methods to test tinting strength and color of neat dispersions during the milling or grinding process.
Traditional strength testing is cumbersome and very time-consuming and the accuracy of the test is also dependent on the color and strength stability of the standard white or black paints.
Even with careful control, these standards can vary from batch to batch and tend to flocculate or settle in time, leading to poor test repeatability and difficulty in accurately matching the disper

Method used


Image

  • Process for manufacturing pigment dispersions
  • Process for manufacturing pigment dispersions

Examples


example 1

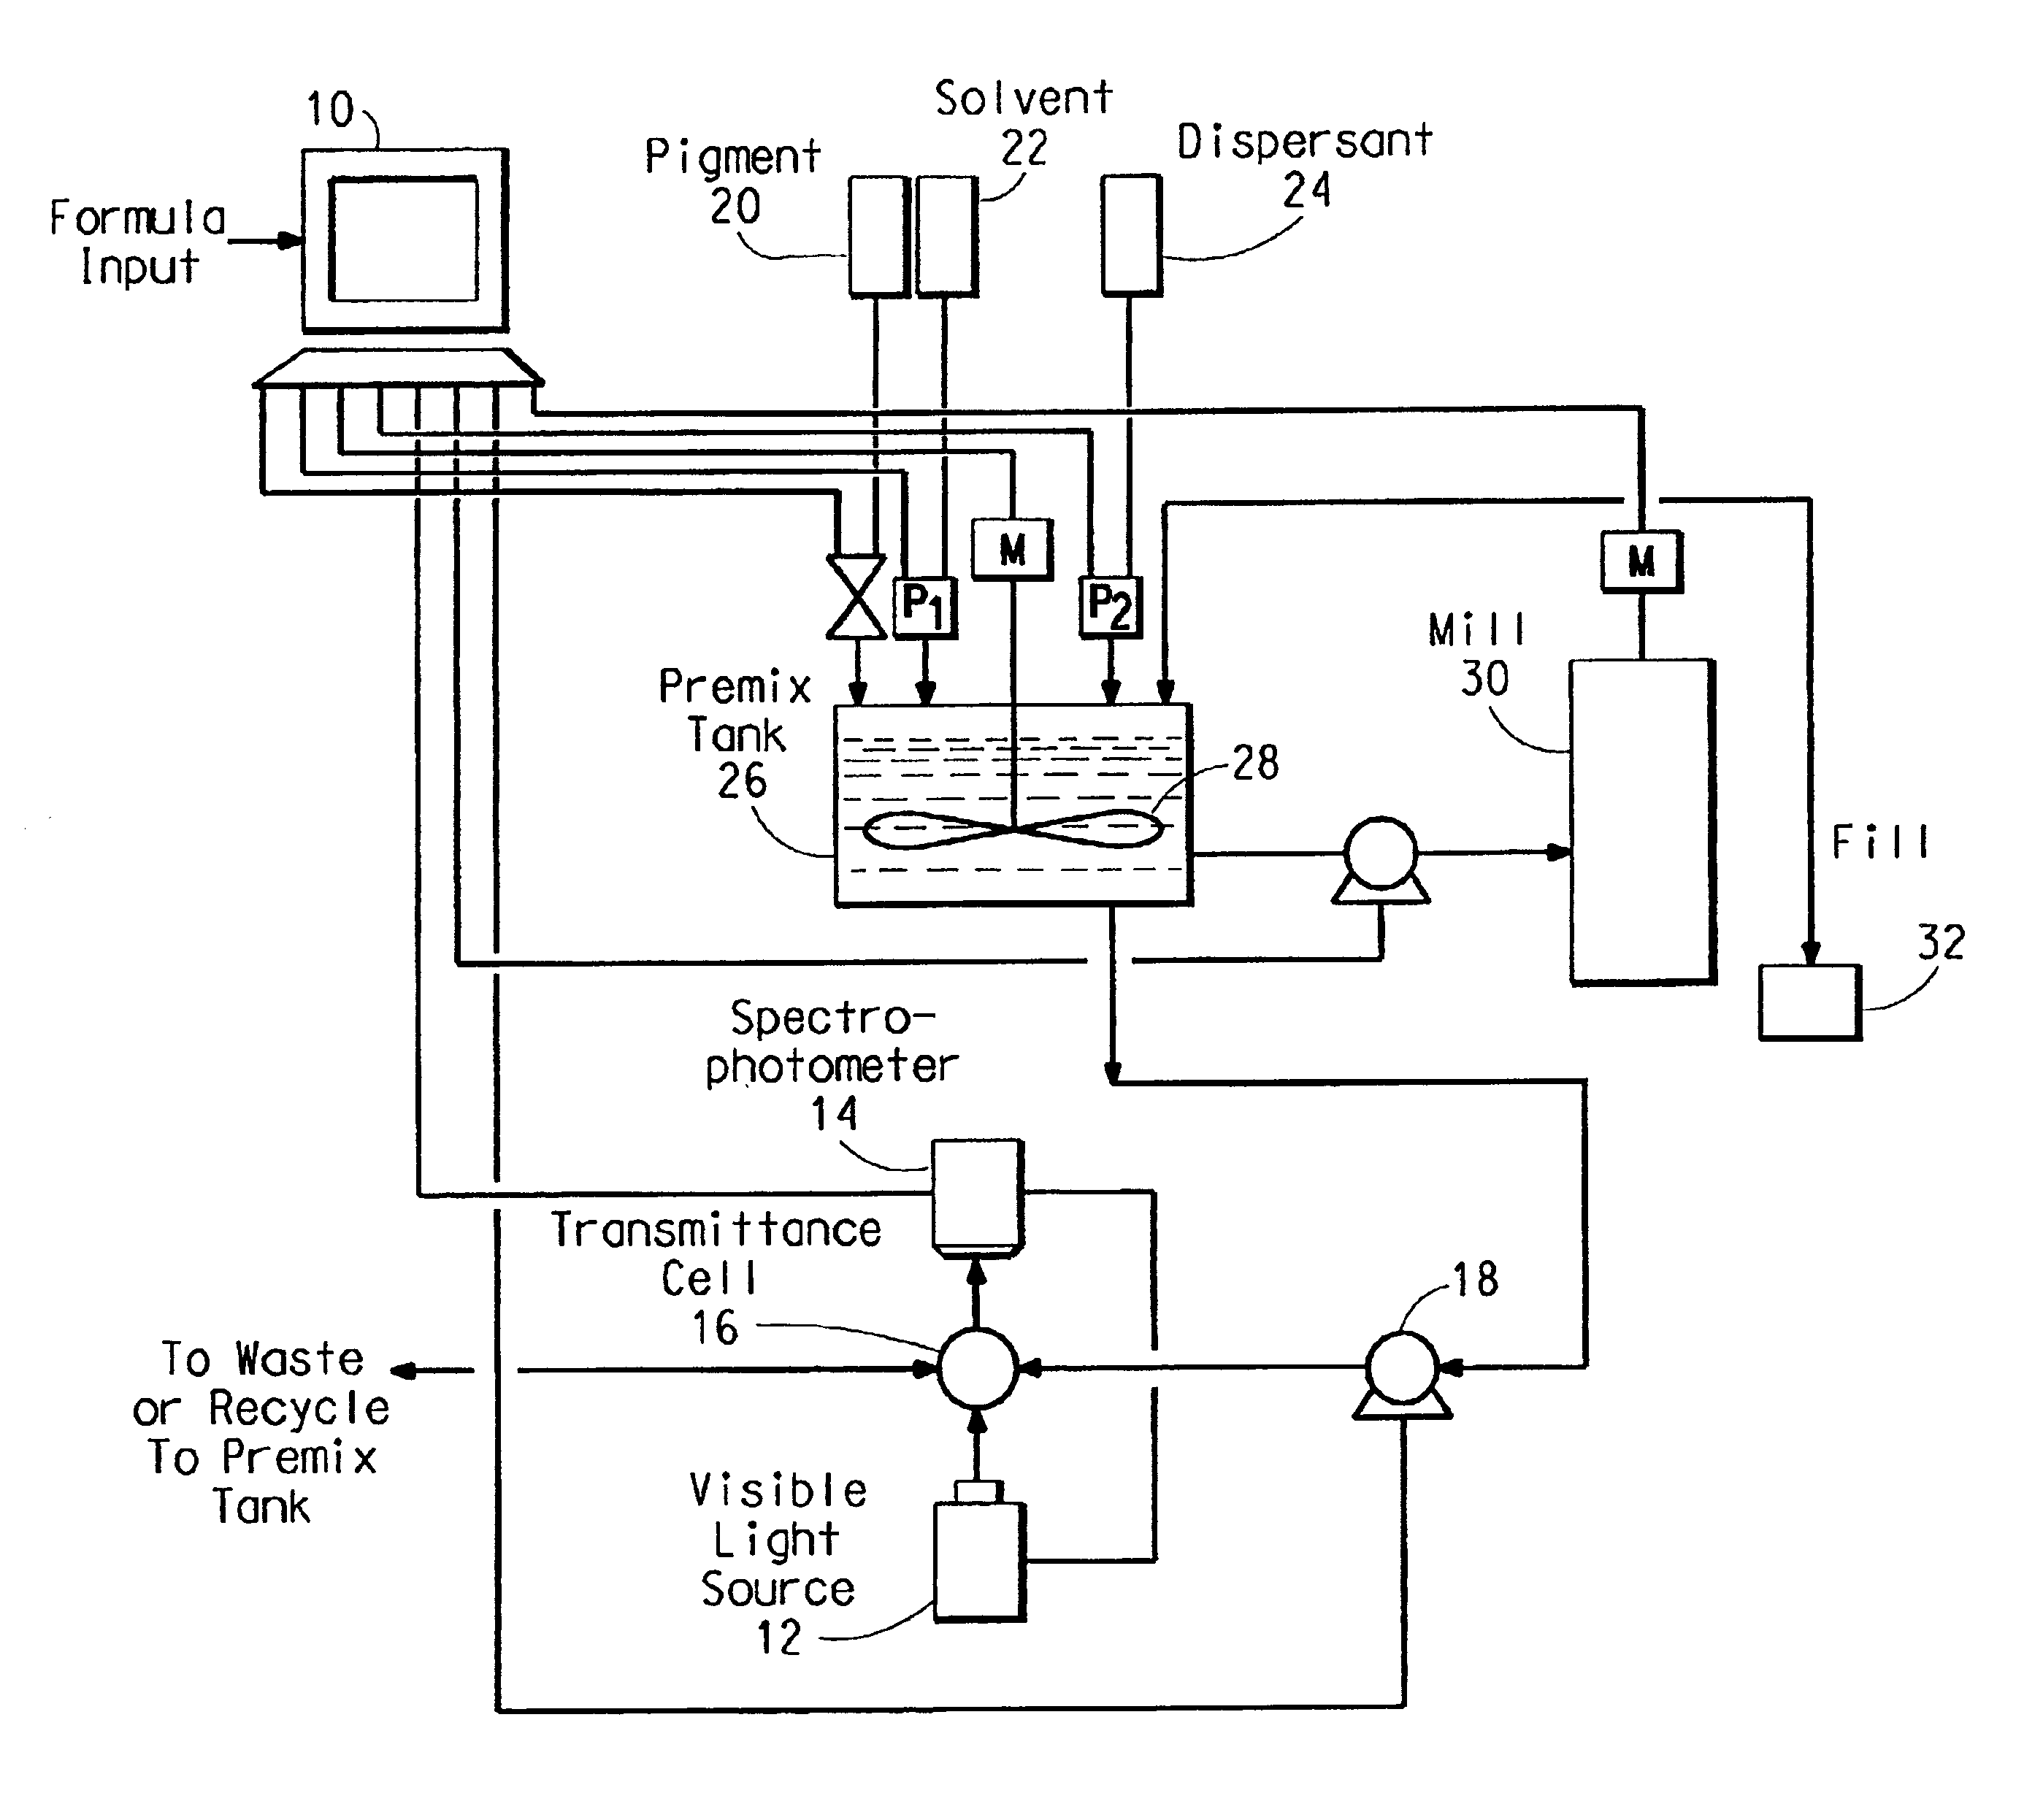
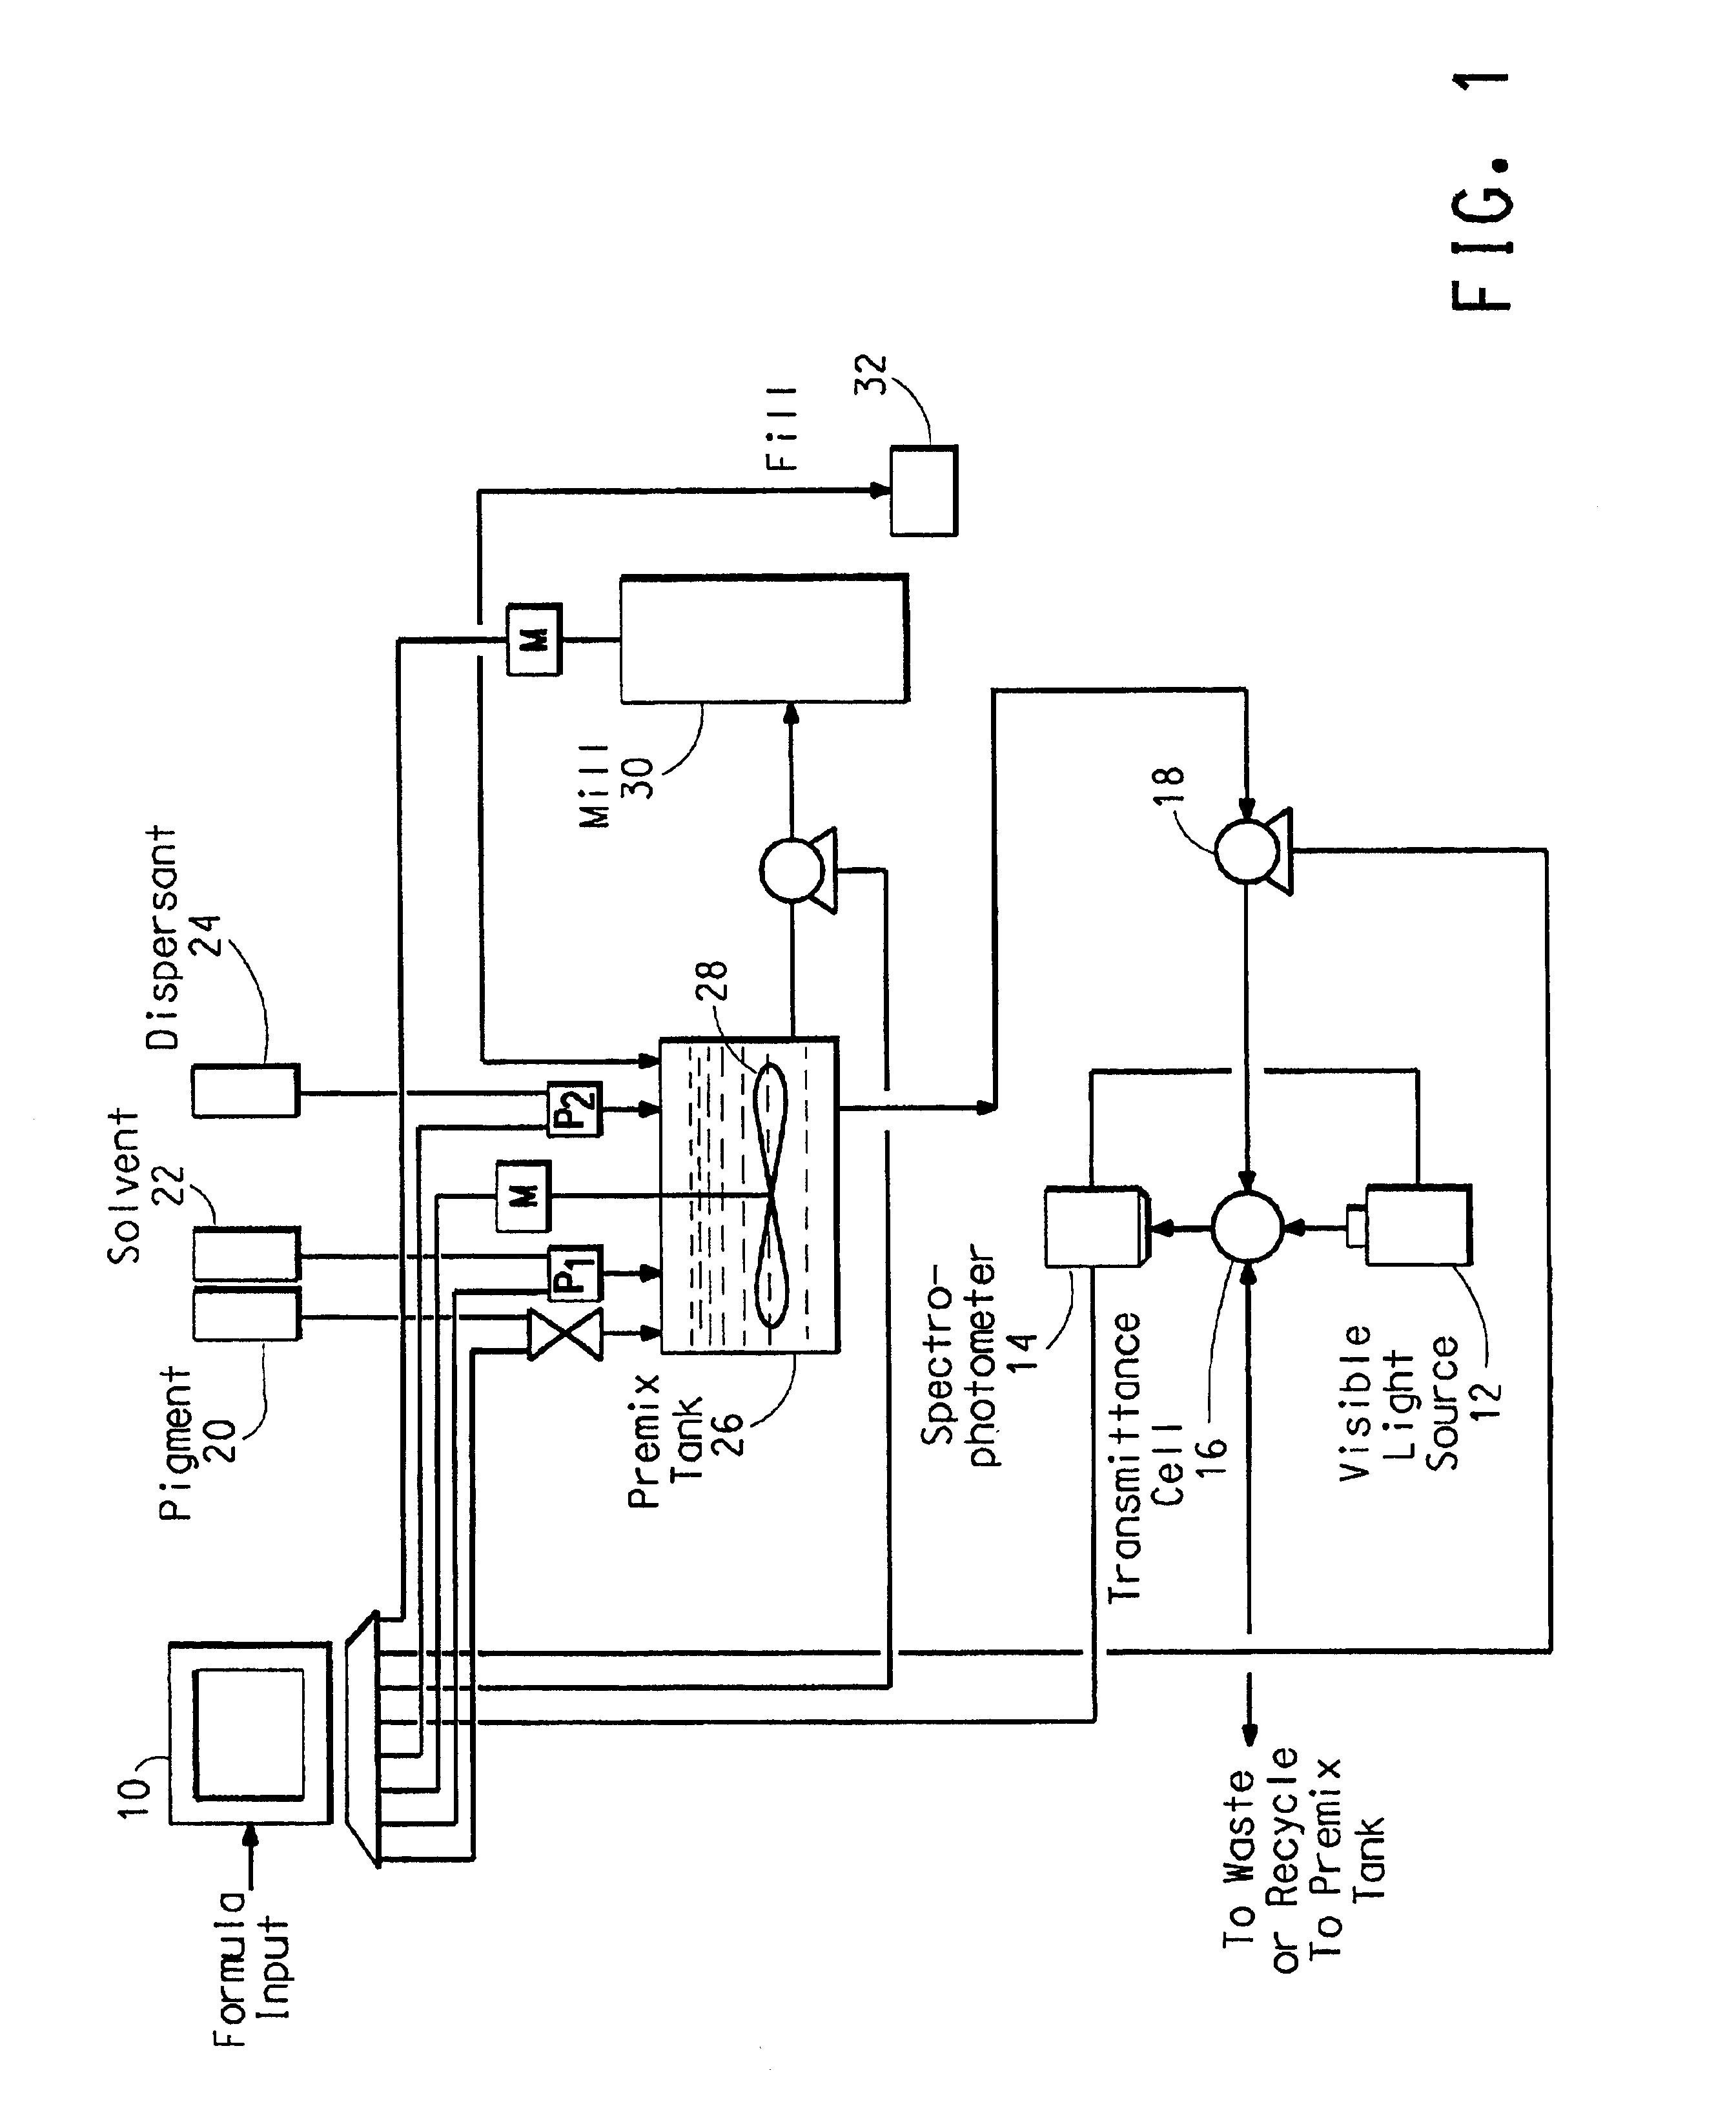
[0053]The process described above was operated in off-line mode to characterize a single-pigment green dispersion. The dispersion was produced by grinding a mixture of green pigment, polymeric dispersant and solvent in a sand mill in a pass-to-pass operation. The batch was purposely ground for extra passes to provide samples on either side of the standard dispersion. Batch samples were taken after the 2nd, 3rd, 4th and 5th passes and tested for particle size.

[0054]In the dry test, dry drawdowns of the neat samples were used for transparency comparisons to the standard dispersions. In the wet test, the ratios of optical density (O.D.) at 530 nm and 560 nm were measured on neat liquid dispersions samples. 530 nm was chosen because it was the wavelength of peak transmittance, while 560 nm, although not the point of maximum absorbance, was selected because it provided an accurate high absorbance data point. For the wet transmittance measurements, optical pathlength was set at 38 microns...

example 2

[0058]The dispersion samples from Example 1 above were tested for tinting strength, using dry and wet techniques. Dry results were gathered using the traditional method of mixing the dispersion with a white paint, spraying onto panels, baking the panels and measuring the lightness values (L*) of the dry panels versus a standard. Wet optical density measurements were taken as described in Example 1.

[0059]

WetDry ΔL*O.D.(530 nm) / O.D.(560 nm) Standard Dispersion  0.000.5162nd Pass  0.300.5433rd Pass−0.160.4884th Pass−0.160.4765th Pass−0.280.472

[0060]The wet O.D. ratios corresponded well to the dry tinting strength measurements, indicating the effectiveness of the wet method in predicting strength. The wet measurements also showed the expected increase in strength between the 3rd and 4th passes, while the dry test did not. When compared to the standard dispersion, the wet measurements would have indicated that strength was sufficiently developed after the 3rd pass.

example 3

[0061]The dispersion samples from Example 1 above were diluted with a clear binder / solvent blend at a ratio of 33 grams of clear per 100 grams of dispersion. The diluted samples were then measured in wet transmittance as described above and the optical density ratios calculated at the selected wavelengths of 530 nm and 560 nm. In addition, optical densities of the neat samples were compared to those of the diluted samples at peak transmittance to determine whether Beer's law held over this concentration range.

[0062]The wet optical density ratios were measured as follows:

[0063]

DiluteNeatO.D.(530 nm) / O.D.(530 nm) / Neat / DiluteO.D.(560 nm)O.D.(560 nm)O.D. @ 530 nm 2nd Pass 0.5430.5431.343rd Pass0.4920.4881.344th Pass0.4800.4761.335th Pass0.4700.4721.33

[0064]The data show that, within measurement error, the O.D. ratios indicating particle size do not change over a significant concentration range, and that O.D. at peak transmittance provides an accurate measure of relative concentration. ...


PUM

PropertyMeasurementUnit
Nanoscale particle sizeaaaaaaaaaa

Abstract

An improved process for making pigment dispersions containing a single pigment that match the tinting strength of a standard dispersion. The process employs a faster and more accurate wet measurement technique for analyzing and matching the dispersions to a standard that utilizes the spectral transmittance of the wet dispersions over the visible spectrum.

Description

CROSS-REFERENCE TO RELATED APPLICATION[0001]This application claims priority under 35 U.S.C. §119 from U.S. Provisional Application Ser. No. 60 / 227,007 (filed Aug. 23, 2000), which is incorporated by reference herein for all purposes as if fully set forth.BACKGROUND OF THE INVENTION[0002]The invention relates to an improved process for making pigment dispersions that match a standard dispersion, using the spectral transmittance properties of the dispersions in the wet to rapidly analyze the dispersions as they are being made and bring them within an acceptable match to the standard.[0003]Single pigment dispersions or mill bases are widely used nowadays in formulating pigmented finishes, such as exterior paints for automobiles and trucks. Such dispersions are typically prepared in a milling or grinding process where the solid pigment particles are ground in the presence of solvent and polymer dispersant until a stable particle dispersion with the desired degree of fineness is formed....

Claims


Application Information

Patent Timeline
IPC IPC(8): C09B67/00C09D11/00C09B67/46C09D7/00C09B67/20C09C3/00
CPCC09B67/0066C09B67/0069C09B67/0084C09B67/0091C09C3/00C09D7/00C09D11/30C01P2002/84C01P2004/51C01P2004/60C01P2006/60C01P2006/62C01P2006/63C01P2006/64C01P2006/66
Inventor RODRIGUES, ALLAN BLASE JOSEPHSCHERMACHER, KEN STEPHENMARTINO, ANTHONY JOSEPHSPAHR, DOUGLAS E.
Owner EI DU PONT DE NEMOURS & CO
Why Eureka
Try Eureka