Method for correlating and presenting network management data

a network management and data technology, applied in the field of network management, can solve the problems of increasing the difficulty of monitoring performance and pinpointing problems, the ineffective presentation of data presented to is managers, and the attention given to the initial capital cost of pcs, so as to achieve convenient implementation

Inactive Publication Date: 2006-11-28
VALTRUS INNOVATIONS LTD
View PDF6 Cites 72 Cited by
  • Summary
  • Abstract
  • Description
  • Claims
  • Application Information

AI Technical Summary

Benefits of technology

[0055]The present inventors have realized that the need for more detailed network monitoring may be accomplished via monitoring sources of network traffic. The present invention gathers data describing the network traffic using RMON standard and RMON extension MIBs and correlates the data to determine useful statistics about the traffic (application originating the traffic, protocols utilized, etc.), and provide a useful display of the traffic and protocols.
[0056]The present inventors have also realized that an effective method for presenting Network management data is via a split window display. The split window display includes two windows, each with scrolling capability, selection buttons for varying a view presented in the windows, and a search utility to pinpoint user specified data instances in the network management data. The split window display presents high level network data in a first window using an expandable / collapsible tree format. Detailed information regarding a selected portion of the high level data is displayed in a second window. Various views of the network data can be shown via the selection buttons, and include an Application Protocols, Network Protocol, Hosts, Matrix, and Applications views.
[0057]The present invention may be embodied as a method of presenting network data, comprising the steps of, retrieving network data, and displaying the network data in a split window display. The step of displaying may include the steps of, displaying high level portions of the network data in a selectable format in a first window of said split window display, and displaying details of a high level portion of network data selected in said first window in a second window of said split window display.
[0058]The present invention may be conveniently implemented on a general purpose computer, or networked computers, and the results may be displayed on an output device connected to any of the general purpose, networked computers, or transmitted to a remote device for output or display.

Problems solved by technology

While the initial capital cost of PCs gets a lot of attention, the greatest chunk of technology budgets goes to maintaining and managing users' connections.
Consequently, it is growing more difficult to monitor performance and pinpoint problems.
This business-critical and, in the case of voice and video, delay-sensitive traffic needs to move through the network unobstructed by lower-priority activities such as e-mail or Internet browsing.
However, because of display complexities, and lack of available tools, the data presented to IS managers is not presented as effectively as is preferred to allow quick and easy access to the data needed for making proper network management decisions.
Prior art SNMP installations largely were not placed in ESs because SNMP did not handle ES management or monitoring functions and because SNMP agents are processor and memory intensive.
However, its power and platform-independent design makes it computationally intensive to implement, and for that reason it has limited applications in end system management or monitoring.
While the SNMP protocol is simple, the MIB definitions can be difficult to implement because MIB ids use complex data structures which create cross-platform complexities.
Even if installed in an ES, an SNMP agent cannot be used to manage or diagnose an ES or update system components where the UDP protocol stack is not working properly, which will often be the case when the network connection is failing.
A traditional stand-alone RMON probe, connected to a switch like any other host device, only sees network traffic flowing on the segments to which it is connected, greatly limiting its usefulness in modern, more complicated network topologies.
However, this requires considerable processing capability in order to handle the large bandwidth made possible by modern switching architectures.
However, where multiple network interfaces must be monitored or where network bandwidths are higher, (such as with 100Base-T LANs or switching hubs / ATM), it is considerably more costly to build a probe with sufficient processing power to capture all, or even most, of the network packets being exchanged.
Independent laboratory tests show that RMON products claiming to keep up with higher bandwidth network traffic generally cannot, in fact, keep up with all data flow during peak network rates.
The situation worsens considerably when attempting to do RMON2 analysis of network packets in high bandwidth environments.
Use of filtering switches and hubs (discussed in the above referenced patent applications) in networks further limits the usefulness of probes because, unlike repeaters, not all the packets appear at every output port of the switch.
This makes the use of external stand-alone probes infeasible unless the switch vendor has provided a monitor port (sometimes called a copy port) where all packets are repeated to the external RMON probe.
However, this approach decreases data traffic performance in the switch, and does nothing to reduce the processing overhead required of the probe.
In general, the RMON and RMON2 standards fail to provide all the information needed by IS managers for efficient network management.

Method used


Image

  • Method for correlating and presenting network management data
  • Method for correlating and presenting network management data
  • Method for correlating and presenting network management data

Examples


Embodiment Construction

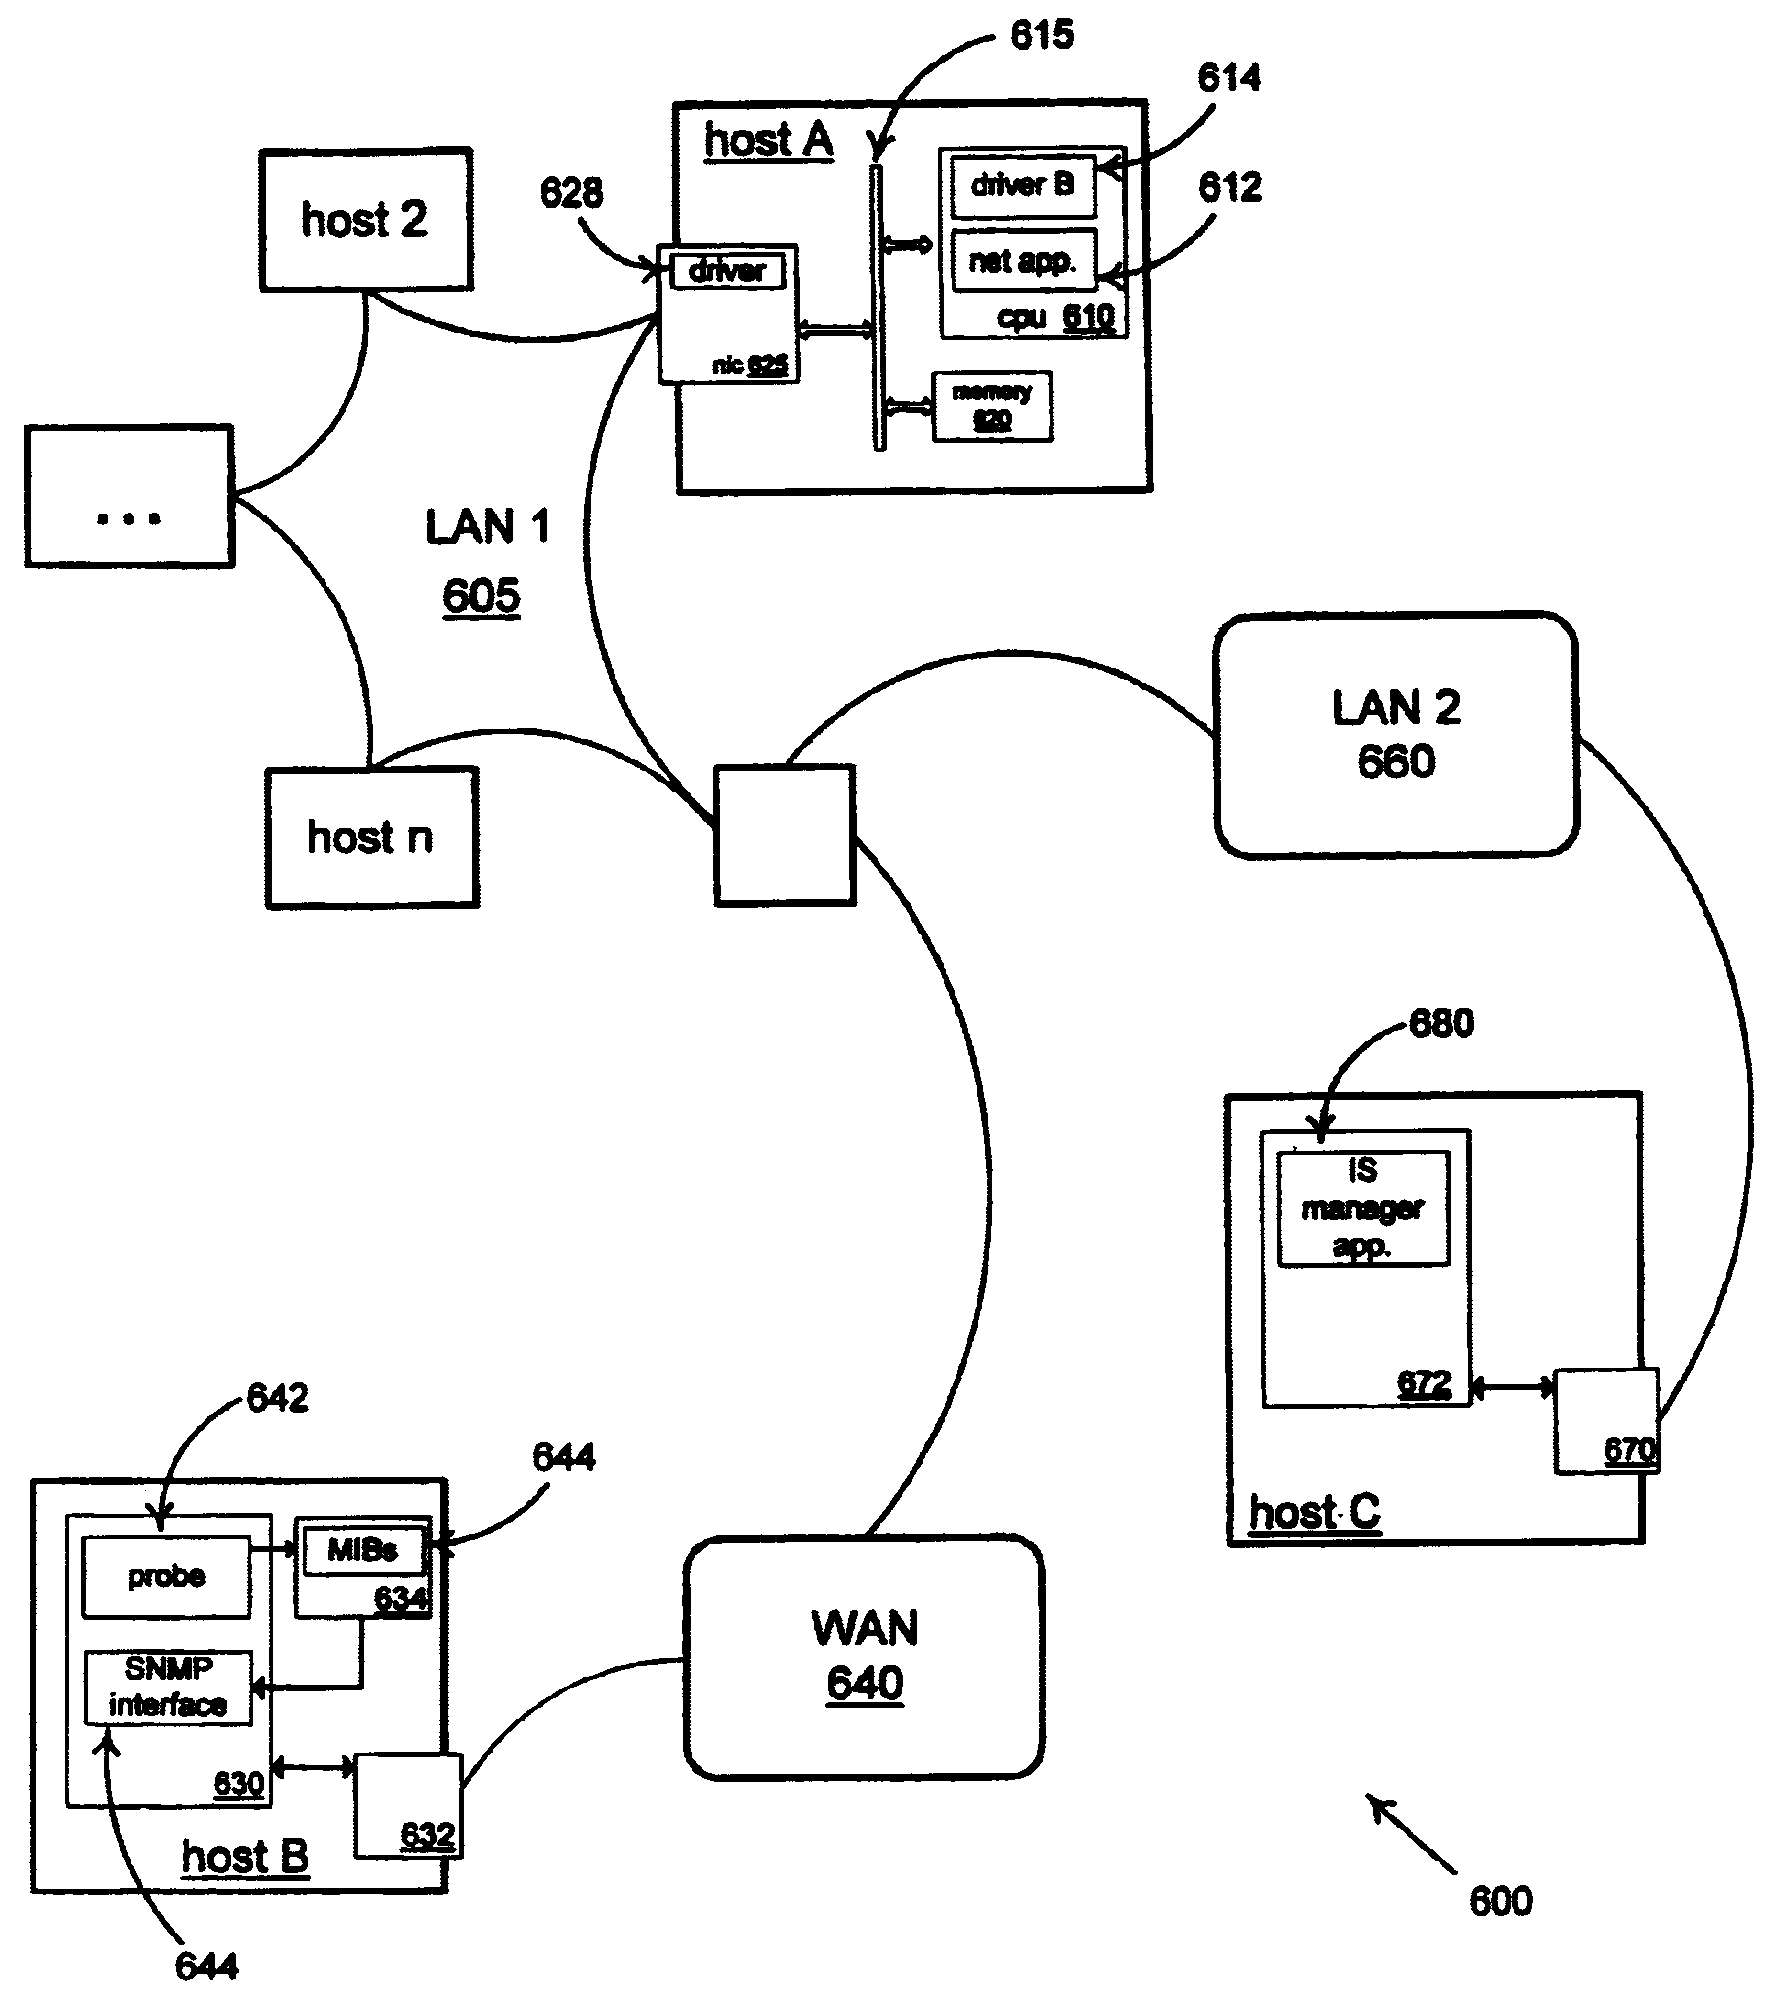
[0073]The RMON standard provides the capability for extension MIBs (Management Information Base—a structured collection of managed objects. A standard for correlating data collected from network traffic). MIB data retrieved from the network traffic is stored in one of an RMON standard MIB or an extension MIB. An LAN agent or driver working in conjunction with a Network Interface Console (NIC) retrieves the data from the network traffic and builds the MIB.

[0074]Referring again to the drawings, wherein like reference numerals designate identical or corresponding parts, and more particularly to FIG. 3 thereof, there is illustrated a block diagram of selected components and communications of a host device 300. The host device 300 includes a Central Processing Unit (CPU) 310, a system bus 320, and a Network Interface Console (NIC or Network Card) 330. The NIC 330 receives packets (TCP / IP packets, for example) off bus 320, placing them on the network 335. The NIC 330 receives packets from...


PUM


Abstract

NIC collected network statistics are captured by agent devices resident on Host machines of a network. A probe (software or hardware) retrieves the collected statistics from one or more monitored hosts (each host on the network, for example) and places them in RMON MIB and RMON extension MIB formats. The MIB data is retrieved by queries from a data correlation device that then correlates the queried data into useful statistics regarding network traffic. The useful statistics include network traffic in bytes per second for each application, application protocol, hosts, user logon id, etc. for each of the monitored hosts. Different views including a host to host matrix view are provided in a split window display.

Description

BACKGROUND OF THE INVENTION[0001]1. Field of Invention[0002]This invention relates generally to network management. The invention is more specifically related to a presenting data about network operations and performance in a network administrator friendly format.[0003]2. Discussion of Background[0004]Networks have become important, strategic foundations for competing in a global economy. And every day, more users and more business activities step into the network realm. Users are demanding that access to the network be delivered with the same simplicity, reliability, quality, and flexibility associated with picking up a phone and calling anywhere in the world.[0005]In this network-centric environment, the behind-the-scenes designers and operators of networks face three concurrent challenges:[0006]Networks are growing larger and more dispersed. With each new user comes another PC, many of them notebooks and a growing number are scattered to remote locations, users' home offices, or ...

Claims


Application Information

Patent Timeline
Patent Type & Authority Patents(United States)
IPC IPC(8): G06F15/173
CPCH04L41/0213H04L41/0253H04L41/046H04L41/22H04L43/045
Inventor GRACE, JENNIFER LYNNVERED, RONANTABLIAN, AREVIG
Owner VALTRUS INNOVATIONS LTD
Why Eureka
Try Eureka