
Method and apparatus for multivariable analysis of biological measurements

a multivariable, experimental data technology, applied in the direction of biological models, instruments, computing models, etc., can solve the problems of affecting the effect (upstream-downstream), and affecting the quality of biological measurements

Inactive Publication Date: 2007-05-29
YEDA RES & DEV CO LTD
View PDF4 Cites 2 Cited by
  • Summary
  • Abstract
  • Description
  • Claims
  • Application Information

AI Technical Summary

Benefits of technology

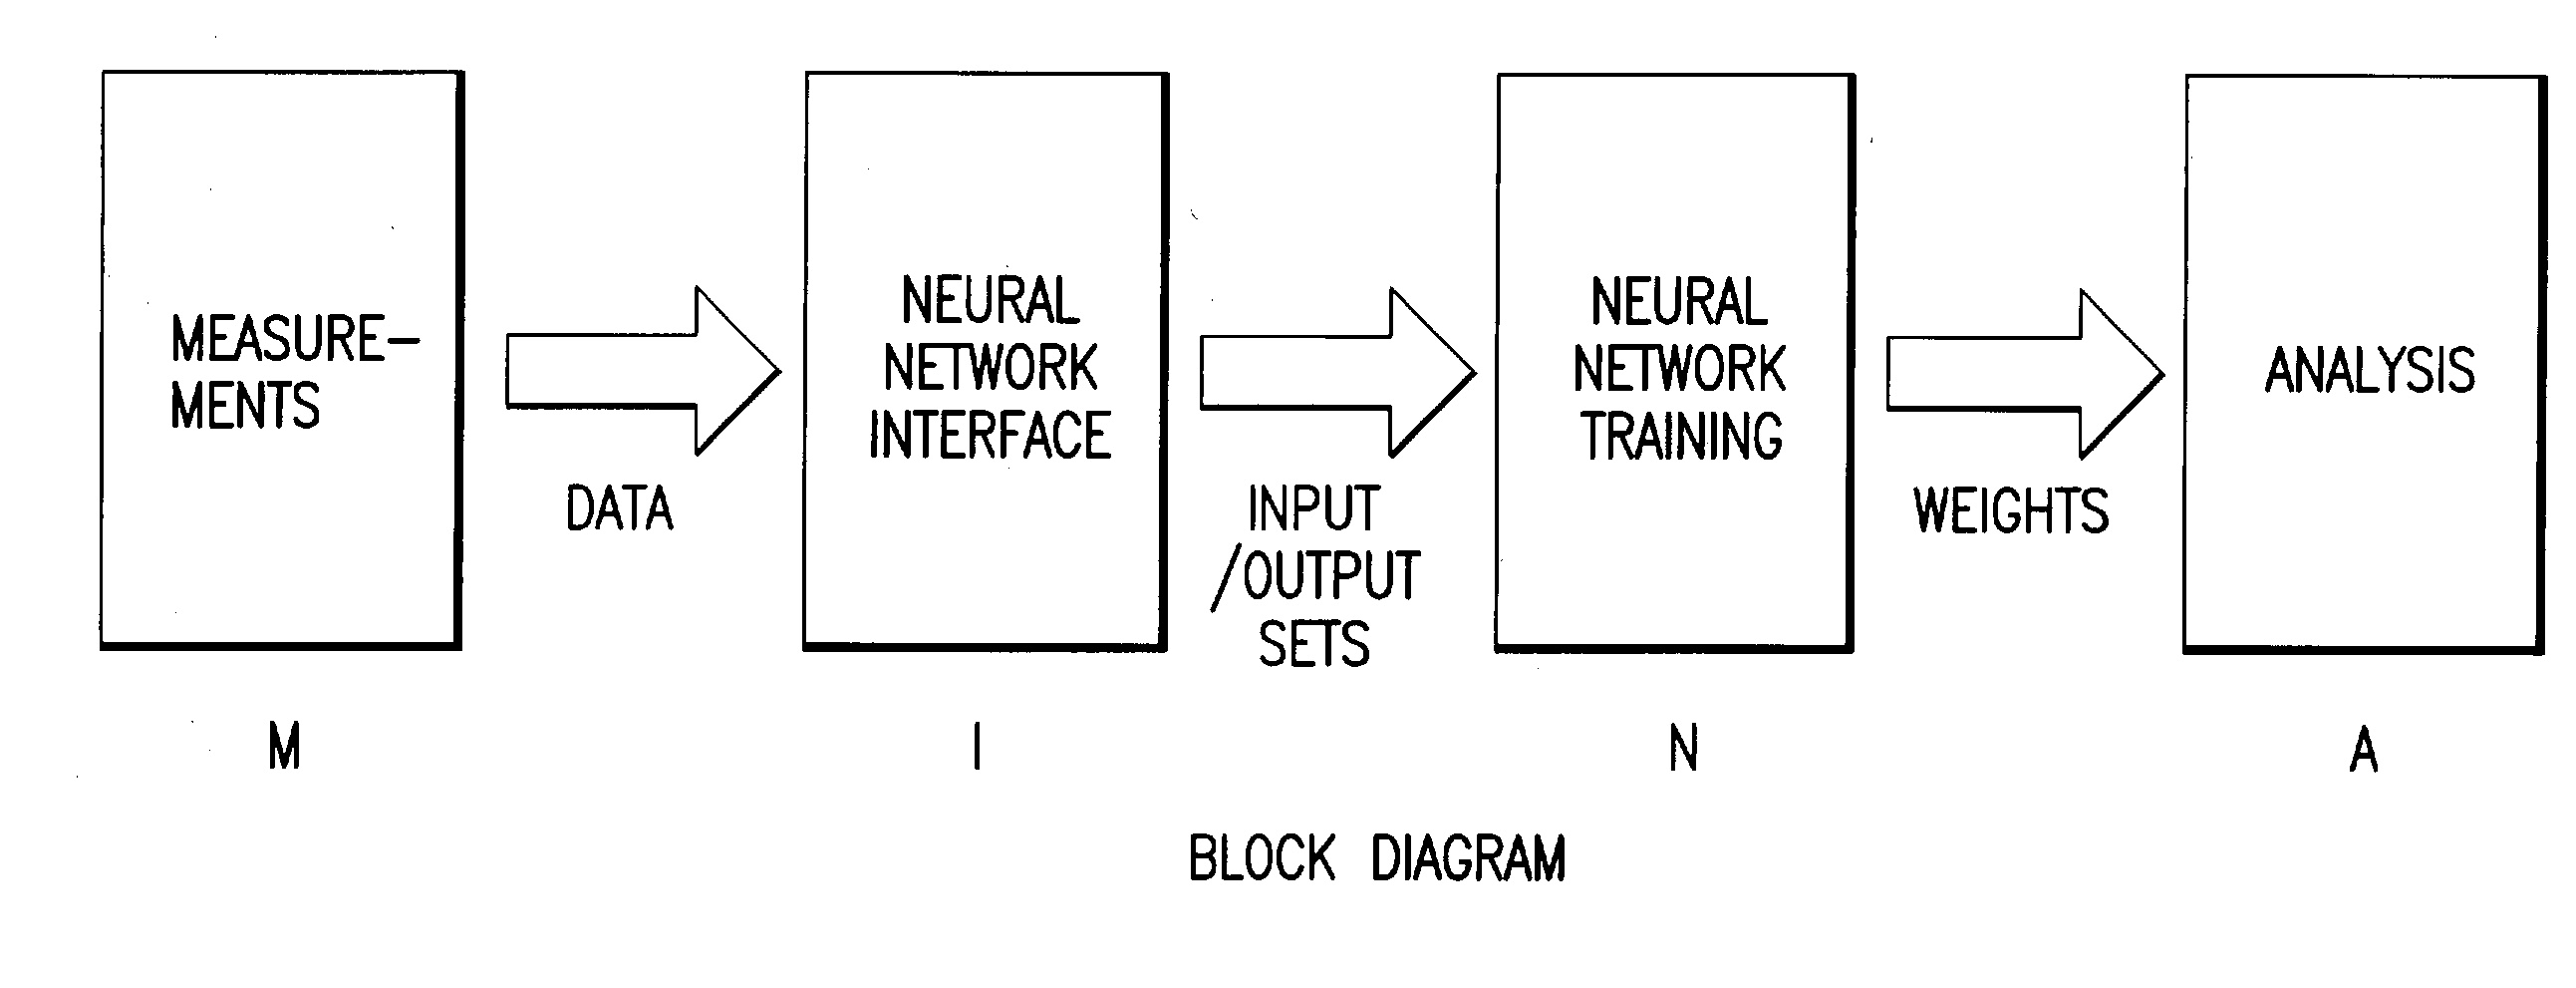
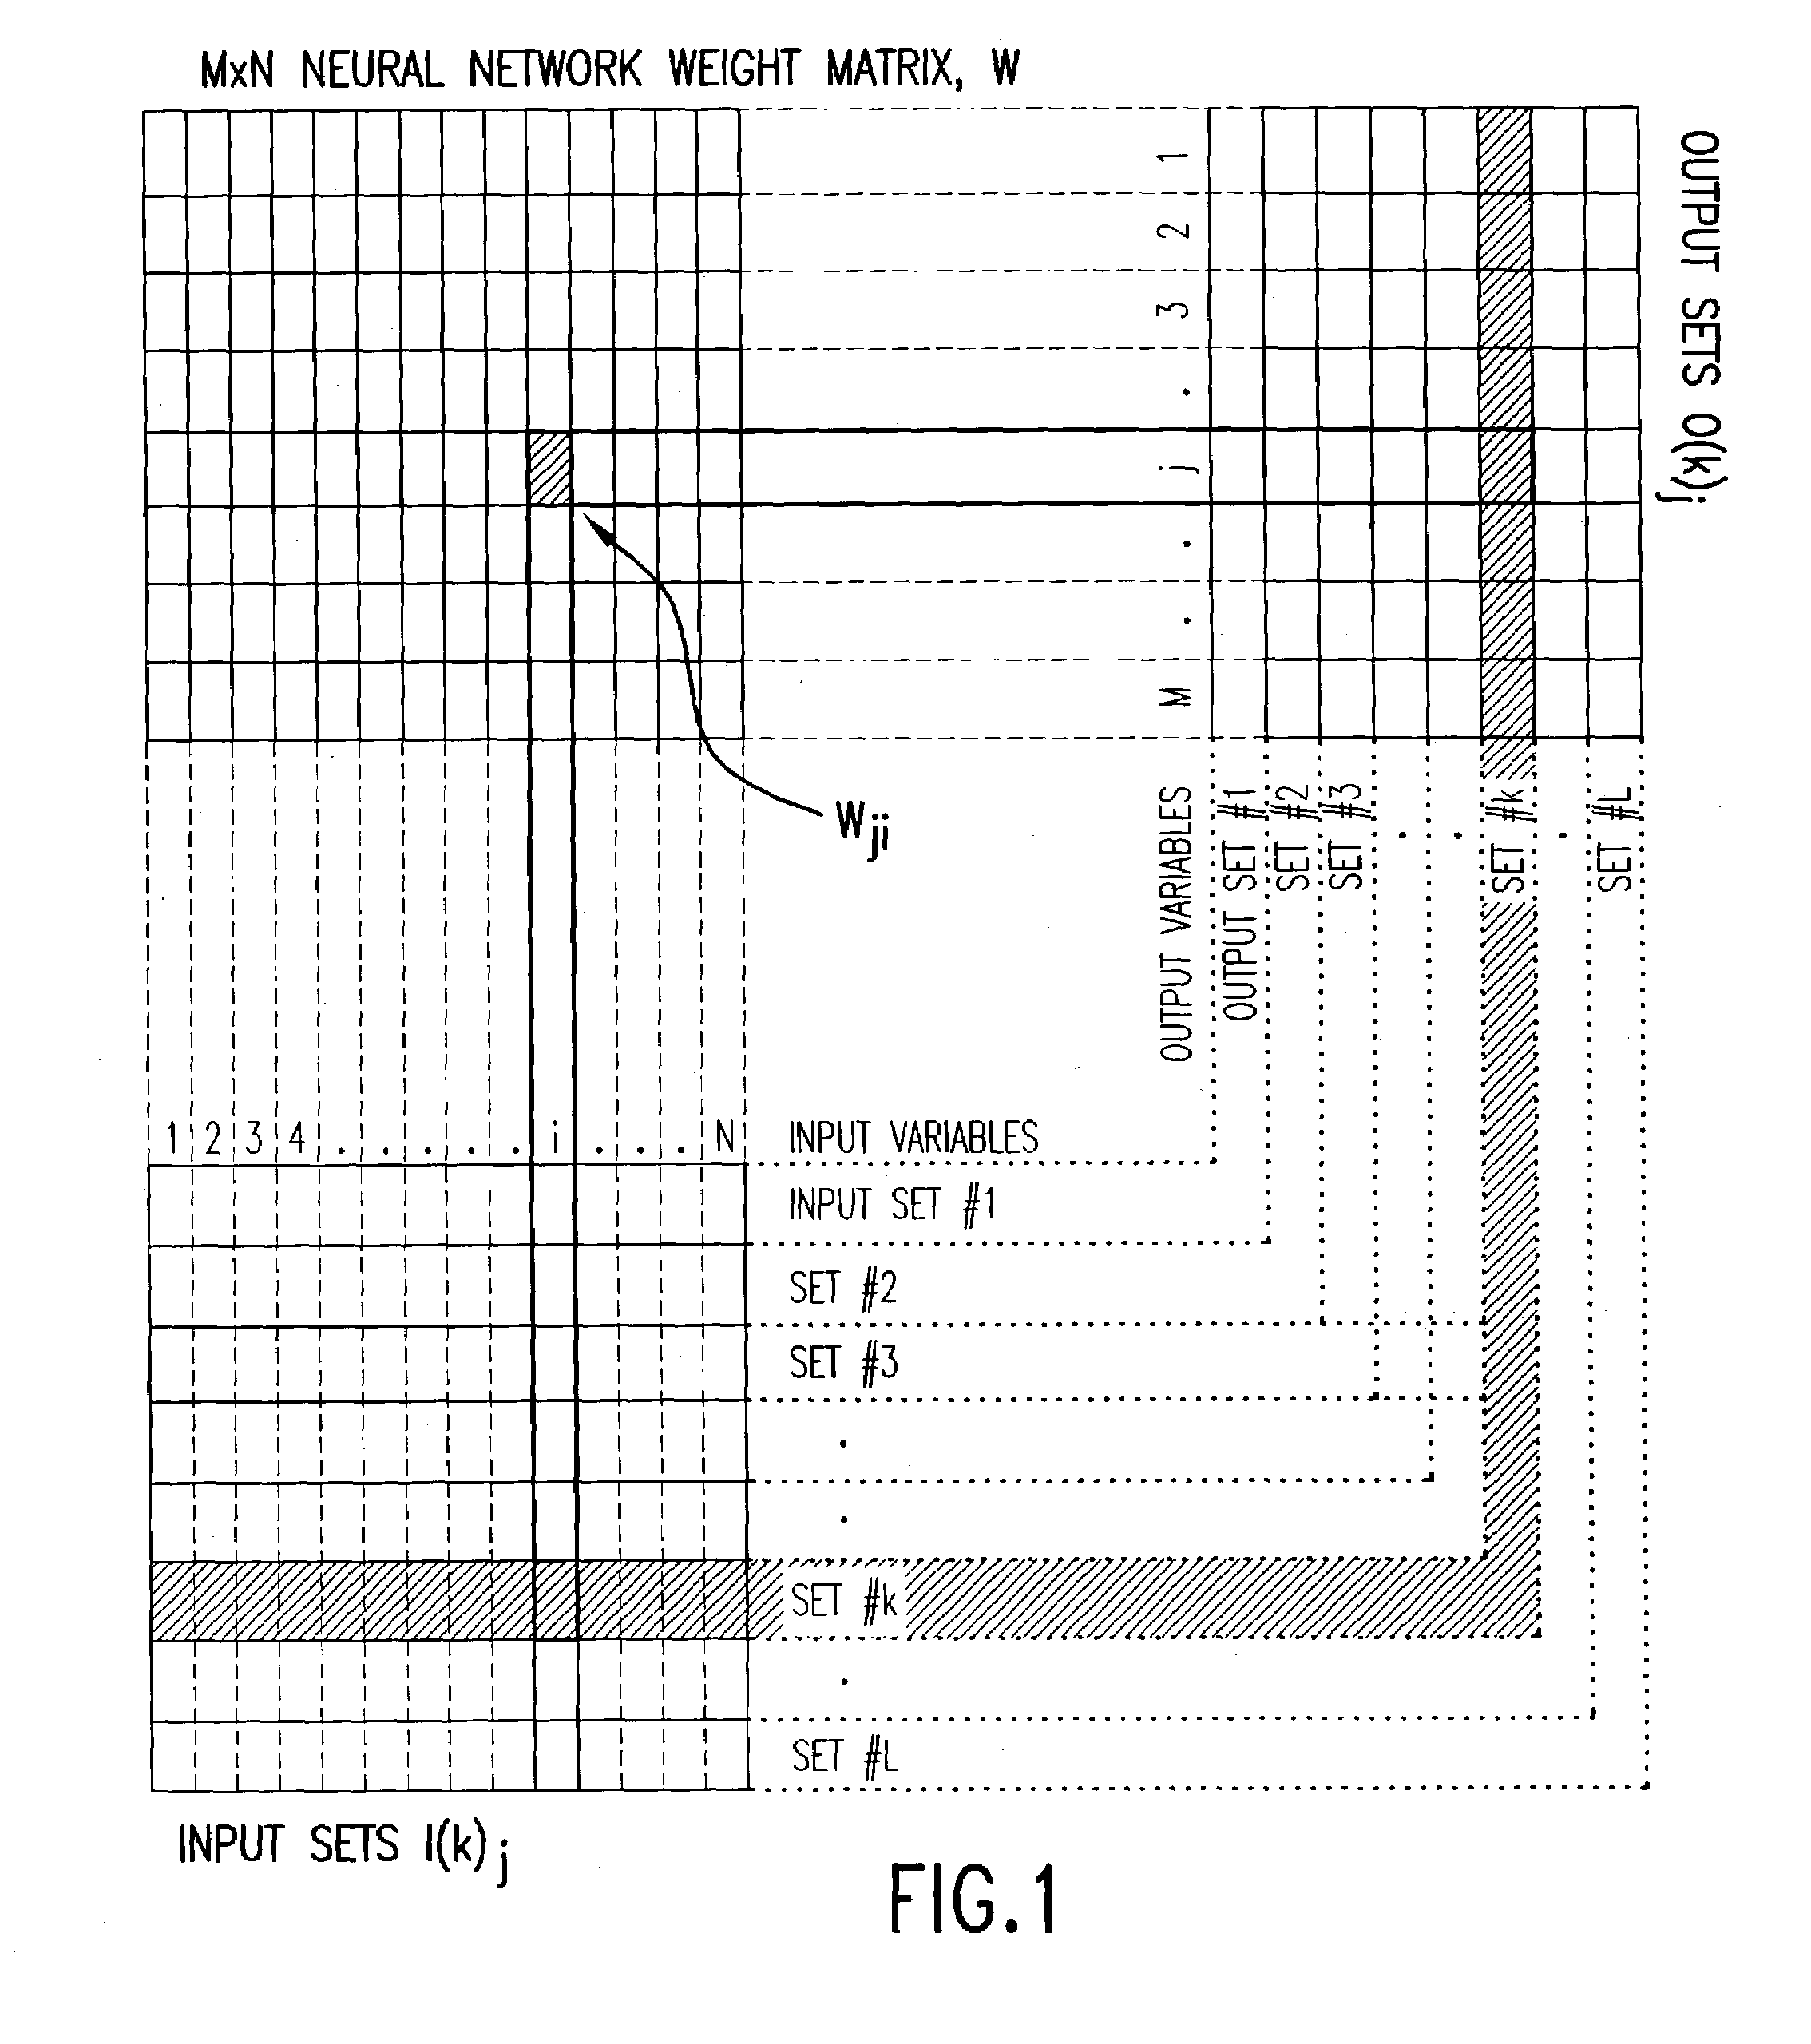
The invention is a method and apparatus for analyzing complex systems by using a single-layer neural network to characterize the relationships between measured variables. The method can sort sets of simultaneous measurements based on the behavior of the system and extract fingerprints of complex states of the system. It can also identify important components of the system and highlight the interactions between them. The invention can be applied to a wide range of biological systems and is particularly useful for studying complex processes. The method is trained using data from control cells and can identify relevant variables even in under-defined cases. The invention provides a unique solution for the weights even in under-defined cases by using additional constraints. The invention can also identify important interactions between variables and construct a weight matrix that emphasizes relevant changes in cellular behavior.

Problems solved by technology

However, these changes are usually too numerous to reveal, or even suggest definitive causal relationships between individual molecular components.
Yet, assigning attributes to molecular changes like cause and effect (upstream-downstream relationships) which appear often obvious in model systems, becomes difficult in many realistic conditions.
However, their detailed functionality often displays system dependent quantitative as well as qualitative diversion compared to their characterization in specialized systems (such as low forms of life or overexpressing cell lines).
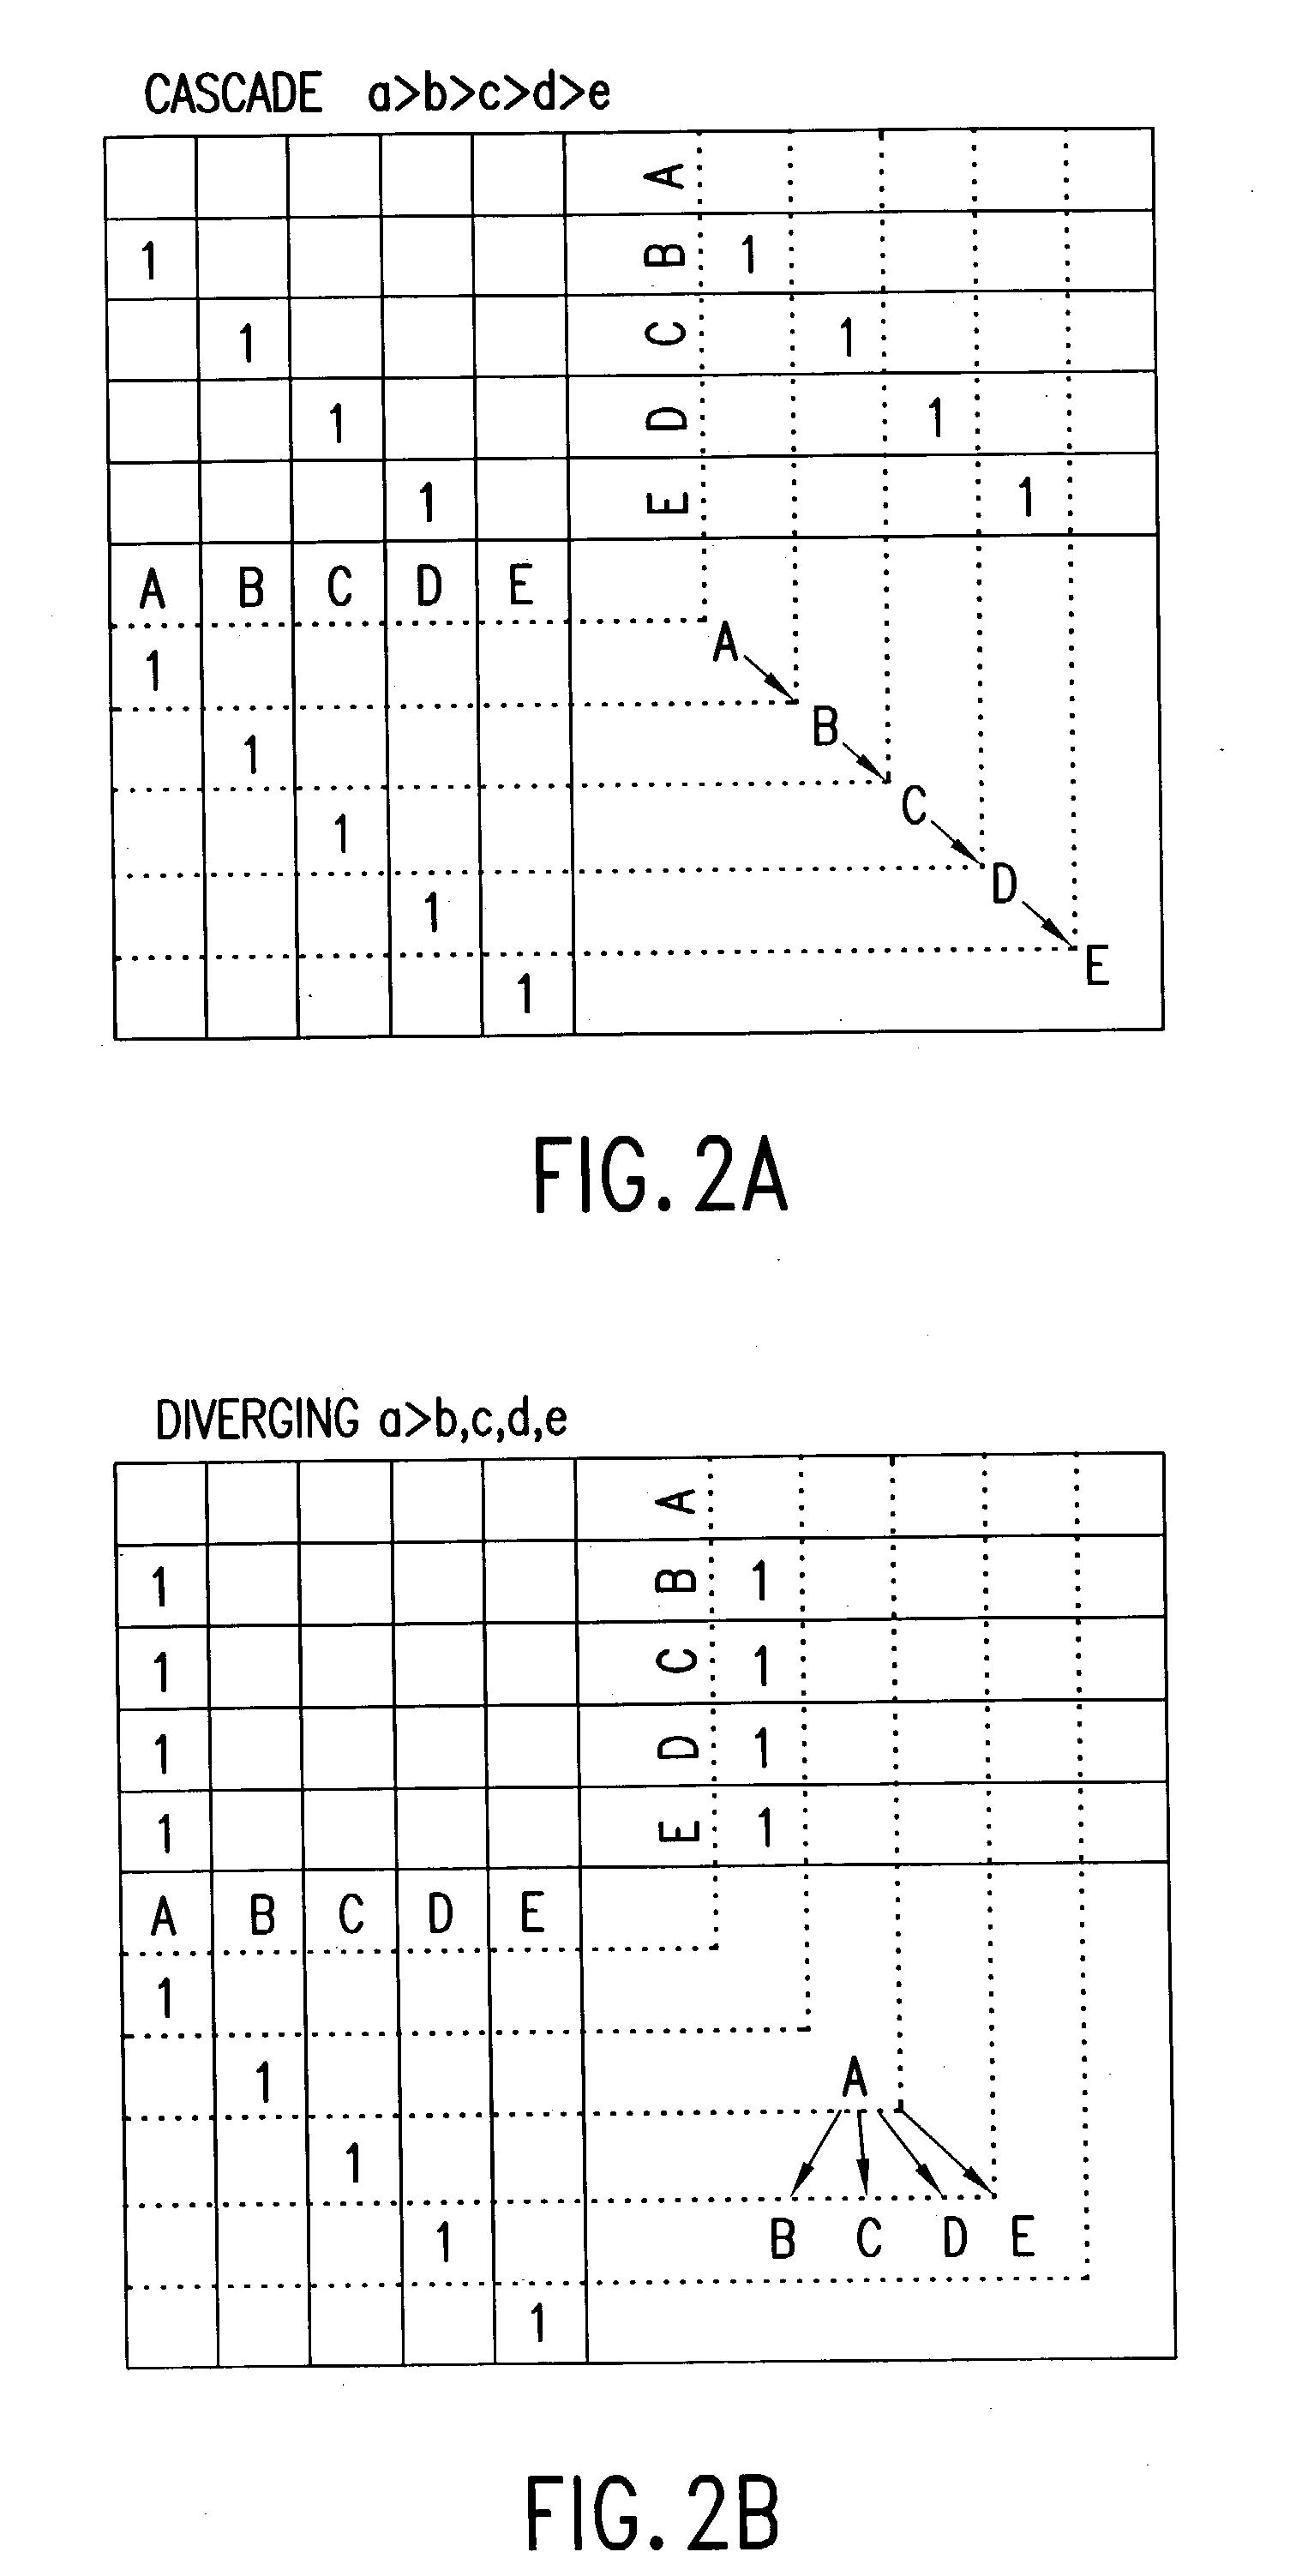
The increasing complexity in species with larger genome is therefore not only attributed to the increasing number of independent cascade-like pathways, but also on the multiplicity of cross-talks and interactions between pathways, which turn them into interlinked networks.
However, it is rarely the case that sufficient information exist to discribe complex biological mechanisms in the level of details required for such dynamic modeling.

Method used


Image

  • Method and apparatus for multivariable analysis of biological measurements
  • Method and apparatus for multivariable analysis of biological measurements
  • Method and apparatus for multivariable analysis of biological measurements

Examples


example 1

Analysis of Growth Hormone Data

[0122]In this example we show an application of neural networks to growth factor signaling demonstrating its use as a method for fingerprinting complex states, such as proliferating cells induced by mitogenic signals, sorting multivariable patterns of data sets into identifiable groups. We used published two dimensional gel maps of phosphorylation [Romano et al. 1994] shown here in FIG. 4(a). Romano et al. [1994] quantifies the phosphorylation of 60 proteins in two NIH3T3 cell constructs expressing epidermal growth factor (EGF) receptor in the first, and erbB-2 chimeras with extracellular EGF receptor fragment in the second. The intensities of the phosphorylated spots as a result of exposure to EGF, are given in Tables 1 and 2 of Romano et al. [1994], which are set forth as Tables 1 and 2 below. For each of the two constructs the phosphorylation levels were evaluated from both radioactive phosphate [32-P] and from anti-phosphotyrosine antibody [pY] blo...

example 2

Analysis of Insulin Data

[0127]This example deals with time-dependent data measured at the Weizmann Institute [Biener et al. 1996]. The signaling pathway activated by insulin has been studied intensively. The events following insulin binding to its receptor (IR) include autophosphorylation, activating the kinase on its intracellular domain, with subsequent phosphorylation of insulin receptor substrates (IRS 1 / 2), proteins p60 / 62, src-homology-2-region containing proteins Shc46, Shc64 and Shc54, Annexin II, mitogene activating protein kinase (MAPK) and other unknown proteins. The insulin response of CHO cells transfected with the insulin receptor (about half a million per cell) was evaluated from phosphorylation levels using phosphotyrosine blots at various times following exposure to insulin [Biener et al. 1996].

[0128]FIG. 5 shows a time dependent phosphotyrosine gel blot of the response to insulin. The gel blots reveal bands, some correspond to identified proteins and are marked, ot...


PUM


Abstract

In a method and apparatus for analyzing multivariable data sets, a general computerized platform is provided for evaluating the relationship between large number of measurements of sets of variables characterizing components of complex states of a system under induced stimulation or controlled conditions. The linked responses of variables and their temporal relations tell about the network of interactions and their hierarchy. Processing of data sets by a simple neural network gives a matrix of weight parameters, that allow to identify fingerprints of complex states characterized by patterns of measured variable and estimate the interactions between the components characterized by the measured variables. The results are provided numerically and by color-coded presentation indicating dominating relations between variables and strongly responding variables. When applied to dynamic responses of a system, the analysis can construct a schematic hierarchical architecture of the network of interaction between the components of the studied system. Applications in biology include analysis of measurements characterizing responses of molecular components in cells under changes induced by stimuli (e.g. drugs, growth factors, hormones, mutations or forced expression of a proteins), and identification of complex cellular states (e.g. proliferation, differentiation, transformation, starvation, necrosis, apoptosis, and the time dependencies of the above effects).

Description

RELATED CASES[0001]This application is a continuation-in-part of application Ser. No. 09 / 345,746 filed Jul. 1, 1999 now abandoned.BACKGROUND OF THE INVENTION[0002]1. Field of the Invention[0003]The present invention relates to a method and apparatus for analyzing multivariable experimental data, and for drawing conclusions concerning relationships between these variables. The invention is especially useful for analyzing processes in complex systems consisting of many components, such as in biology, where the experimentally derived data sets characterize these components and the inducing and inhibiting interactions between them.[0004]2. Prior Art[0005]Modern biological research is revealing in growing details the complexity of living systems. Thus it is generally appreciated that biological mechanisms are the outcome of a large number of highly interactive molecular events. Experimental techniques must provide therefore not only increased sensitivity and selectivity to minute (even i...

Claims


Application Information

Patent Timeline
Patent Type & Authority Patents(United States)
IPC IPC(8): G06E1/00G06E3/00G06F15/18G06G7/00G06N3/02G06F19/00G16B5/30G16B25/00G16B40/20
CPCG06F19/12G06N3/02G06F19/20G06F19/24G06F19/26Y10S706/924G16B5/00G16B25/00G16B40/00G16B45/00G16H50/20Y02A90/10G16B5/30G16B40/20
Inventor KAM, ZVI
Owner YEDA RES & DEV CO LTD
Learn More