Device and method for determining a cardiac condition using a complex signal formed from a detected cardiac signal
a cardiac signal and complex signal technology, applied in the direction of sensors, diagnostics, catheters, etc., can solve the problems of inability to distinguish between different types of tachycardia and fibrillation, inappropriate shock delivery,
- Summary
- Abstract
- Description
- Claims
- Application Information
AI Technical Summary
Benefits of technology
Problems solved by technology
Method used
Image
Examples
first embodiment
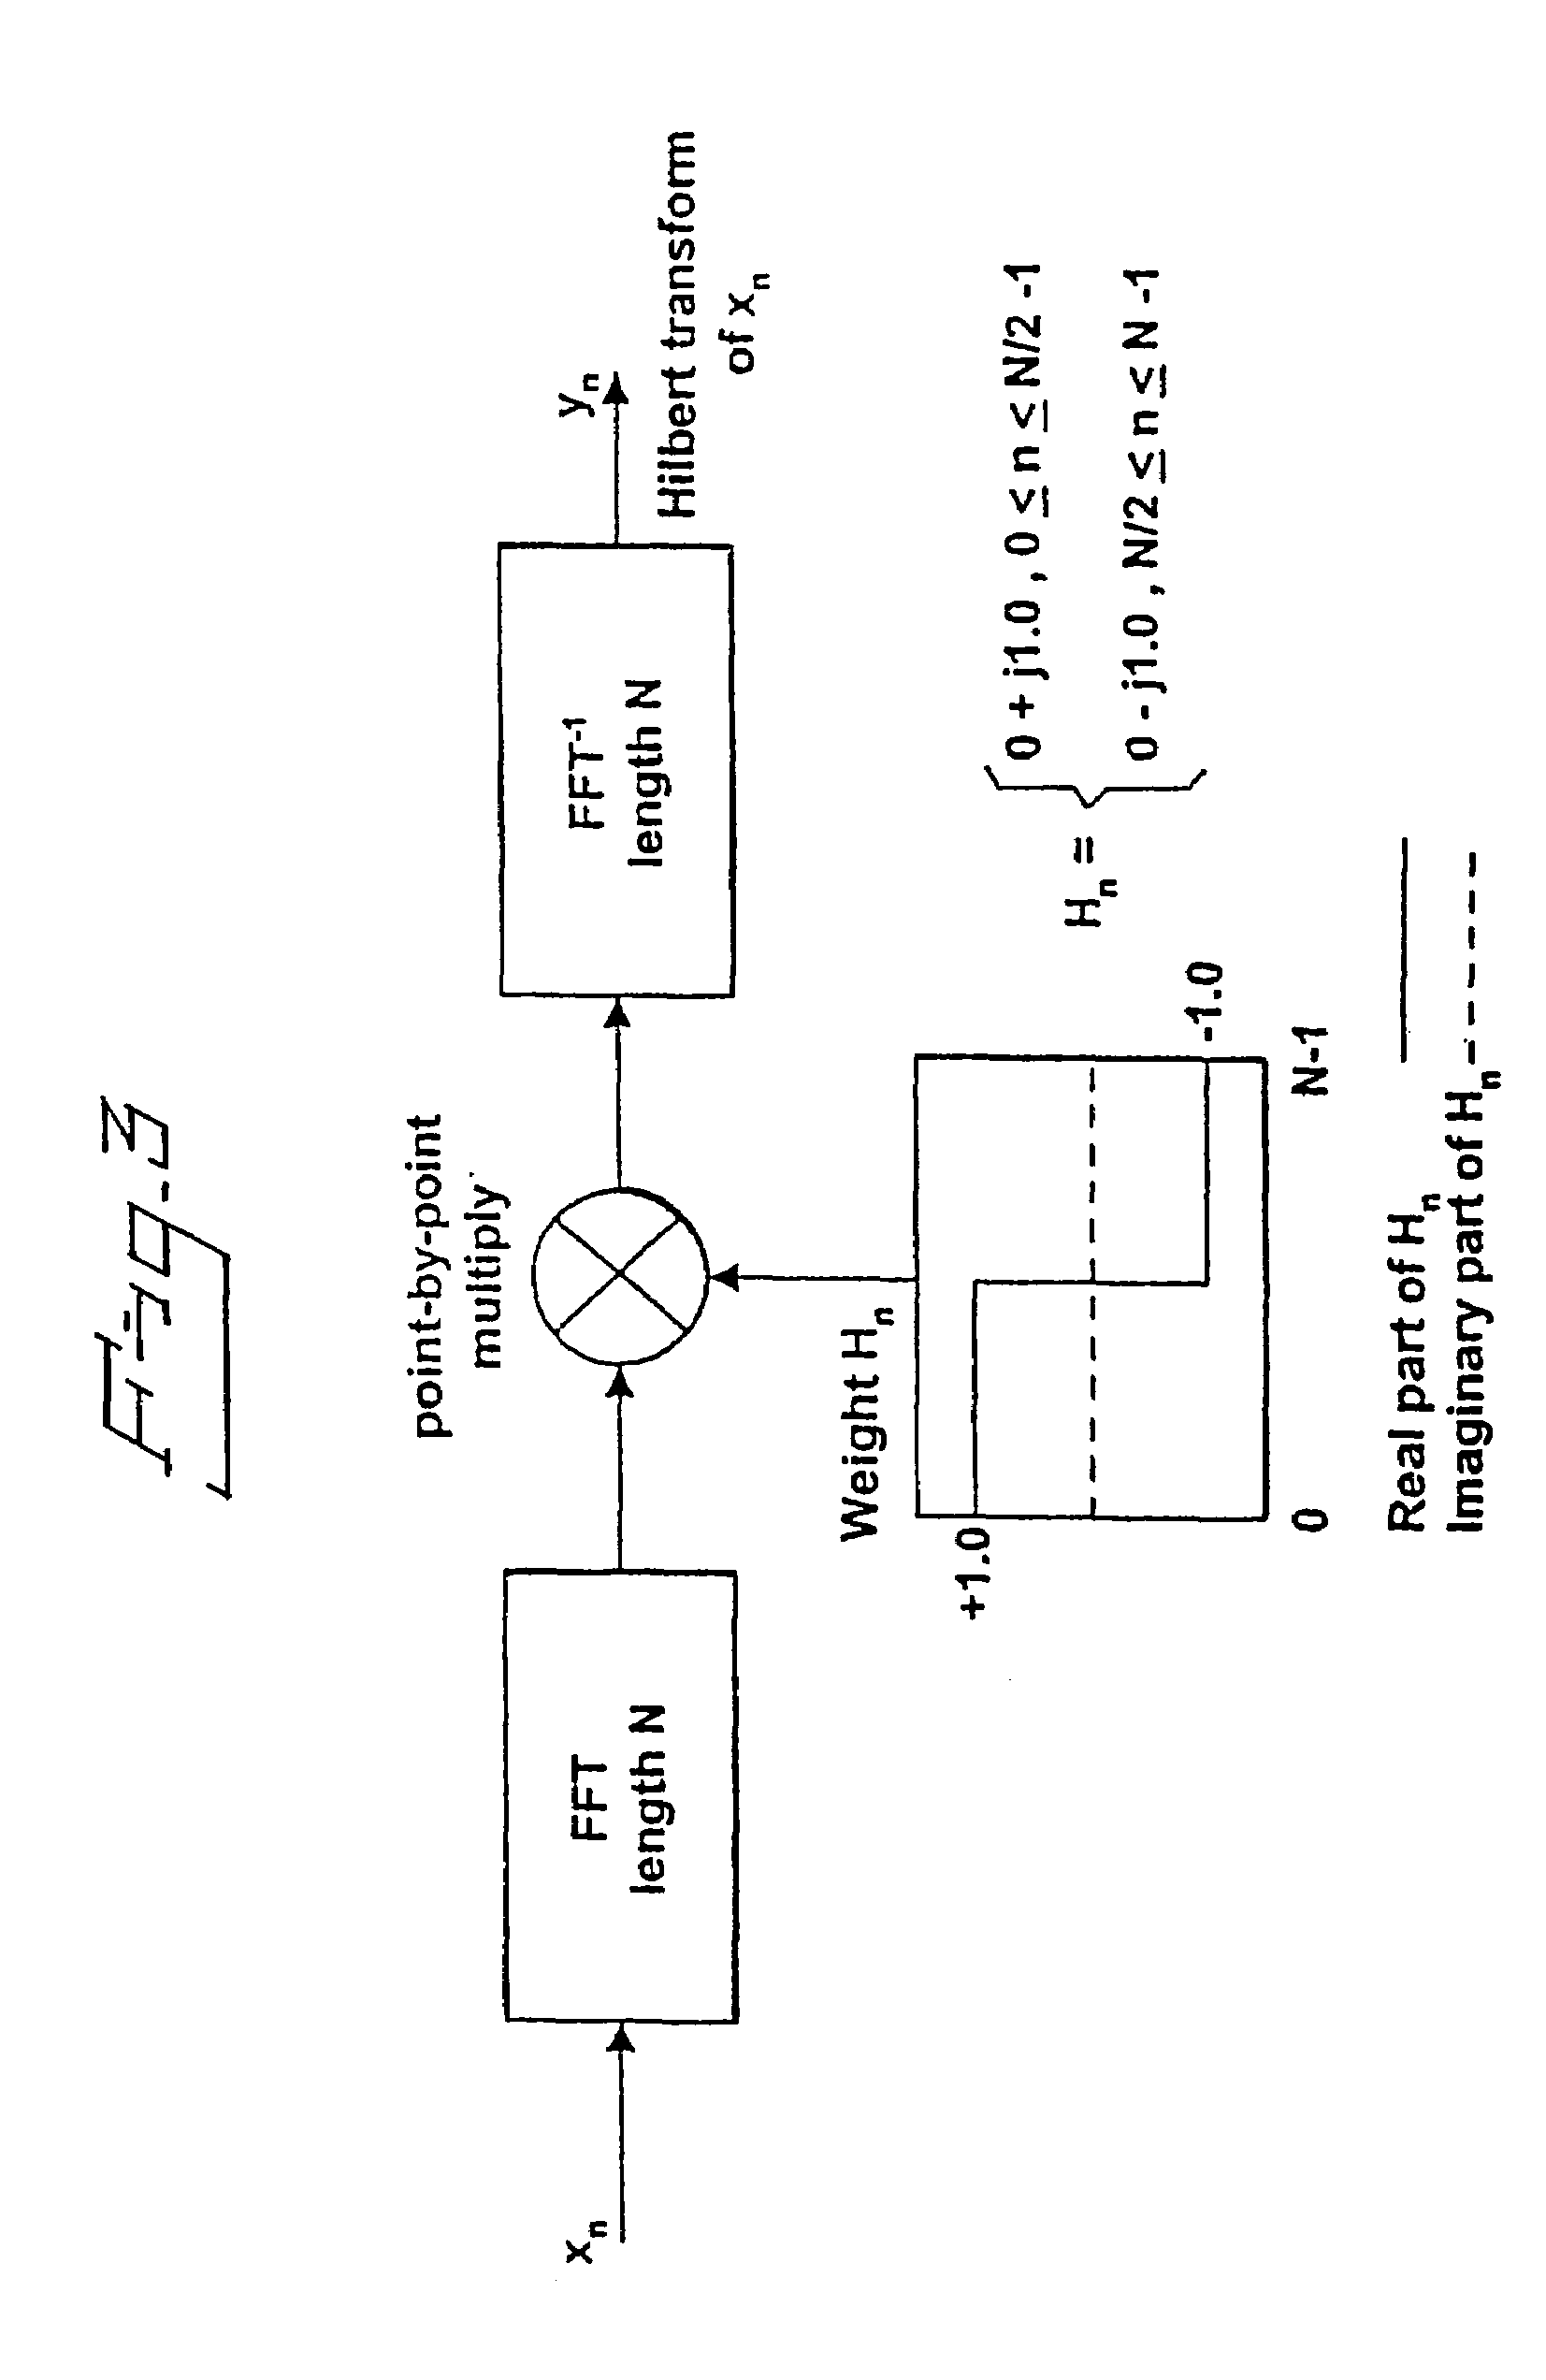
[0048]The following describes how an analytic signal is obtained according to the present invention.
[0049]In order to increase the understanding of the present invention an introduction is given where the analytic signal and the Hilbert transform are described.
Introduction
[0050]A real signal x(t) contains equal amounts of positive and negative frequencies if we perform a spectral analysis. We always have |x(−f)|=|x(f)| where x(f) denotes the spectrum of the real signal x(t). The reason for this is the Euler identity
ejθ=cos(θ)+j sin(θ)
[0051]Of which follows that
[0052]cos(θ)=ⅇjθ+ⅇ-jθ2sin(θ)=ⅇjθ-ⅇ-jθ2j
[0053]By setting θ=ωt+α we see that both sine and cosine (and hence all real sinusoids) consist of a sum of equal and opposite circular motion.
[0054]A complex sinusoid is simpler than a real sinusoid because the complex sinusoid consists of one frequency while the real consists of two frequencies, one positive and one negative.
Aej(wt+α) Complex
A sin(ωt+α) Real
[0055]The real sinusoid is...
third embodiment
[0188]FIG. 19 shows a graphical illustration of this third embodiment having as y-axis the amplitude in mV and as x-axis the frequency in beats per minute (BPM). A straight line separates the area into a “no VF area” and a “VF-detection area”. Short time segments (a few seconds) selected from different situations are shown, where each specific situation is related to a specific area of the plot. In this example the line is the 225% threshold. Ventricular fibrillation is detected when the signals are inside the VF-detection area.
fourth embodiment
[0189]FIG. 20 is an illustration of the present invention. The measured signal is the intracardiac IEGM signal measured between tip and ring of an electrode located in the right atrium. The applied processing is the product P=F*E. The sensor signal is a normalized value of the product, Pdetect=P / Pn, where Pn is a 10 seconds average of P during normal conditions. It is an advantage in this case to enhance the detection using the rate and amplitude increase in the IEGM during atrial fibrillation. The figure shows the spontaneous termination of atrial fibrillation and the change to normal sinus rhythm. The detection level was set to 300% in this case.
[0190]FIG. 21 illustrates the fourth embodiment in a greater scale that shows the transition from atrial fibrillation (AF) to sinus rhythm (SR).
[0191]FIG. 22 also illustrates the fourth embodiment in a still greater scale that shows the transition from AF to SR.
[0192]FIG. 23 is a graphical illustration of the fourth embodiment. The whole d...
PUM
 Abstract
Description
Claims
Application Information
 - R&D
- Intellectual Property
- Life Sciences
- Materials
- Tech Scout
- Unparalleled Data Quality
- Higher Quality Content
- 60% Fewer Hallucinations
Browse by: Latest US Patents, China's latest patents, Technical Efficacy Thesaurus, Application Domain, Technology Topic, Popular Technical Reports.
© 2025 PatSnap. All rights reserved.Legal|Privacy policy|Modern Slavery Act Transparency Statement|Sitemap|About US| Contact US: help@patsnap.com


