Apparatus and accompanying methods for visualizing clusters of data and hierarchical cluster classifications

a cluster classification and data technology, applied in the field ofapparatus and accompanying methods for visualizing clusters of data and hierarchical cluster classification, can solve the problems of difficulty in analyzing the access patterns of thousands of users, difficulty in practical difficulty, and inability of web masters to include advertisements directed to teenagers on certain web pages, so as to facilitate user discovery and understanding, facilitate user discovery, and facilitate the effect of enhancing

Inactive Publication Date: 2008-02-19
MICROSOFT TECH LICENSING LLC
View PDF31 Cites 375 Cited by
  • Summary
  • Abstract
  • Description
  • Claims
  • Application Information

AI Technical Summary

Benefits of technology

[0024]A second and increasingly sophisticated embodiment of the present invention not only provides automatic category determination and record clustering and display, but also provides a visualization tool that, for summarized cluster data in the form of segments, calculates similarity measures therebetween, and, based on those measures, forms and graphically depicts multi-level hierarchical organizations of those segments. The system also compares two user-selected segments or segment groups together and graphically displays normalized scored comparison results, and by so doing, readily enhances and facilitates user understanding of inter-relationships among a data population represented by the clusters.
[0025]Furthermore, since some clustering distinctions, which are the product of mathematical clustering techniques, may be rather granular from a quantitative perspective but essentially meaningless, from a qualitative standpoint, this embodiment automat...

Problems solved by technology

However, it may be very difficult for the web master to analyze the access patterns of thousands of users involving possibly hundreds of web pages.
However, the web master may not want to include advertisements directed to teenagers on a certain web page if users in a different category who are senior citizens who also happen to access that web page frequently.
Yet, a practical difficulty has arisen.
While categories (also known as classes) can be readily and automatically extracted from data, such as on-line consumer transaction data, through well-known conventional clustering techniques such as the “EM” algorithm, it has proven to be rather difficult to present category data in a simple meaningful and easily understood manner to a business manager who is making marketing or other decisions based on that data.
However, textual data, particularly if it is voluminous, which is very often the case with consumer purchasing data, is extremely tedious for an analyst to quickly comprehend (i.e., “digest”) particularly when looking for trends or other relationships that are “hidden” in the data.
The resulting clusters provide little, if any and often no, physically discernible basis in reality, ...

Method used


Image

  • Apparatus and accompanying methods for visualizing clusters of data and hierarchical cluster classifications
  • Apparatus and accompanying methods for visualizing clusters of data and hierarchical cluster classifications
  • Apparatus and accompanying methods for visualizing clusters of data and hierarchical cluster classifications

Examples


first embodiment

[0108]FIG. 8 depicts, in high level form, implementational components of the inventive CV system.

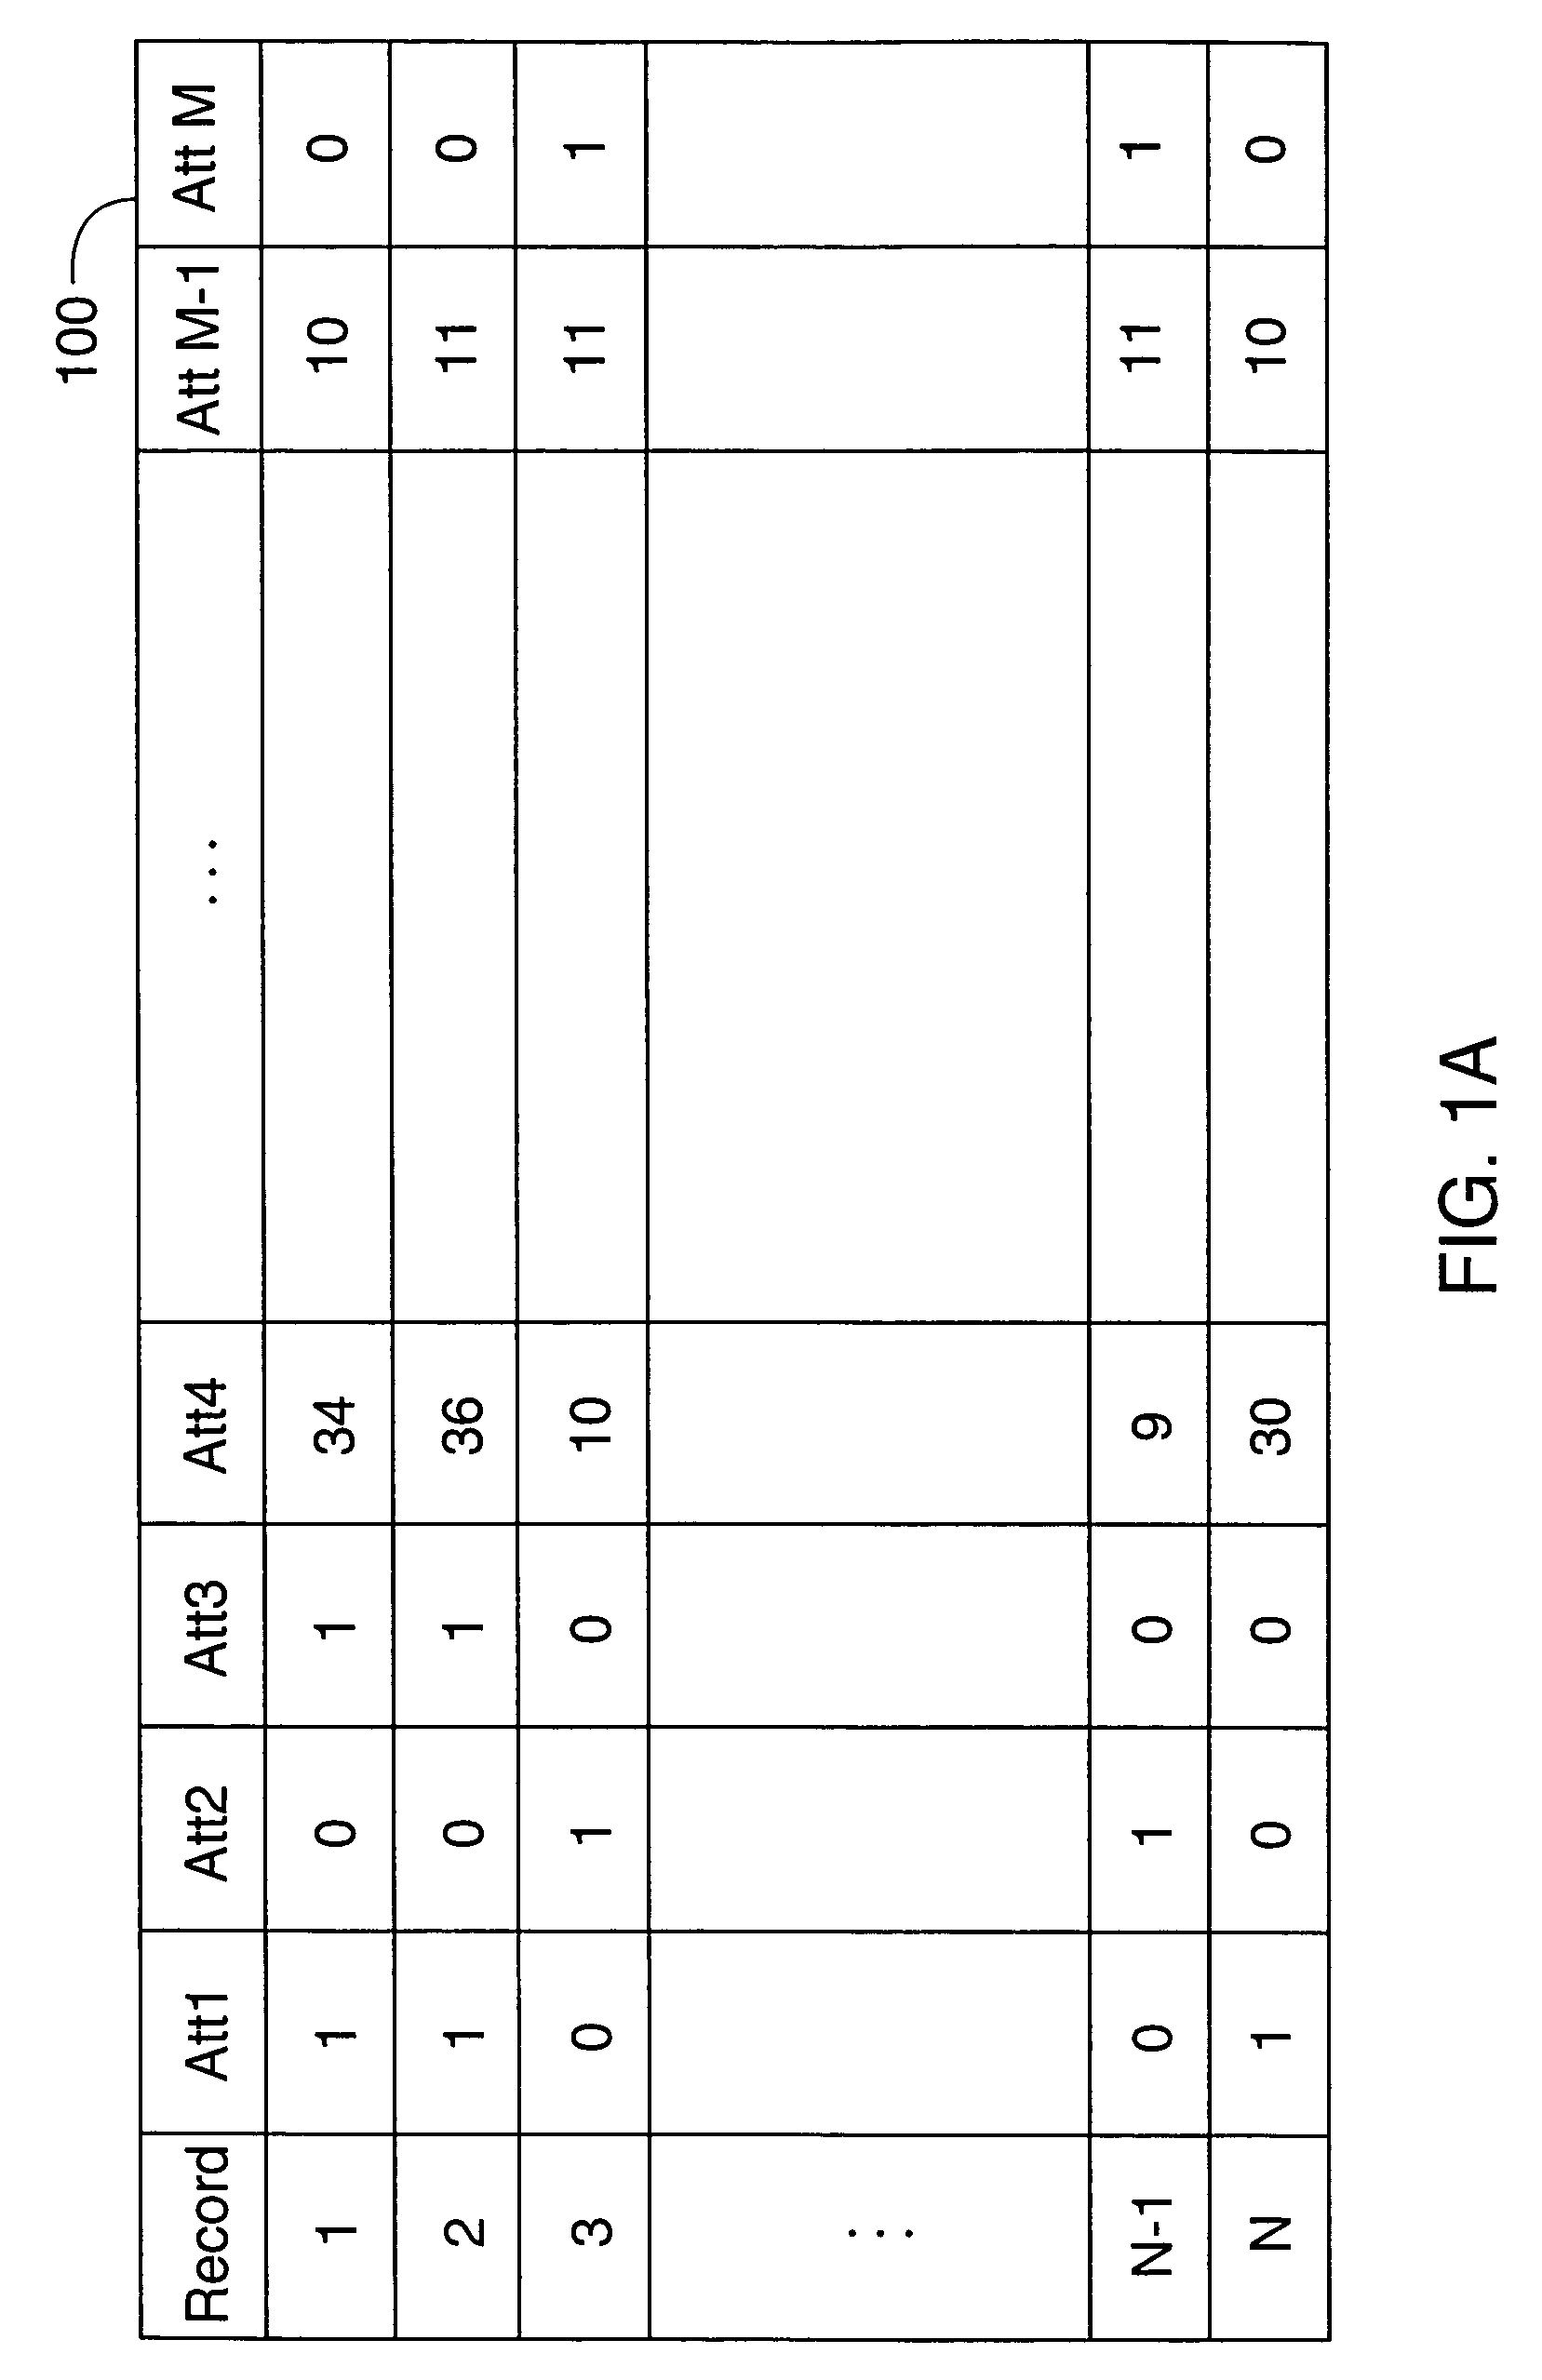
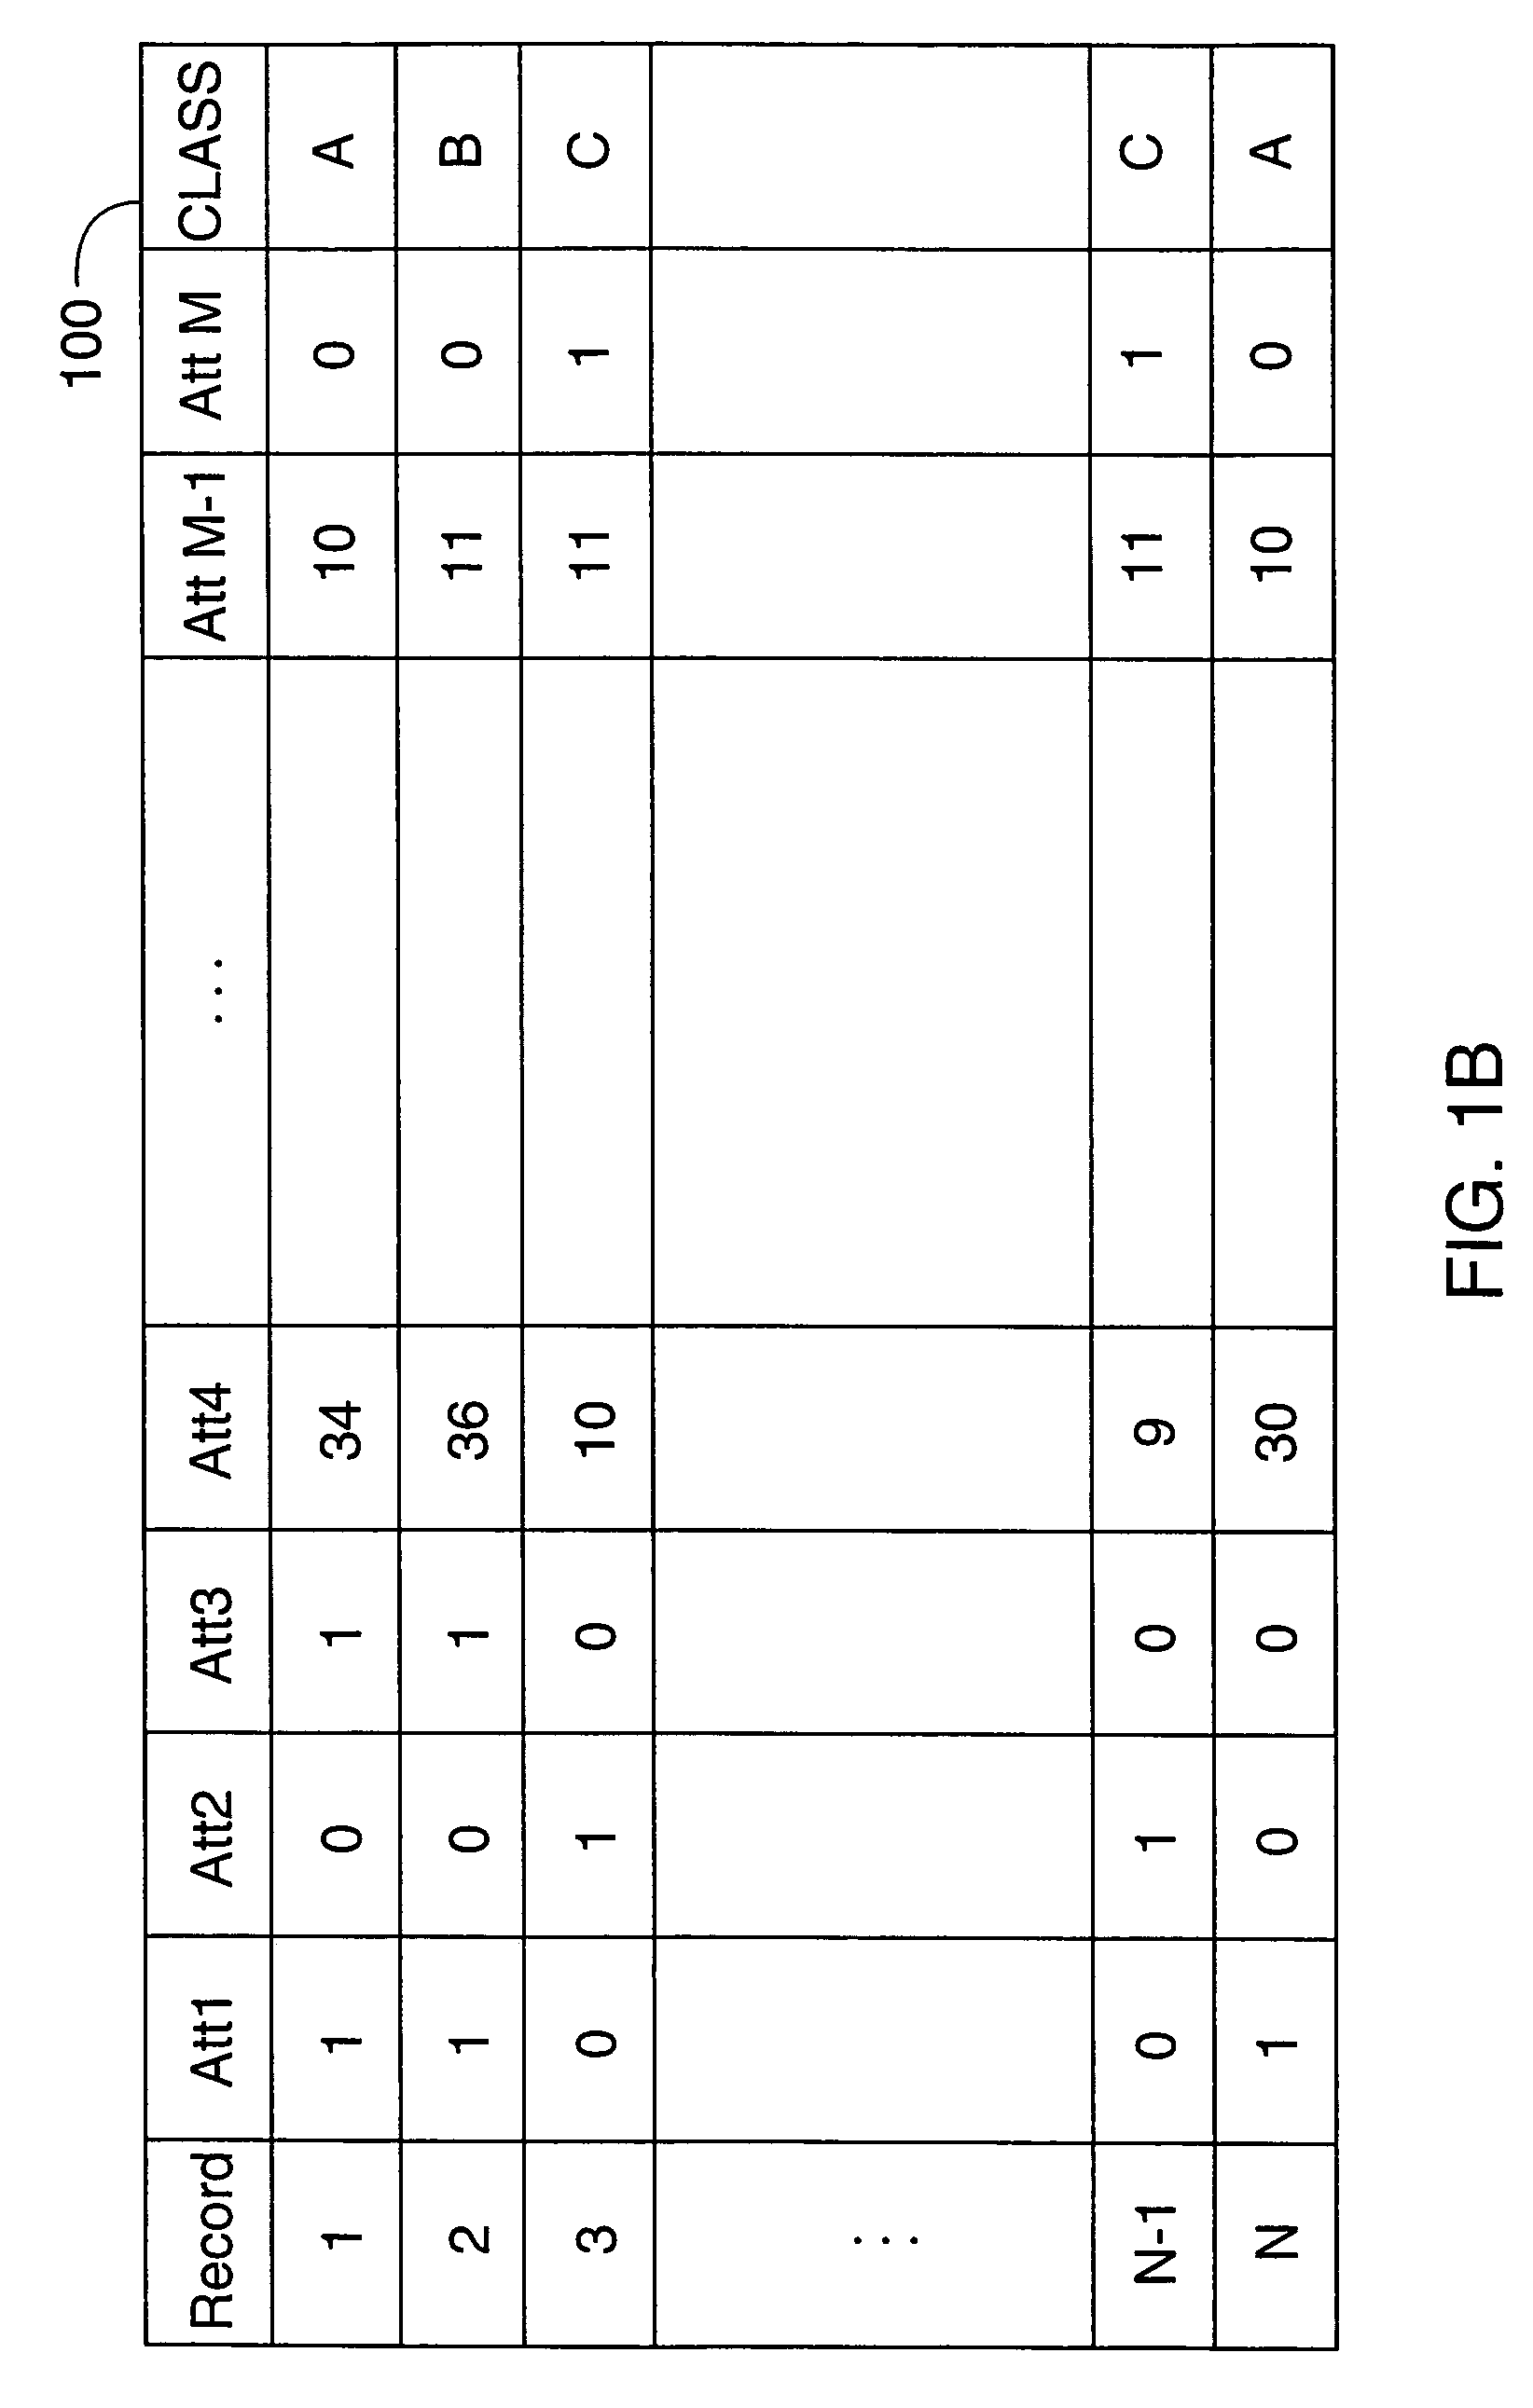
[0109]As shown, the CV system executes on computer system 800 which includes a central processing unit, memory, and input / output devices. The CV system includes collection storage component 801, categorizer component 802, category storage component 803, user interface component 804 and analysis component 805. The collection storage component contains the attribute value for each attribute of each record in the collection. The categorizer component inputs the records of the collection storage component and identifies the various categories and stores the identification of the categories in the category storage component. The user interface component inputs data from the collection storage component and the category storage component and generates the various category graphs which are displayed on display 806. The user interface component invokes the analysis component to process the categ...

second embodiment

[0120]FIG. 13 depicts, at a very high level, a block diagram of networked system 1300, that implements the present invention, to provide clustering, cluster summarization, segment scoring, segment comparison and interactive hierarchical display of segments of cases that illustratively occur in an Internet-based electronic commerce environment.

[0121]As shown, an Internet user stationed at client PC 1305 communicates through Internet 1320, via network connections 1315 and 1325, with server computer 1400 at a remote web site. This server implements, through Commerce Server system 1330, electronic commerce. Commerce Server system 1330 provides various functions that collectively implement infrastructure necessary to provide a comprehensive scalable, robust electronic business-to-business or business-to-consumer commerce web site; namely, user profiling, product cataloguing and content management, transaction processing, targeted marketing and merchandizing functionality, and analysis of...


PUM


Abstract

A system that incorporates an interactive graphical user interface for visualizing clusters (categories) and segments (summarized clusters) of data. Specifically, the system automatically categorizes incoming case data into clusters, summarizes those clusters into segments, determines similarity measures for the segments, scores the selected segments through the similarity measures, and then forms and visually depicts hierarchical organizations of those selected clusters. The system also automatically and dynamically reduces, as necessary, a depth of the hierarchical organization, through elimination of unnecessary hierarchical levels and inter-nodal links, based on similarity measures of segments or segment groups. Attribute/value data that tends to meaningfully characterize each segment is also scored, rank ordered based on normalized scores, and then graphically displayed. The system permits a user to browse through the hierarchy, and, to readily comprehend segment inter-relationships, selectively expand and contract the displayed hierarchy, as desired, as well as to compare two selected segments or segment groups together and graphically display the results of that comparison. An alternative discriminant-based cluster scoring technique is also presented.

Description

CROSS-REFERENCE TO RELATED APPLICATIONS[0001]This application is a continuation of U.S. patent application Ser. No. 09 / 845,151, filed on Apr. 30, 2001, and entitled “APPARATUS AND ACCOMPANYING METHODS FOR VISUALIZING CLUSTERS OF DATA AND HIERARCHICAL CLUSTER CLASSIFICATIONS,” which is a continuation-in-part of co-pending U.S. patent application Ser. No. 09 / 104,751, filed on Jun. 25, 1998, and entitled “METHOD AND SYSTEM FOR VISUALIZATION OF CLUSTERS AND CLASSIFICATIONS”. The entireties of these applications are incorporated herein by reference.BACKGROUND OF THE DISCLOSURE[0002]1. Field of the Invention[0003]The invention relates to a system that incorporates an interactive graphical user interface for graphically visualizing clusters (specifically segments) of data. Specifically, the system automatically categorizes incoming case data into clusters, summarizes those clusters into segments, determines similarity measures for those particular segments and then forms and visually depic...

Claims


Application Information

Patent Timeline
IPC IPC(8): G06F17/30G06F7/00
CPCG06F17/30713G06Q30/0641Y10S707/99936Y10S707/99935Y10S707/99934Y10S707/99945Y10S707/99942Y10S707/99944Y10S707/99948G06F16/358
Inventor HECKERMAN, DAVID E.BRADLEY, PAUL S.CHICKERING, DAVID M.MEEK, CHRISTOPHER A.
Owner MICROSOFT TECH LICENSING LLC
Why Eureka
Try Eureka