
Efficient statistical timing analysis of circuits

a statistical timing analysis and integrated circuit technology, applied in the field of statistical timing analysis of integrated circuits, can solve the problems of increasing noise, increasing timing variations, and timing parameters to deviate from their designed value, so as to improve computational speed, reduce storage burden, and increase error

Active Publication Date: 2008-03-25
ZHANG LIZHENG +2
View PDF58 Cites 13 Cited by
  • Summary
  • Abstract
  • Description
  • Claims
  • Application Information

AI Technical Summary

Benefits of technology

[0036]βXj is a global sensitivity reflecting the dependence of X on global variation j in the circuit.Further, this combination can be easily expressed in a vector format, referred to herein as the Variation Vector Timing Model, which can greatly ease computation.
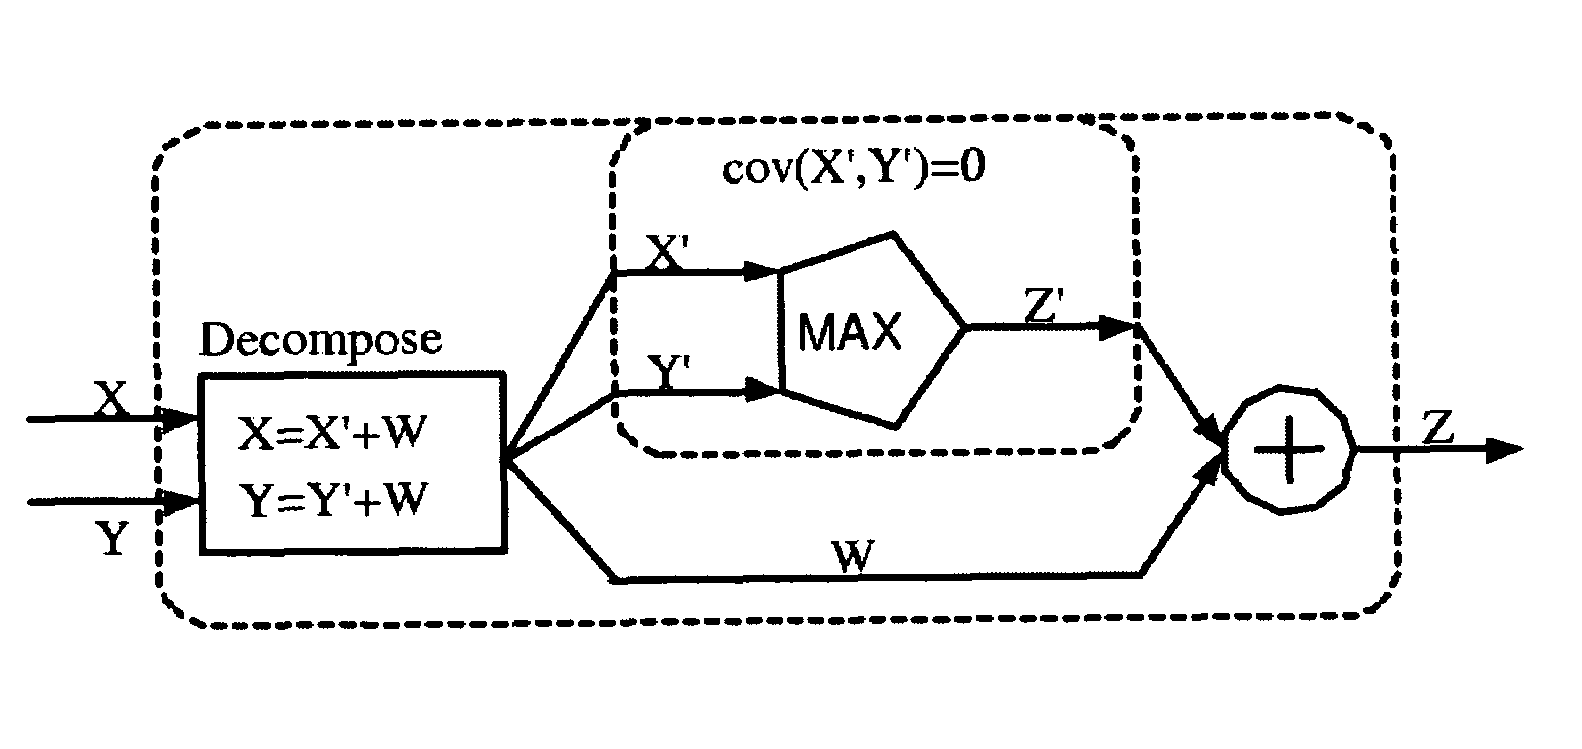
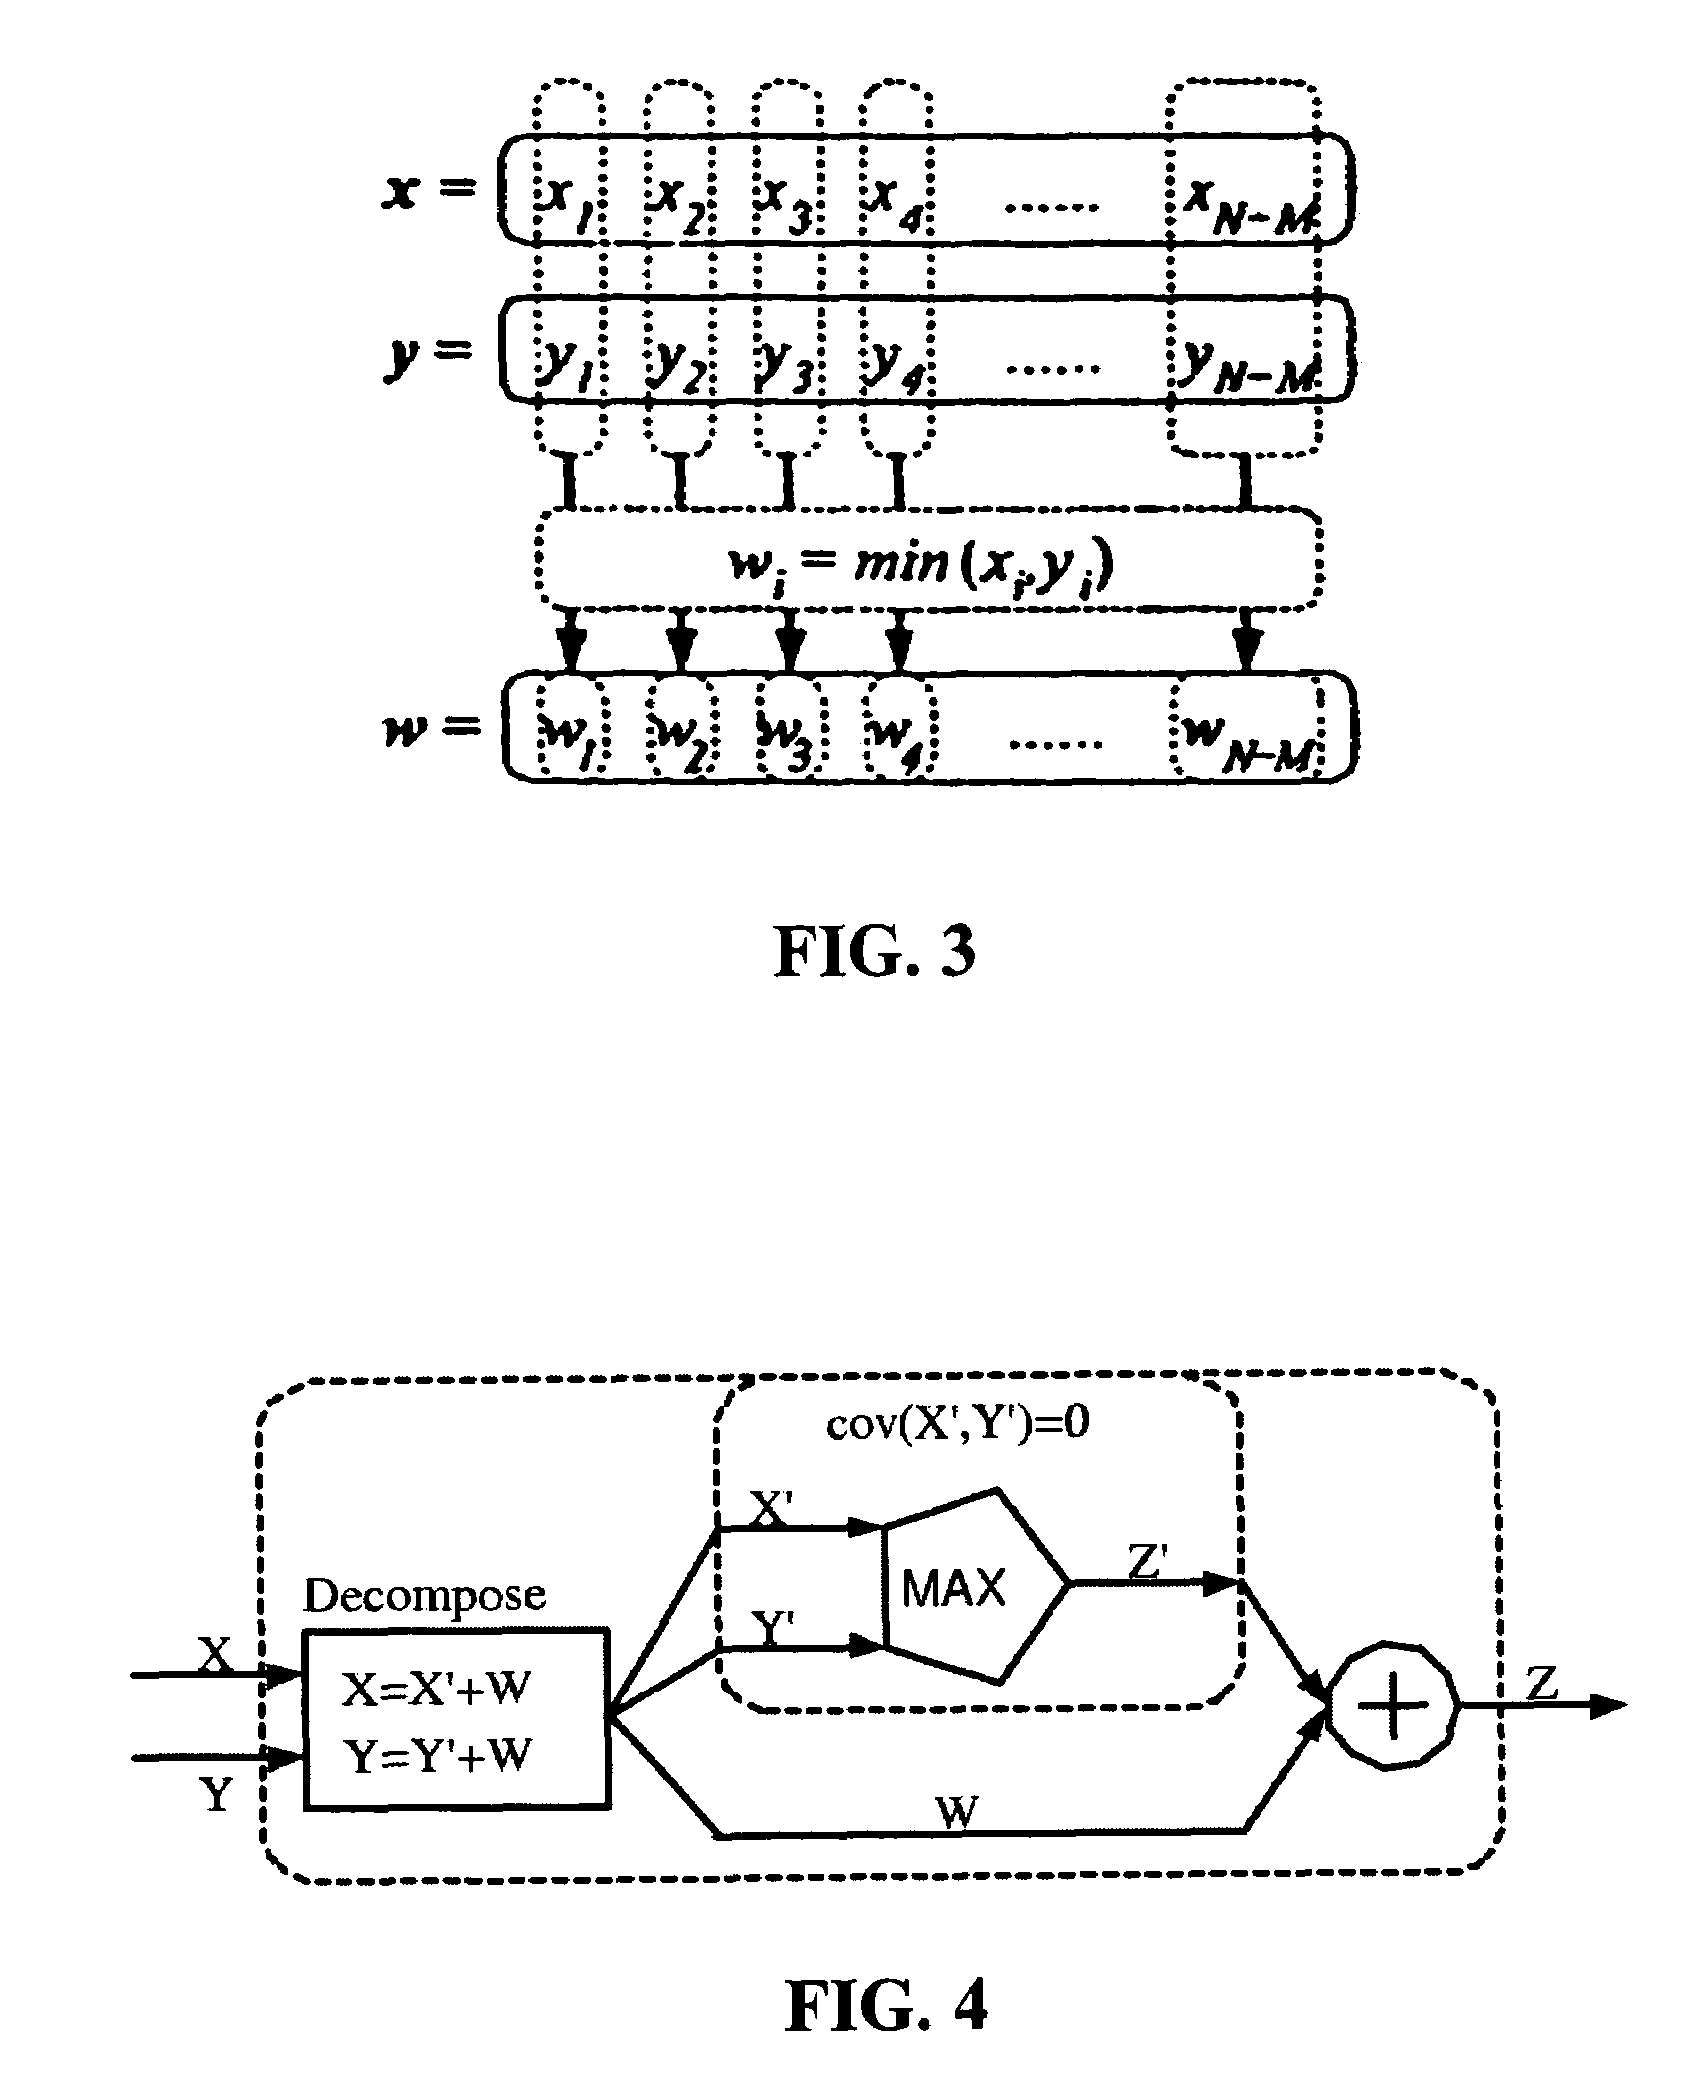
[0037]Section 3 of the Detailed Description then discusses how correlated timing elements can be decomposed into independent (uncorrelated) ones, and then used in the extended canonical timing model (and its variation vector equivalent) to further simplify computation. Here, timing elements X and Y having cov(X, Y)≠0 (i.e., correlated elements) can be substituted with equivalent delays X′+W=X and Y′+W=Y, wherein W is such that cov(X, Y)=0. As will be discussed in Section 3, this can greatly simplify MAX operations.
[0039]Section 5 of the Detailed Description then describes a preferred modification of the foregoing steps wherein the variation vector timing model is “pruned” to eliminate coefficients that have minor impact on final results, thereby greatly enhancing computational speed and reducing storage burdens. Rather than dropping these coefficients entirely (which can increase error owing to the cumulative effect of these coefficients), they may be replaced by a correction term which at least partially accounts for their collective impact.

Problems solved by technology

As examples, variations in manufacturing process parameters (such as variations in interconnect diameter, gate quality, etc.) can cause timing parameters to deviate from their designed value.
In low-power applications, lower supply voltages can cause increased susceptibility to noise and increased timing variations.
Densely integrated elements and non-ideal on-chip power dissipation can cause “hot spots” on a chip, which can also cause excessive timing variations.
However, this approach produces timing predictions that are often too pessimistic and grossly conservative.
While this will generally yield an accurate timing distribution, it is computationally extremely time-consuming, and is therefore often impractical to use.
Unfortunately, path-based STA has a computational complexity that grows exponentially with the circuit size, and thus it too is difficult to practically apply to many modern circuits.
With the two operators ADD and MAX, the computational complexity of block based STA grows linearly (rather than exponentially) with respect to the circuit size, which generally results in manageable computations.
Unfortunately, one flaw of block-based STA is that its underlying assumption of a simple linear (additive) combination of sequential path delays is often incorrect.
The underlying problem of global and path correlation is that while the output of the MAX operator can be directly approximated by a Gaussian distribution having its first two moments matching those of Equations (3) and (4), this approach fails to retain any correlation information after the MAX operation is performed.
Several approaches have been proposed for dealing with global and path correlation, but the field of timing analysis is lacking in methods for accounting for both of these correlations in an accurate and computationally efficient manner.
This approach is acceptable where no path reconvergence is present, or where global variation dominates the correlations in the timing graph, but it will have severe problems where path correlation is important—which is unfortunately a common situation.
While the purpose of the inclusion of an independent Gaussian random variable Δ is to ensure the matching of the covariance of to the output of the MAX operator Z, this parsimonious random variable may not accurately propagate correlation information, and thus may inadvertently introduce additional modeling error of the output pdf.

Method used


Image

  • Efficient statistical timing analysis of circuits
  • Efficient statistical timing analysis of circuits
  • Efficient statistical timing analysis of circuits

Examples


Embodiment Construction

.

[0029]Initially, Section 1 of the Detailed Description section describes how the nonlinear MAX operation can be approximated by a weighted linear mixing operator which performs a linear supposition of its inputs, and which has the moments of its output matched to those of the MAX operation. The preferred form of this operation is U=ρX+(1−ρ)Y+ζ, wherein X and Y are the inputs and ρ and ζ are constants chosen such that U has matching moments with Z=MAX(X,Y). Whereas Gaussian inputs to the MAX operator will result in a nonlinear / non-Gaussian output which lacks any information regarding correlation between the inputs, the linear mixing operator proposed here conveniently retains both linearity and correlation information, and it is therefore preferred for use in the steps / methods discussed below.

[0030]Section 2 of the Detailed Description then discusses how a modified version of the traditional canonical timing model, referred to herein as the Extended Canonical Timing Model, can be us...


PUM


Abstract

Statistical timing analysis methods for circuits are described which compensate for circuit elements having correlated timing delays with a high degree of computational efficiency. An extended canonical timing model is used to represent each delay element along a circuit path, wherein the model bears information regarding any correlations that each element has to any other elements in the circuit (and / or to any external global factors, e.g., global temperature variations over the circuit, etc.). The model can be represented in a vectorized format which allows enhancement of computational efficiency, wherein the coefficients of the vectors allow an objective measure of element correlation (and wherein the vectors can be “pruned” by dropping insignificant coefficients to further enhance computational efficiency). A decomposition procedure can be used to decompose correlated elements into uncorrelated elements to allow delays to me more easily propagated through the timing diagram representing the circuit. Finally, a bounded approximation for the output of the MAX operator is described which provides a safely conservative approximation regardless of the linearity of the MAX output.

Description

FIELD OF THE INVENTION[0001]This document concerns an invention relating generally to statistical timing analysis of integrated circuits.BACKGROUND OF THE INVENTION[0002]For integrated circuits (e.g., VLSI chips) to work properly, the signals traveling along their gates and interconnects must be properly timed, and several factors are known to cause timing variations. As examples, variations in manufacturing process parameters (such as variations in interconnect diameter, gate quality, etc.) can cause timing parameters to deviate from their designed value. In low-power applications, lower supply voltages can cause increased susceptibility to noise and increased timing variations. Densely integrated elements and non-ideal on-chip power dissipation can cause “hot spots” on a chip, which can also cause excessive timing variations.[0003]A classical approach to timing analysis is to analyze each signal path in a circuit and determine the worst case timing. However, this approach produces...

Claims


Application Information

Patent Timeline
Patent Type & Authority Patents(United States)
IPC IPC(8): G06F17/50G06F17/15G06F17/18
CPCG06F17/5031G06F30/3312
Inventor ZHANG, LIZHENGHU, YUHENCHEN, CHUN-PING
Owner ZHANG LIZHENG
Learn More