Methods and preparations for curing clinically ill patients
Inactive Publication Date: 2008-11-04
NOVO NORDISK AS
23 Cites 39 Cited by
AI-Extracted Technical Summary
Problems solved by technology
However, clinical signs are often absent and it remains an occult problem in many ICUs worldwide.
Nonetheless, it is an important clinical entity as it (is) a frequent cause of difficulty to wean patients from the ventilator and it leads to problems with rehabilitation after the acute illness has been treated and cured.
When CIPNP is severe enough, it causes limb weakness and reduced tendon reflexes.
Sensory impairment follows but is difficult to test in ICU patients.
In other words, the presence of CIPNP can delay the weaning and rehabilitation for weeks or months.
The resulting endoneural edema could induce hyp...
View moreBenefits of technology
[0036]Another object of the present invention is to reduce the likelihood of a critically ill patient and/or in a CIPNP patient having repetitive positive EMGs.
[0037]Another object of the present invention is to reduce the amount of red cell transfusion to a critically ill patient and/or to a CIPNP patient.
[0038]Another object of the present invention is to prevent or reduce the amount of ultimately futile intensive care to a critically ill pati...
View moreAbstract
This invention relates to a life saving medicament for critically ill patients and a method of treatment. The composition is a pharmaceutically effective amount of a blood glucose regulator which is used to control the blood glucose level.
Application Domain
Technology Topic
Image
Examples
- Experimental program(2)
Example
Example 1
Material and Methods
[0109]In a prospective clinical study, we tested the hypothesis that the incidence of CIPNP can be reduced by more strict metabolic using intensive insulin treatment from admission onward. Between Feb. 2 and Apr. 25, 2000, 400 patients were included in the study. They had been randomly allocated to one of two insulin (Actrapid H M NovoLet of Novo Nordisk) treatment schedules: [0110] (1) insulin infusion started at a dose of 1 U/h only when blood glucose is >230 mg/dL (13 mmol/L) and titrated up (2 to 4 hourly controls of blood glucose levels) with increments of 0.5 to 1 U/h to keep blood glucose below this level [180-200 mg/dL (10.3-11.2 mmol/L)]. When blood glucose levels reach 180 mg/dL, insulin infusion is stopped. [0111] (2) insulin infusion started when blood glucose is >120 mg/dL (6.8 mmol/L) at a dose of 2 U/h and titrated up (2 to 4 hourly controls of blood glucose levels) with increments adequate to keep blood glucose levels normal and thus below this level [80-110 mg/dL (4.6-6.1 mmol/L)]. Maximal hourly insulin dose is set at 60 U per hour. When blood glucose levels reach 80 mg/dL, insulin infusion is tapered and eventually stopped until normal levels are again reached. During interruption of enteral tube feeding for determination of residual stomach content, insulin infusion is reduced proportionately to the reduction of caloric intake. [0112] (3) Concomitantly, patients were fed, on the admission day using a 20% glucose infusion and from day 2 onward by using a standardised feeding schedule consisting of normal caloric intake (25-35 Calories/kgBW/24 h) and balanced composition (20%-40% of the non-protein Calories as lipids & 1-2 g/kgBW/24 h protein) of either total parenteral, combined parenteral/enteral or full enteral feeding, the route of administration of feeding depending on assessment of feasibility of early enteral feeding by the attending physician. All other treatments, including feeding regimens, were according to standing orders currently applied within the ICU.
Exclusion criteria were age <18y, pregnancy and not being intubated at admission.
[0113]When patients were still treated in the ICU after 7 days, a weekly EMG examination was performed to screen for the presence of CIPNP. The EMGs were always interpreted by the same expert in electrophysiology. In order to accurately assess ICU stay, which is often determined by other factors than the patient's condition—e.g. bed availability on the wards—“end of ICU stay” was defined as the day on which the attending physician considers the patient to be “ready for discharge”.
Results
[0114]83 patients ended up being treated on the ICU for at least one week and were screened by EMG for the presence of CIPNP. In the group randomised into the “intensive insulin schedule”, 38 patients stayed for more than 7 days and in the group randomised into the “restrictive insulin schedule”, 45 patients stayed more than 7 days. Fifteen out of 38 long-stay ICU patients in the intensive insulin group (or 39% of the long stayers) revealed a positive EMG for CIPNP at any time during the ICU stay versus 30 out of 45 in the restrictive insulin group (or 67%) (P=0.01 with Chi-square). In the intensive insulin group, the mean+SD number of positive EMGs for CIPNP per patient was 0.9±1.8 (median of zero) versus 1.8±2.1 (median of 1) in the restrictive insulin group (P=0.015 with Mann-Whitney U test).
[0115]Long-stay patients in the intensive insulin group had a CIPNP-free time on the ICU of 2.1±1.8 weeks versus 1.1±1.2 weeks in the restrictive insulin group (P=0.004 with unpaired Student's t-test).
[0116]ICU-mortality was not detectably different between the two treatment groups (P=0.4).
Conclusions
[0117]This study revealed that strict metabolic control with intensive insulin treatment and clamping of blood glucose levels within normal limits significantly reduces the incidence of CIPNP and lengthens the time free of CIPNP in patients that do develop this problem. This is the first study to point to a preventive strategy for this frequently occurring and important problem in ICU patients. Since the presence of EMG-proven CIPNP has been shown to extend the need for ICU support and to prolong the time required for rehabilitation, this treatment will lead to a reduction in need for ICU support and to a shorter time for rehabilitation, which could reflect a major reduction in costs.
Example
Example 2
A Prospective, Randomized, Controlled Study was Performed
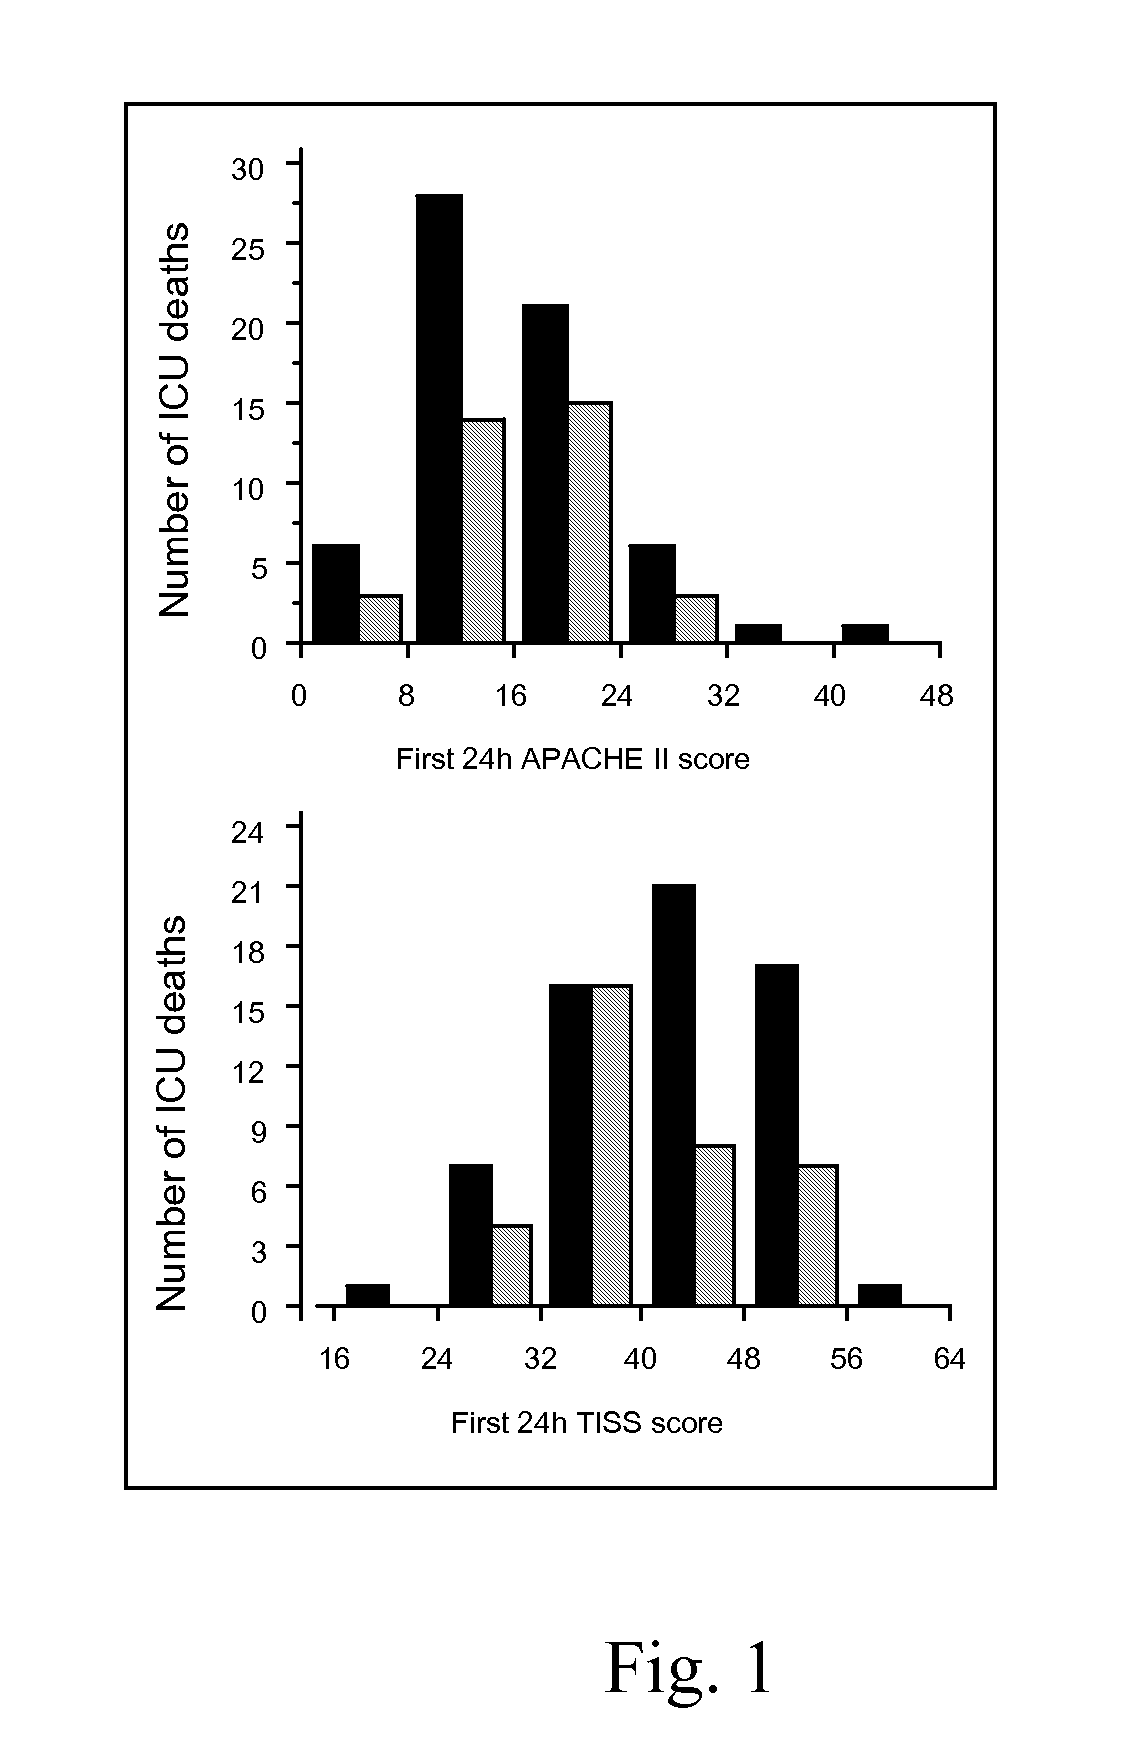
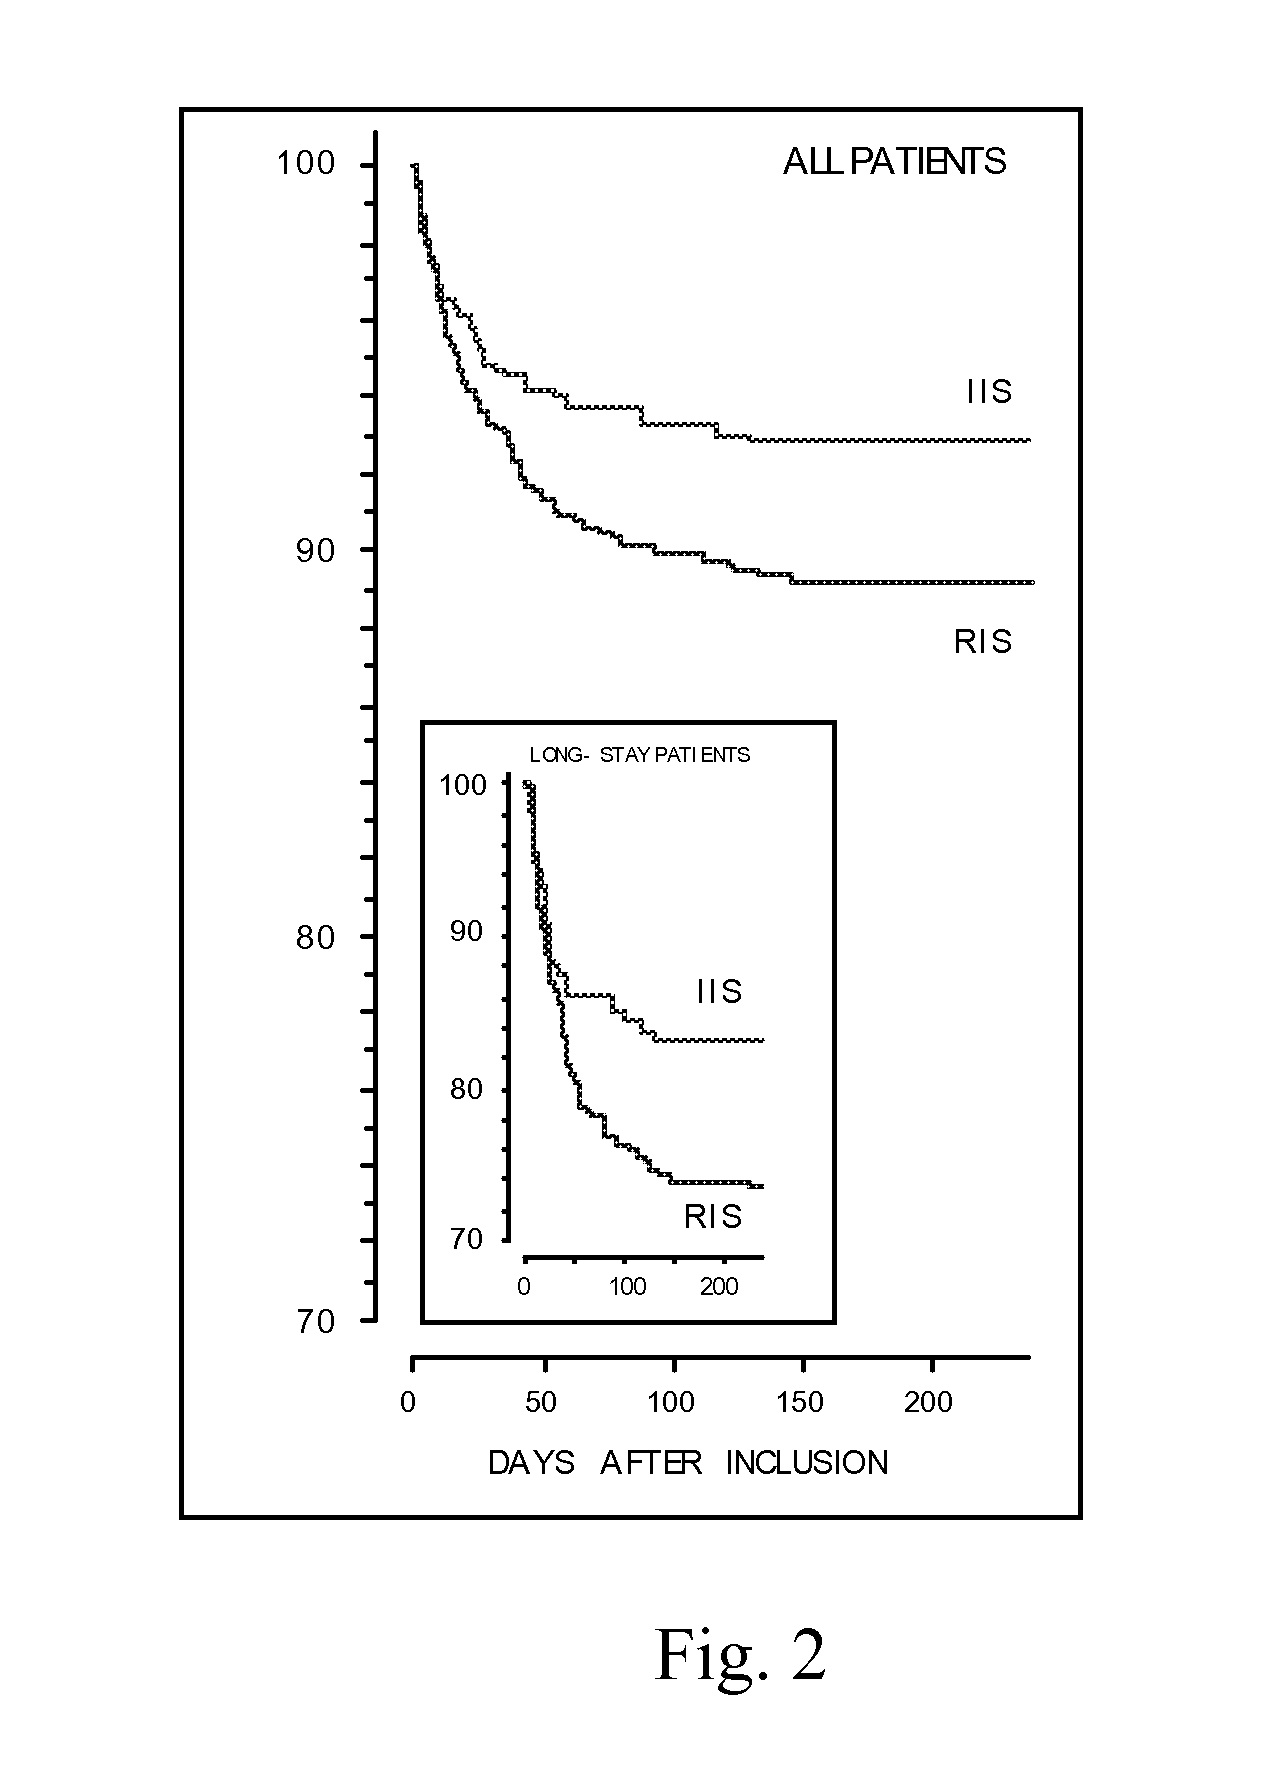
[0118]All mechanically ventilated, adult patients admitted to the intensive care unit (ICU) were eligible for inclusion. Only 5 patients participating in another trial and 9 who were moribund or DNR coded at ICU admission were excluded. At admission, patients were randomized to either strict normalization of glycemia (4.5-6.1 mmol/L) with continuously infused insulin during intensive care, the ‘intensive insulin schedule’ (IIS), or the currently used ‘restrictive insulin schedule’ (RIS), with insulin started when blood glucose exceeds 12 mmol/L in which case glycemia is clamped to 10-12 mmol/L. An interim safety analysis revealed a difference in mortality, and the study was ended for ethical reasons.
Results
[0119]A total of 1548 patients were included, 765 in the IIS group, 783 in the RIS group, well matched at inclusion. IIS reduced ICU mortality by 43% (P=0.005) [63 deaths in the RIS group versus 35 in the IIS group; death odds ratio for IIS, corrected for all baseline univariate predictors of ICU death, was 0.52 (0.33-0.82), P=0.004] and hospital mortality by 34% (P=0.01). Mortality reduction occurred exclusively in long-stay ICU patients and was due to prevention of death from multiple organ failure with sepsis. IIS also reduced the incidence of blood stream infections, renal failure, anemia and critical illness polyneuropathy as well as the need for dialysis or hemofiltration, red cell transfusion, prolonged mechanical ventilatory support and intensive care.
Conclusion
[0120]The data suggest that disturbances in glucose metabolism during critical illness are not “adaptive and beneficial” since strict metabolic control with exogenous insulin substantially reduces morbidity and mortality.
[0121]More detailed, the study was as follows:
Study Population
[0122]All mechanically ventilated, adult (age>18y) patients admitted to our 56-bed, mainly surgical, ICU from Feb. 2, 2000 onward were considered eligible for inclusion. Only 5 patients taking part in other outcome trials and 9 who were moribund or “do not resuscitate”—coded at ICU admission were excluded. Informed consent was obtained from the closest family member. The study protocol was approved by the Institutional Review Board of the Catholic University of Leuven School of Medicine.
[0123]Study design and treatment protocols: t ICU admission, patients were randomized to either strict control of glycemia below 6.1 mmol/L (110 mg/dL) with continuously infused insulin, the ‘intensive insulin schedule’ (IIS), or the currently used ‘restrictive insulin schedule’ (RIS), with insulin started when blood glucose exceeds 12 mmol/L (215 mg/dL). In the RIS group, intravenous insulin drip, consisting of 50 IU insulin (Actrapid HM®, Novo Nordisk, Denmark) in a 50 mL NaCl 0.9% containing PERFUSOR® syringe driven by a Perfusor FM® pump (B. Braun, Melsungen, Germany), was initiated at 1 IU/h. By 2-4 hourly measurements of whole blood glucose levels in undiluted arterial blood samples using the ABL700 analyser (Radiometer Medical A/S, Copenhagen, Denmark), insulin dose was adjusted to clamp glycemia between 10-12 mmol/L.
[0124]In the IIS group, insulin drip was started at 2 lU/h when blood glucose exceeded 6.1 mmol/L. By 2-4 hourly measurements—and in case of difficult control by hourly measurements—of blood glucose levels, insulin dose was adjusted to clamp glycemia between 4.5-6.1 mmol/L. Maximal dose of insulin was arbitrarily set at 50 U/h. At ICU discharge, a restrictive insulin schedule was adopted (glycemia≦12 mmol/L) to avoid hypoglycemia in the less well controlled setting of a regular ward.
[0125]Consecutive patients were randomly assigned to one of these two treatment groups using blinded envelopes, stratified according to type of critical illness diagnosed on admission [(a) neurological disease, cerebral trauma or surgery; (b) cardiac surgery; (c) thoracic surgery and/or respiratory insufficiency; (d) abdominal surgery/peritonitis; (e) vascular surgery; (f) multiple trauma or severe burns: (g) organ transplantation; (h) others, mainly extensive oncological procedures] and balanced with the use of permuted blocks of ten.
[0126]All patients were fed continuously, on admission with mainly intravenous glucose (200-300 g/24 h) and from the next day onward with a standardised feeding schedule aiming for a caloric content up to 20-30 non-protein Calories/kg/24 h and a balanced composition (0.13-0.26 g nitrogen/kg/24 h and 20%-40% of non-protein Calories as lipids) of either total parenteral, combined parenteral/enteral or full enteral feeding, the latter mode attempted as early as possible. Other comcomitant ICU therapy was left to the discretion of attending physicians.
Baseline Assessment and Data Collection
[0127]At baseline, demographic, diagnostic and therapeutic information as well as information necessary to determine severity of illness and utilization of ICU resources were obtained from each patient (Table 1). These included APACHE-II (Acute Physiology and Chronic Health Evaluation) score with higher values indicating more severe illness (see Knaus) and simplified Therapeutic Intervention Scoring System (TISS-28) with higher values indicating a higher number of therapeutic interventions (see Reis Miranda & Keene). APACHE II and TISS scores were calculated daily from ICU admission to discharge or death.
[0128]The ‘on-admission’ APACHE II score was calculated from data gathered during 24 h after admission to the ICU and omitted values from stabilization in the emergency department or recovery room prior to transfer. Because of ICU bed shortage, this period outside ICU often took more than 24 h which caused a substantial treatment effect and thus lowered APACHE II scores. Moreover, zero points were usually assigned for the neurological evaluation section (Glasgow Coma Score, with higher values indicating more impaired consciousness) as the majority of patients were sedated upon ICU admission which makes correct consciousness scoring impossible. This approach is the most consistent and objective but inevitably reduces APACHE II (see Knaus).
[0129]A blood sample was taken upon ICU admission and daily at 06:00 h until discharge from ICU or death. On-admission and daily morning, whole blood glucose level as well as daily maximal and minimal glycemia were analysed. Analyses on the 06:00 h sample also included clinical chemistry, hematology and markers of inflammation.
[0130]Blood cultures were taken whenever continously monitored central body temperature acutely rose above 38.5° C. Results from all blood cultures were interpreted by the same blinded investigator. An episode of bacteremia, fungemia or mycobacteremia was defined by the first positive blood culture in a series. To identify a blood stream infection with coagulase-negative staphylocci, identical strains (compared by antibiogram) of microorganisms in two or more positive blood cultures were required (see Weinstein 1997 and Weinstein 1998).
[0131]In patients treated in ICU for more than one week, a weekly electromyography (EMG) was performed to screen for Critical Illness Polyneuropathy. EMGs were interpreted by the same electrophysiologist who was blinded for randomization. In case of ICU death, a post-mortem examination was performed to confirm the presumed cause of death. The pathologists were also blinded for the insulin treatment schedule.
Outcome Measures:
[0132]The primary outcome measure was death from all causes during intensive care. Secondary outcome measures were in-hospital mortality, incidence of prolonged intensive care dependency and need for ICU re-admission, need for vital organ system support comprising mechanical ventilatory support, renal replacement therapy (continuous or intermittent hemofiltration or dialysis), inotropic or vasopressor support, incidence of critical illness polyneuropathy, the degree of inflammation, incidence of blood stream infections and use of antibiotics, transfusion requirements and incidence of hyperbilirubinemia. Furthermore, use of intensive care resources was analysed by cumulative TISS scores. In order to accurately and objectively assess duration of ICU stay, which is often influenced by non-patient related factors such as bed availability on regular wards, patients were defined ‘dischargable from ICU’ when they were no longer in need of vital organ system support and received at least ⅔rd of the caloric need through the normal enteral route or earlier when actually sent to a ward.
Statistical Analysis:
[0133]We hypothesized to detect a difference in mortality selectively in long-stay (>5 days) critically ill patients. Since prolonged ICU stay is not predictable at ICU admission, and since we aimed at treatment from admission onward, we chose to include all mechanically ventilated patients admitted to the ICU, without selection. We estimated that inclusion of 2500 admissions would be needed to rule out an absolute difference in mortality of ±5% in the long-stay cohort which would translate in an absolute risk reduction of ±2% for overall ICU mortality (2-sided alfa level of <0.05). Three-monthly interim analyses of overall ICU mortality were performed with stopping bounderies (with a 2-sided alfa-level of <0.01) designed to allow early study termination if one of the intervention groups was found to be clearly inferior. Interim analysis after one year of study revealed a significantly higher number of deaths in the RIS group, after which the study was ended for ethical reasons. All analyses were done on intention to treat basis.
[0134]Baseline and outcome variables were compared using Student's t-test, Chi-square test and Mann-Whitney-U test, as appropriate. Death odds ratios were calculated using multivariate logistic regression analysis. The effect on time of in-hospital death was assessed by Kaplan-Meier analysis and logrank (Mantel-Cox) significance testing. Patients discharged from the hospital were considered as survivors. Data are presented as percentages, means ±SD or medians (25th-75th percentile) unless indicated otherwise.
Results
Study Population:
[0135]The study involved 1548 patients, 783 in the RIS group and 765 in the IIS group, well matched at randomization (Table 1) although IIS patients tended to be slightly older and more obese compared with RIS patients.
[0136]A history of diabetes was present in 13.2% of patients, 4.6% treated with subcutaneous insulin injections, 8.6% receiving oral anti-diabetic treatment. On ICU admission, 74.6% of patients revealed glycemia higher than normal when compared with overnight fasted reference values (≧6.1 mmol/L) and 56% had a blood glucose level higher than the fasted diabetes threshold (≧7 mmol/L). Only 11.7%, however, revealed an on-admission glycemia in the non-fasting diabetes range (≧11 mmol/L). A non-fasting “diabetic” glycemia on ICU admission did not correlate well with having a history of diabetes, as only 19.6% of the known diabetics revealed a blood glucose level on ICU admission ≧11 mmol/L. The two study groups were comparable for diabetes diagnosed before ICU admission and for incidence of on-admission hyperglycemia (Table 1).
Glycemia Control:
[0137]Mean and maximal amount of non-protein Calories per patient (not including the first and last day of ICU stay) was 19±7 kCal/kg/24 h and 24±10 kCal/kg/24 h, respectively. Mean and maximal amount of dietary nitrogen was 0.14±0.06 gN/kg/24 h and 0.19±0.08 gN/kg/24 h, respectively. Daily amounts and composition of the feeding regimens were comparable in the two groups.
[0138]In the IIS group, 99% of patients required exogenous insulin, a need which persisted for the entire duration of ICU stay (Table 2). Glycemia was well controlled with mean morning levels of 5.8±1.0 mmol/L. Only 0.1% of IIS patients had blood glucose levels that failed to go below 6.1 mmol/L within 48 h, 48% never exceeded 6.1 mmol/L after treatment initiation and only 17% occasionally peaked over 8.4 mmol/L. Mean morning glycemia in the RIS group was 8.5±1.8 mmol/L. Only 39% of RIS patients actually received insulin and those revealed a mean morning glycemia of 9.6±1.8 mmol/L in contrast to 7.8±1.4 mmol/L in the non-insulin requiring RIS patients.
[0139]In 39 IIS-treated patients, glycemia transiently fell below 2.3 mmol/L versus 6 patients in the RIS group. Such an event of hypoglycemia was always quickly corrected and never induced serious symptoms such as hemodynamic deterioration or epilepsia.
Mortality Outcome (Tables 3 & 4; FIGS. 1 & 2)
[0140]In the IIS group, 35 patients (4.6%) died during intensive care versus 63 (8.1%) in the RIS group (P=0.005), a relative risk reduction (RRR) of 43% (Table 3). The “numbers needed to treat” (NNT) to save one life during intensive care was 29. The impact on ICU mortality by IIS was independent of the first 24 h-APACHE II and TISS scores (FIG. 1). The intervention effect was also similar in patients after cardiac surgery and those suffering from other types of critical illness. ICU mortality among the RIS patients actually receiving insulin was 12.4% versus 5.2% among those not requiring insulin to keep glycemia below 12 mmol/L (P=0.0003).
[0141]Since we hypothesized a difference in mortality among long-stay ICU patients, we sub-analysed the effect in patients with an ICU stay of ≦5 days and in those staying >5 days. First 24 h-APACHE II score of patients staying ≦5 days was a median 9 (IQR 6-12) and 75% of them were patients after cardiac surgery. Median first 24 h-APACHE II in patients staying >5 days was 12 (8-15) and 68% were suffering from a non-cardiac surgery type of critical illness. The number of patients with an ICU stay of >5 days was not statistically different in the IIS (27%) and RIS (31%) groups (P=0.1). Mortality of patients staying ≦5 days was similar in IIS and RIS groups. Hence, the reduction in ICU mortality by IIS occurred selectively in the prolonged critically ill cohort with an absolute and relative risk reduction of 9.6% and 47%, respectively, and one life saved for every 11 treated long-stay patients.
[0142]All on-admission risk factors for ICU mortality were determined using univariate analysis. These comprised the first 24 h-APACHE II score, age, a non-cardiac surgery type of critical illness, tertiary referral, history of malignancy, and on-admission blood glucose level ≧11 mmol/L. These factors were subsequently entered into a multivariate logistic regression model together with the randomized insulin schedule (Table 4). This revealed that the independent risk factors for mortality were the first 24 h-APACHE II score, age, a noncardiac surgery type of critical illness, tertiary referral and insulin treatment schedule. The death odds ratio for IIS, corrected for other baseline univariate predictors of ICU death, was 0.52 (95% confidence intervals 0.33-0.82). Analysis of the causes of death during intensive care revealed that IIS particularly reduced the risk of death from multiple organ failure with a proven septic focus on post-mortem examination (Table 3).
[0143]IIS also significantly reduced total in-hospital mortality from 10.8% to 7.1% (P=0.01), a relative risk reduction of 34% (Table 3, FIG. 2). Again, this benefit was limited to the prolonged critically ill cohort.
Morbidity Outcome (Table 5)
[0144]IIS reduced duration of ICU stay whereas in-hospital stay was not detectably different between the two study groups. ICU re-admission rate was 2.1% and similar in both groups. In the IIS group, significantly less patients required prolonged mechanical ventilatory support and renal replacement therapy compared with the RIS group, whereas the need for inotropic or vasopressor support was identical. Independent of renal replacement therapy, kidney function parameters were more disturbed in the RIS group. The incidence of hyperbilirubinemia was significantly lower in the IIS group.
[0145]There was a 46% reduction in blood stream infections. Moreover, markers of inflammation were less disturbed and prolonged use of antibiotics (>10 days) less often required in the IIS group. The latter was largely attributable to the effect on bacteremia (75% of bacteremic patients were treated with antibiotics for >10 days versus 10% of non-bacteremic patients; P<0.0001). Mortality tended to be lower in bacteremic IIS patients (12.5%) compared with bacteremic RIS patients (29.5%; P=0.067). There was no difference between the two groups in the use of ICU drugs other than insulin or antibiotics.
[0146]Patients with an ICU stay of more than 1 week were screened weekly for critical illness polyneuropathy. Firstly, due to the effect on ICU stay, less IIS patients were screened. Secondly, among the screened patients in the IIS group, less revealed a positive EMG compared with the RIS group. Among screened patients, the NNT to prevent critical illness polyneuropathy in one patient was 4. Furthermore, critical illness polyneuropathy resolved more rapidly in the IIS group, as indicated by a lower fraction of patients with repetitive positive EMGs on the weekly screenings.
[0147]The use of aminoglycosides and glucocorticoids were determinants of critical illness polyneuropathy by univariate analysis. However, when entered into a multivariate logistic regression model together with other univariate predictors, the only independent determinants of critical illness polyneuropathy remained restrictive insulin schedule [or of 2.6 (1.6-4.2); P=0.0002], >3 days vasopressor treatment [or of 2.5 (1.4-4.2); P=0.001], acquiring a blood stream infection [or of 2.3 (1.3-4.1); P=0.006] and receiving renal replacement therapy [or of 1.9 (1.0-3.8); P=0.05].
[0148]When the risk of critical illness polyneuropathy was evaluated in both study groups as function of the actual mean glycemia per patient, a positive, linear correlation was obtained.
[0149]The amount of red cell transfusions in IIS patients was only half that of RIS patients. This was not due to a more liberal transfusion strategy in RIS patients as indicated by their lower levels of hemoglobin and hematocrit (Table 5).
[0150]The cumulative TISS score is an indicator of the number of therapeutic interventions per patient and per ICU stay (see Reis Miranda). There was a 20% reduction in median cumulative TISS score selectively in long-stay patients. In view of a comparable TISS score on the last day of study [median of 30 (26-38) in both study groups], this difference reflects a 20% reduction in costs per long-stay ICU patient (see Reis Miranda).
Discussion
[0151]In this large prospective, randomized, controlled study of intensive care-dependent critically ill patients, tight glycemic control below 6.1 mmol/L with insulin reduced ICU mortality by 43% and in-hospital mortality by 34%. Strict metabolic control also substantially improved morbidity by preventing blood stream infections, renal failure, anemia, critical illness polyneuropathy and need for prolonged support of failing vital organ systems. These striking benefits were independent of the type and severity of underlying disease.
[0152]The beneficial effects on morbidity can be summarized as reducing the risk of several key problems in intensive care. These include acquiring severe infections and ensuing inflammatory response, development of renal failure, cholestasis, anemia, critical illness polyneuropathy and muscle weakness. These problems perpetuate the need for intensive care which, in view of the high mortality of prolonged critical illness, often becomes futile.
[0153]In conclusion, the data suggest that disturbances in glucose metabolism in critically ill patients are not “adaptive and beneficial” since strict glycemic control during intensive care substantially reduces morbidity and mortality.
REFERENCES
[0154] Knaus: Knaus W A, Draper E A, Wagner D P, Zimmerman J E. APACHE II: A severity of disease classification system. Crit Care Med. 1985; 13:818-829. [0155] Reis Miranda: Reis Miranda D, de Rijck A, Schaufeli W. Simplifed Therapeutic Intervention Scoring System: the TISS-28 items—results from a multicenter study. Crit Care Med. 1996; 24: 64-73. [0156] Keene: Keene A R, Cukken D J. Therapeutic Intervention Scoring System: Update 1983. Crit Care Med. 1983; 11: 1-3. [0157] Weinstein 1997: Weinstein M P, Towns M L, Quartey S M, Mirrett S, Reimer L G, Parmigiani G, Reller L B. The clinical significance of positive blood cultures in the 1990s: a prospective comprehensive evaluation of the microbiology, epidemiology and outcome of bacteremia and fungemia in adults. Clin Infect Dis. 1997; 24: 584-602. [0158] Weinstein 1998: Weinstein M P, Mirrett S, Van Pelt L, McKinnon M, Zimmer B L, Kloos W, Reller L B. Clinical importance of identifying coagulase-negative staphylocci isolated from blood cultures: evaluation of microscan rapid and dried overnight gram-positive panels versus a conventional reference method. J Clin Microbiol. 1998; 36: 2089-2092.
[0159] TABLE 1 BASELINE PATIENT CHARACTERISTICS R I S I I S P-value N 783 765 Male gender (% of patients) 71 71 0.9 Age (y) (mean ± SD) 62.2 ± 13.9 63.4 ± 13.6 0.08 BMI (kg/m{circumflex over ( )}2) (mean ± SD) 25.8 ± 4.7 26.2 ± 4.4 0.1 Diagnostic group (total no.-%) cardiac surgery 493 (63%) 477 (62%) 0.8 other types of critical illness 290 (37%) 288 (38%) neurological disease, cerebral 30 (4%) 33 (4%) trauma or surgery thoracic surgery and/or respiratory 56 (7%) 66 (9%) insufficiency abdominal surgery/peritonitis 58 (7%) 45 (6%) vascular surgery 32 (4%) 30 (4%) multiple trauma or severe burns 35 (4%) 33 (4%) transplantation 44 (6%) 46 (6%) others 35 (5%) 35 (5%) APACHE II score (median & IQR) during the first 24 h 9 (7-13) 9 (7-13) 0.4 during the second 24 h 9 (6-13) 9 (6-13) 0.8 First 24 h APACHE II score 458 (51%) 429 (48%) 0.3 □ 9 (total no.-%) TISS score (median & IQR) during the first 24 h 43 (36-47) 43 (37-46) 0.7 during the second 24 h 38 (32-44) 38 (31-43) 0.4 Tertiary referral (% of patients) 17% 17% 0.7 History of malignancy 15% 16% 0.7 (% of patients) History of diabetes (% of patients) 13% 13% 0.9 On admission blood glucose 76% 73% 0.1 □ 6.1 mmol/L (% of patients) On admission blood glucose 12% 11% 0.2 □ 11 mmol/L (% of patients) APACHE denotes Acute Physiology and Chronic Health Evaluation. Higher APACHE II scores reflect more severe critical illness. First 24 h-APACHE II scores were artificially lowered by treatment effect and by assuming normal consciousness in sedated patients. TISS denotes Therapeutic Intervention Scoring System, with each therapeutic intervention being assigned 1 to 4 points. An increasing score represents increasing intensity of treatment. The sum of points is calculated daily for each patient. P-values were obtained using Student's t-test, Mann-Whitney-U test and Chi-square test, when appropriate.
[0160] TABLE 2 GLYCEMIA CONTROL R I S I I S (N = 783) (N = 765) P-value Patients receiving insulin- 307 (39%) 755 (99%) <0.0001 total no. (%) Mean daily insulin dose, when 33 (17-56) 71 (48-100) <0.0001 given (IU/d) (median-IQR) Duration of insulin 67 (40-100) 100 (100-100) <0.0001 requirement (% of ICU stay) (median-IQR) Mean 06:00 h blood glucose 8.5 ± 1.8 5.7 ± 1.0 <0.0001 level (mmol/L) (mean ± SD) Mean 06:00 h blood glucose 9.6 ± 1.8 5.7 ± 1.0 <0.0001 level when on insulin (mmol/L) (mean ± SD) P-values were obtained using Student's t-test, Mann-Whitney-U test and Chi-square test, when appropriate.
[0161] TABLE 3 MORTALITY ANALYSIS R I S I I S RRR P- Outcome measure (N = 783) (N = 765) (%) N N T value ICU deaths - total no. (%) 63 (8.1%) 35 (4.6%) 43 29 0.005 Death Odds Ratio corrected for other baseline risk factors (95% CI) 0.52 (0.33-0.82) 0.004 ICU deaths in acute vs. prolonged critical illness ICU deaths among patients staying 5 days - total no. (%) 14 (2.6%) 13 (2.3%) = 0.8 ICU deaths among patients staying >5 days - total no. (%) 49 (20.2%) 22 (10.6%) 47 11 0.005 ICU deaths per on-admission diagnostic group Cardiac surgery - total no. (%) 25 (5%) 10 (2%) Other types of critical illness - total no (%) 38 (13.1%) 25 (8.7%) Neurological disease, cerebral trauma or surgery - total no. (%) 7 (23.3%) 6 (18.1%) Thoracic surgery and/or respiratory insufficiency - total no. (%) 10 (17.9%) 5 (7.8%) Abdominal surgery/peritonitis - total no (%) 9 (15.5%) 6 (13.3%) Vascular surgery - total no. (%) 2 (6.3%) 2 (6.6%) Multiple trauma or severe burns - total no. (%) 3 (8.6%) 4 (12.1%) Transplantation - total no (%) 1 (2.3%) 2 (4.3%) Others - total no (%) 6 (17.1%) 0 (0%) Causes of death during intensive care -- total no 0.02 Multiple organ failure with proven septic focus 33 8 Multiple organ failure, no detectable septic focus 18 14 Severe brain damage 5 3 Cardiogenic shock 7 10 In-hospital deaths - total no. (%) 85 (10.9%) 55 (7.2%) 34 27 0.01 In-hospital deaths among patients staying 5 days in ICU - total no. (%) 21 (3.9%) 20 (3.6%) = 0.8 In-hospital deaths among patients staying >5 days in ICU - total no. (%) 64 (26.3%) 35 (16.8%) 36 11 0.01 RRR denotes relative risk reduction. NNT denotes the number needed to treat to save one life. P-values were obtained using Chi-square test.
[0162] TABLE 4 Multivariate logistic regression analysis of all baseline univariate predictors of ICU death Parameter Odds Ratio 95% Cl P Age (1 added y) 1.03 1.01-1.05 0.002 APACHE II during first 24 h □ 9 4.92 2.48-9.78 <0.0001 A non-cardiac surgery type of 2.24 1.27-3.97 0.006 critical illness Tertiary referral 2.10 1.24-3.56 0.006 A history of malignancy 1.47 0.86-2.52 0.2 Admission hyperglycemia 1.66 0.96-2.87 0.07 □ 11 mmol/L Intensive Insulin Treatment (IIS) 0.52 0.33-0.82 0.004 APACHE denotes Acute Physiology and Chronic Health Evaluation. Higher APACHE II scores reflect more severe critical illness.
[0163] TABLE 5 MORBIDITY ANALYSIS R I S I I S RRR Outcome measure (N = 783) (N = 765) (%) N N T P-value ICU stay Days on ICU (median - IQR) ICU stay 5 days (N = 1097) 2 (2-3) 2 (2-3) 0.2 ICU stay >5 days (N = 451) 15 (9-27) 12 (8-20) 0.003 Patients requiring >7 days intensive care - total no (%) 206 (26.3%) 157 (20.5%) 22 17 0.007 Patients requiring >14 days intensive care - total no (%) 123 (15.7%) 87 (11.4%) 27 23 0.01 Patients requiring >21 days intensive care - total no (%) 74 (9.5%) 50 (6.5%) 32 33 0.03 Mechanical ventilatory support Days on mechanical ventilatory support (median - IQR) ICU stay 5 days (N = 1097) 1 (1-2) 1 (1-2) 0.9 ICU stay >5 days (N = 451) 12 (7-23) 10 (6-16) 0.006 Patients requiring >7 days ventilatory support - total no. (%) 175 (23.2%) 125 (16.9%) 27 16 0.003 Patients requiring >14 days ventilatory support - total no. (%) 93 (12.3%) 57 (7.7%) 37 22 0.003 Patients requiring >21 days ventilatory support - total no. (%) 62 (8.2%) 37 (5.0%) 39 31 0.01 Hemodynamics Patients on inotropic/vasopressor treatment - total no. (%) 586 (75%) 574 (75%) = 0.9 Renal function Peak plasma creatinine >2.5 mg/dL - total no. (%) 96 (12.2%) 69 (9.0%) 26 31 0.04 Peak plasma urea concentration >150 mg/dL - total no. (%) 88 (11.2%) 59 (7.7%) 31 29 0.02 Patients needing dialysis or CVVH - total no (%) 64 (8.2%) 37 (4.8%) 42 29 0.007 Liver function Patients with hyperbilirubinemia (peak bilirubin >2 mg/dL) - total no. (%) 209 (27%) 171 (22%) 19 20 0.04 Infection/Inflammation Patients with blood stream infections during intensive care - total no (%) 61 (7.8%) 32 (4.2%) 46 28 0.00 Patients treated with antibiotics for >10 days - total no. (%) 134 (17.1%) 86 (11.2%) 35 17 0.0009 3 days C-reactive protein level above 150 mg/L - total no. (%) 162 (21%) 119 (15%) 29 17 0.008 3 days white blood cell count 4000/μL or □12000/μL - total no. (%) 166 (21%) 121 (16%) 24 20 0.006 3 days central body temperature 36° C. or □38° C. - total no. (%) 206 (26%) 164 (21%) 19 20 0.02 Critical illness polyneuropathy Patients with critical illness polyneuropathy - total no. (% of EMG-screened) 110 (52%) 47 (29%) 44 4 <0.0001 Repetitive (>2) positive EMGs - total no (% of EMG screened) 39 (19%) 11 (7%) 63 8 0.001 Red cell transfusion requirement Number of patients requiring transfusion - total no (%) 243 (31%) 219 (29%) 0.3 Number of transfusions per patient (median - IQR) 2 (1-3) 1 (1-2) 0.0002 Lowest level of hemoglobin (g/dL) when transfused (median - IQR) 8.1 (7.6- 8.6) 8.3 (7.7-8.9) 0.02 Lowest level of hematocrit (%) when transfused (median - IQR) 0.25 (0.24-0.27) 0.26 (0.24- 0.27) 0.03 Cumulative TISS (median - IQR) ICU stay 5 days (N = 1097) 84 (67-111) 85 (68-115) 0.3 ICU stay >5 days (N = 451) 536 (329-956) 431 (271-670) 0.0008 RRR denotes relative risk reduction. NNT denotes the number needed to treat to prevent one patient from acquiring the studied complication. EMG denotes electromyography and CVVH continuous veno-venous hemofiltration. P-values were obtained using Mann-Whitney-U test and Chi-square test, when appropriate. The analysis of number of transfusions did not take the admission day into account.
Login to view more PUM
Property | Measurement | Unit |
Time | 86400.0 | s |
Density | 1.3 | kg / (m ** 3) |
Density | 0.6 | kg / (m ** 3) |
tensile | MPa | |
Particle size | Pa | |
strength | 10 |
Description & Claims & Application Information
We can also present the details of the Description, Claims and Application information to help users get a comprehensive understanding of the technical details of the patent, such as background art, summary of invention, brief description of drawings, description of embodiments, and other original content. On the other hand, users can also determine the specific scope of protection of the technology through the list of claims; as well as understand the changes in the life cycle of the technology with the presentation of the patent timeline. Login to view more.
Login to view more Similar technology patents
Methods and systems for generating a horizon for use in an advanced driver assistance system (ADAS)
ActiveUS20150300825A1Reduce likelihoodInstruments for road network navigationDigital data processing detailsReal-time computingDecision points
Owner:TOMTOM INT BV
Removable clip for beverage lid
Owner:MACKOVIC BASIC MIRIAM +3
Security methods and systems
ActiveUS20060242712A1Reduce likelihoodDigital data processing detailsAnalogue secracy/subscription systemsInternet privacyMachine-readable medium
Owner:APPLE INC
Electronic message distribution
ActiveUS6883014B1Reduce likelihoodSimplifies processing of distribution processMultiple digital computer combinationsOffice automationTelecommunicationsData library
Owner:ORACLE OTC SUBSIDIARY
Container having a base and a lid
InactiveUS20160368677A1Reduce likelihoodEnhance barrier propertyClosure capsTobacco devicesTobacco productEngineering
Owner:JT INT SA
Classification and recommendation of technical efficacy words
- Reduce amount
- Reduce likelihood
Integrating payment accounts and an electronic wallet
Owner:MICROSOFT TECH LICENSING LLC
Handpiece and horn for ultrasonic surgical instrument
Owner:STRYKER CORP
Magnetic positioning for inductive coupling
ActiveUS20090212637A1Enhance magnetic forceReduce amountNear-field transmissionBatteries circuit arrangementsRepulsion forceElectromagnetic field
Owner:PHILIPS IP VENTURES BV
Audio/video system and method utilizing a head mounted apparatus with noise attenuation
InactiveUS7124425B1Reduce amountTelevision system detailsGHz frequency transmissionLoudspeakerImage based
Owner:IMMERSION ENTERTAINMENT L L C
Patch-sized fluid delivery systems and methods
ActiveUS20070219480A1Reduce likelihoodOperational securityElectrotherapyFlexible member pumpsLoudspeakerMicrophone
Owner:DEKA PROD LLP
Method and apparatus for electronic commerce using a telephone interface
InactiveUS7376586B1Reduce likelihoodAutomatic exchangesBuying/selling/leasing transactionsWeb serverSpeech sound
Owner:MICROSOFT TECH LICENSING LLC
Stent delivery device and method
Owner:BOSTON SCI SCIMED INC
System and method for network vulnerability detection and reporting
ActiveUS7243148B2Reduce likelihoodMemory loss protectionError detection/correctionQuantitative assessmentVulnerability detection
Owner:MCAFEE LLC
Protecting against malicious traffic
InactiveUS20060212572A1Reduce likelihoodReduce bandwidth consumptionMultiple digital computer combinationsTransmissionTraffic volumeData pack
Owner:CISCO TECH INC