Ultrasonograph

a technology of ultrasonograph and sonic wave, which is applied in the field of ultrasonograph, can solve the problems of time and energy, difficult for doctors to determine the fine structure of such diagnostic portions, and difficult for doctors to diagnose the affected area of the image displayed,

Inactive Publication Date: 2009-01-27
HITACHI MEDICAL CORP
View PDF13 Cites 3 Cited by
  • Summary
  • Abstract
  • Description
  • Claims
  • Application Information

AI Technical Summary

Benefits of technology

[0019]The present invention was implemented, taking into consideration that if the echo signals are converted into digital signals and stored in the memory, the data of predetermined bits can be read out the echo signals. In other words, by discretionally setting the bit range (sensitivity range) of the read out echo signals with variability, it is possible to reconstruct the ultrasound images using the reflected echo signals of the necessary sensitivity range. Therefore by reading out the plurality of data of sensitivity range, it is possible to display the plurality of images by different sensitivity range on the monitor. By doing so it is possible not only to improve the compressibility ratio for displaying the ultrasound images on the monitor, but also to improve the image quality of displayed ultrasound images on the monitor, since it enables the display of image data and the dynamic range of the monitor to correspond with each other on a one-to-one basis by leveling out the readout-range to the dynamic range.
[0021]In this case, when a region of interest is set as a region for an observation, it is possible to read out the reflected echo signals corresponding to the region of interest from the memory and display the ultrasound images on the monitor. By doing so it is possible to improve the display frame rate of the ultrasound images, because only the reflected echo signals that corresponds to the region of interest are read out.
[0022]In the present invention, it is possible to reconstruct various ultrasound images with different sensitivity range by obtaining only one frame of the ultrasound images and storing the echo signals in the memory. Thus compared to conventional sensitivity grading tomography that repeats the operation for obtaining ultrasound images and shooting frames, it is possible to shorten the time for obtaining the ultrasound images. Also, because it enables easy regulation of the sensitivity range of the reflected echo signals read out from the memory in order to avoid the actualization of artifacts and so forth on the ultrasound images, it is possible to simplify the operation to obtain adequate ultrasound images for diagnosis.
[0024]Moreover, in order to facilitate comparative observation on the plurality of ultrasound images, it is possible to display the plurality of ultrasound images with different sensitivity range on the same screen at the same time. For example, it makes it possible to arrange the plurality of ultrasound images with different sensitivity range and display them on the monitor at the same time, or to superimpose the translucent ultrasound images with changed hue information over other ultrasound images and display them on the monitor. By doing so the examiner is able to execute comparative observation, without moving the eyes, to perform more precise diagnosis.
[0025]Moreover, in order to display the plurality of ultrasound images with different sensitivity range relating to the region of interest, when an input means to set the region of interest is provided on the displayed ultrasound images and the region of interest is set by the input means, it is possible to read out the reflected echo signals with different sensitivity range in the region of interest and to display the ultrasound images with different sensitivity range on the monitor. With this feature, it is possible to determine the fine structure of the region of interest precisely, as well as to improve the display frame rate of the ultrasound images.

Problems solved by technology

The difference in signal intensity of the echo signals derived from respective portions in the body organ structure such as a tumor of the liver, gall bladder and diaphragm are relatively small, thus the brightness difference are also small among the pixels that are forming ultrasound images of said organs, which often makes it difficult for the doctors to determine the fine structure of such diagnostic portions upon attempting ultrasonic diagnosis.
Meanwhile, in the case of displaying ultrasound images by compressing the dynamic range of echo signals such as in the conventional ultrasonic diagnostic apparatus, since there is a possibility that the structures which derive the echo signals of close sensitivity would have the same level of clarity on the screen, it is difficult for the doctors in diagnosing the affected area of the image displayed because of the unobservable difference in clarity level.
Hence it takes much time and energy to obtain the plurality of ultrasound images that have different sensitivity, causing the problem of not being able to execute an efficient diagnose.
Also, with conventional sensitivity graded tomography, since the overall sensitivity range of the obtained echo signals had to be displayed to a display dynamic range (display gradation sequence) on the monitor by compressing the range, differentiating echo signals with close sensitivity came along with difficulties.
Thus using said sensitivity grading tomography leaves a problem that the doctors are required to have advanced technique for regulating the apparatus.

Method used


Image

  • Ultrasonograph
  • Ultrasonograph
  • Ultrasonograph

Examples


embodiment 1

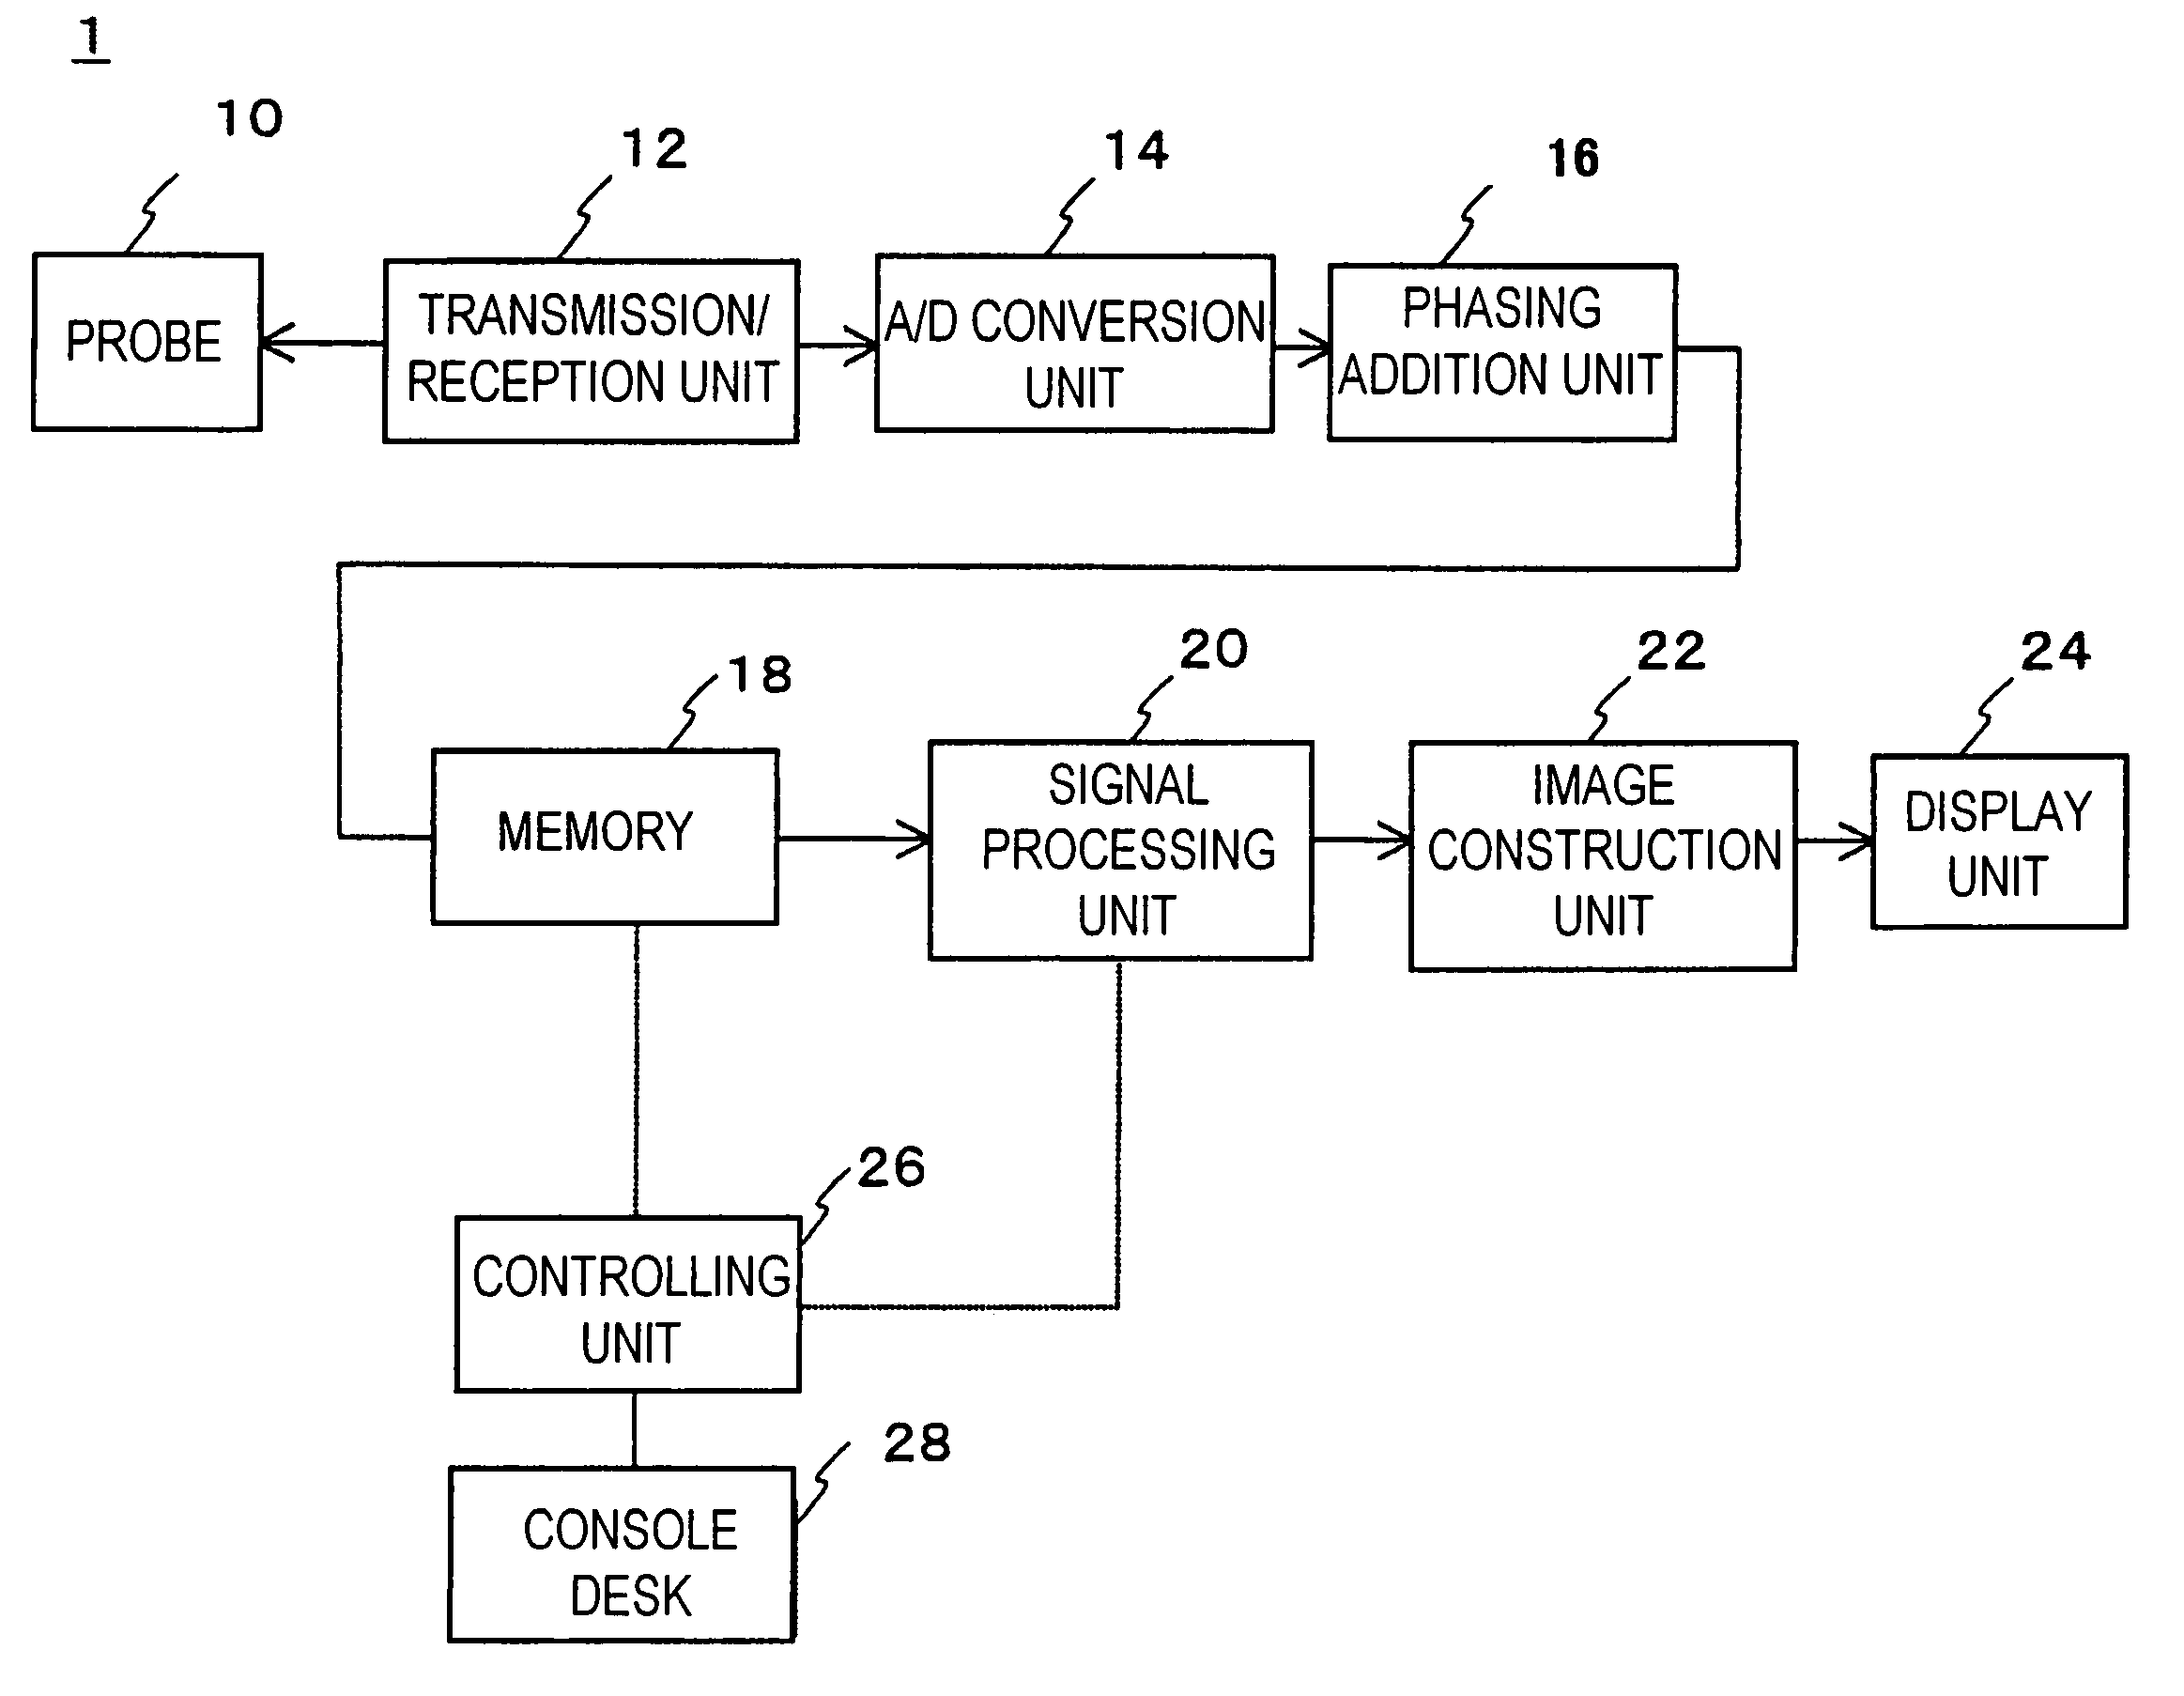
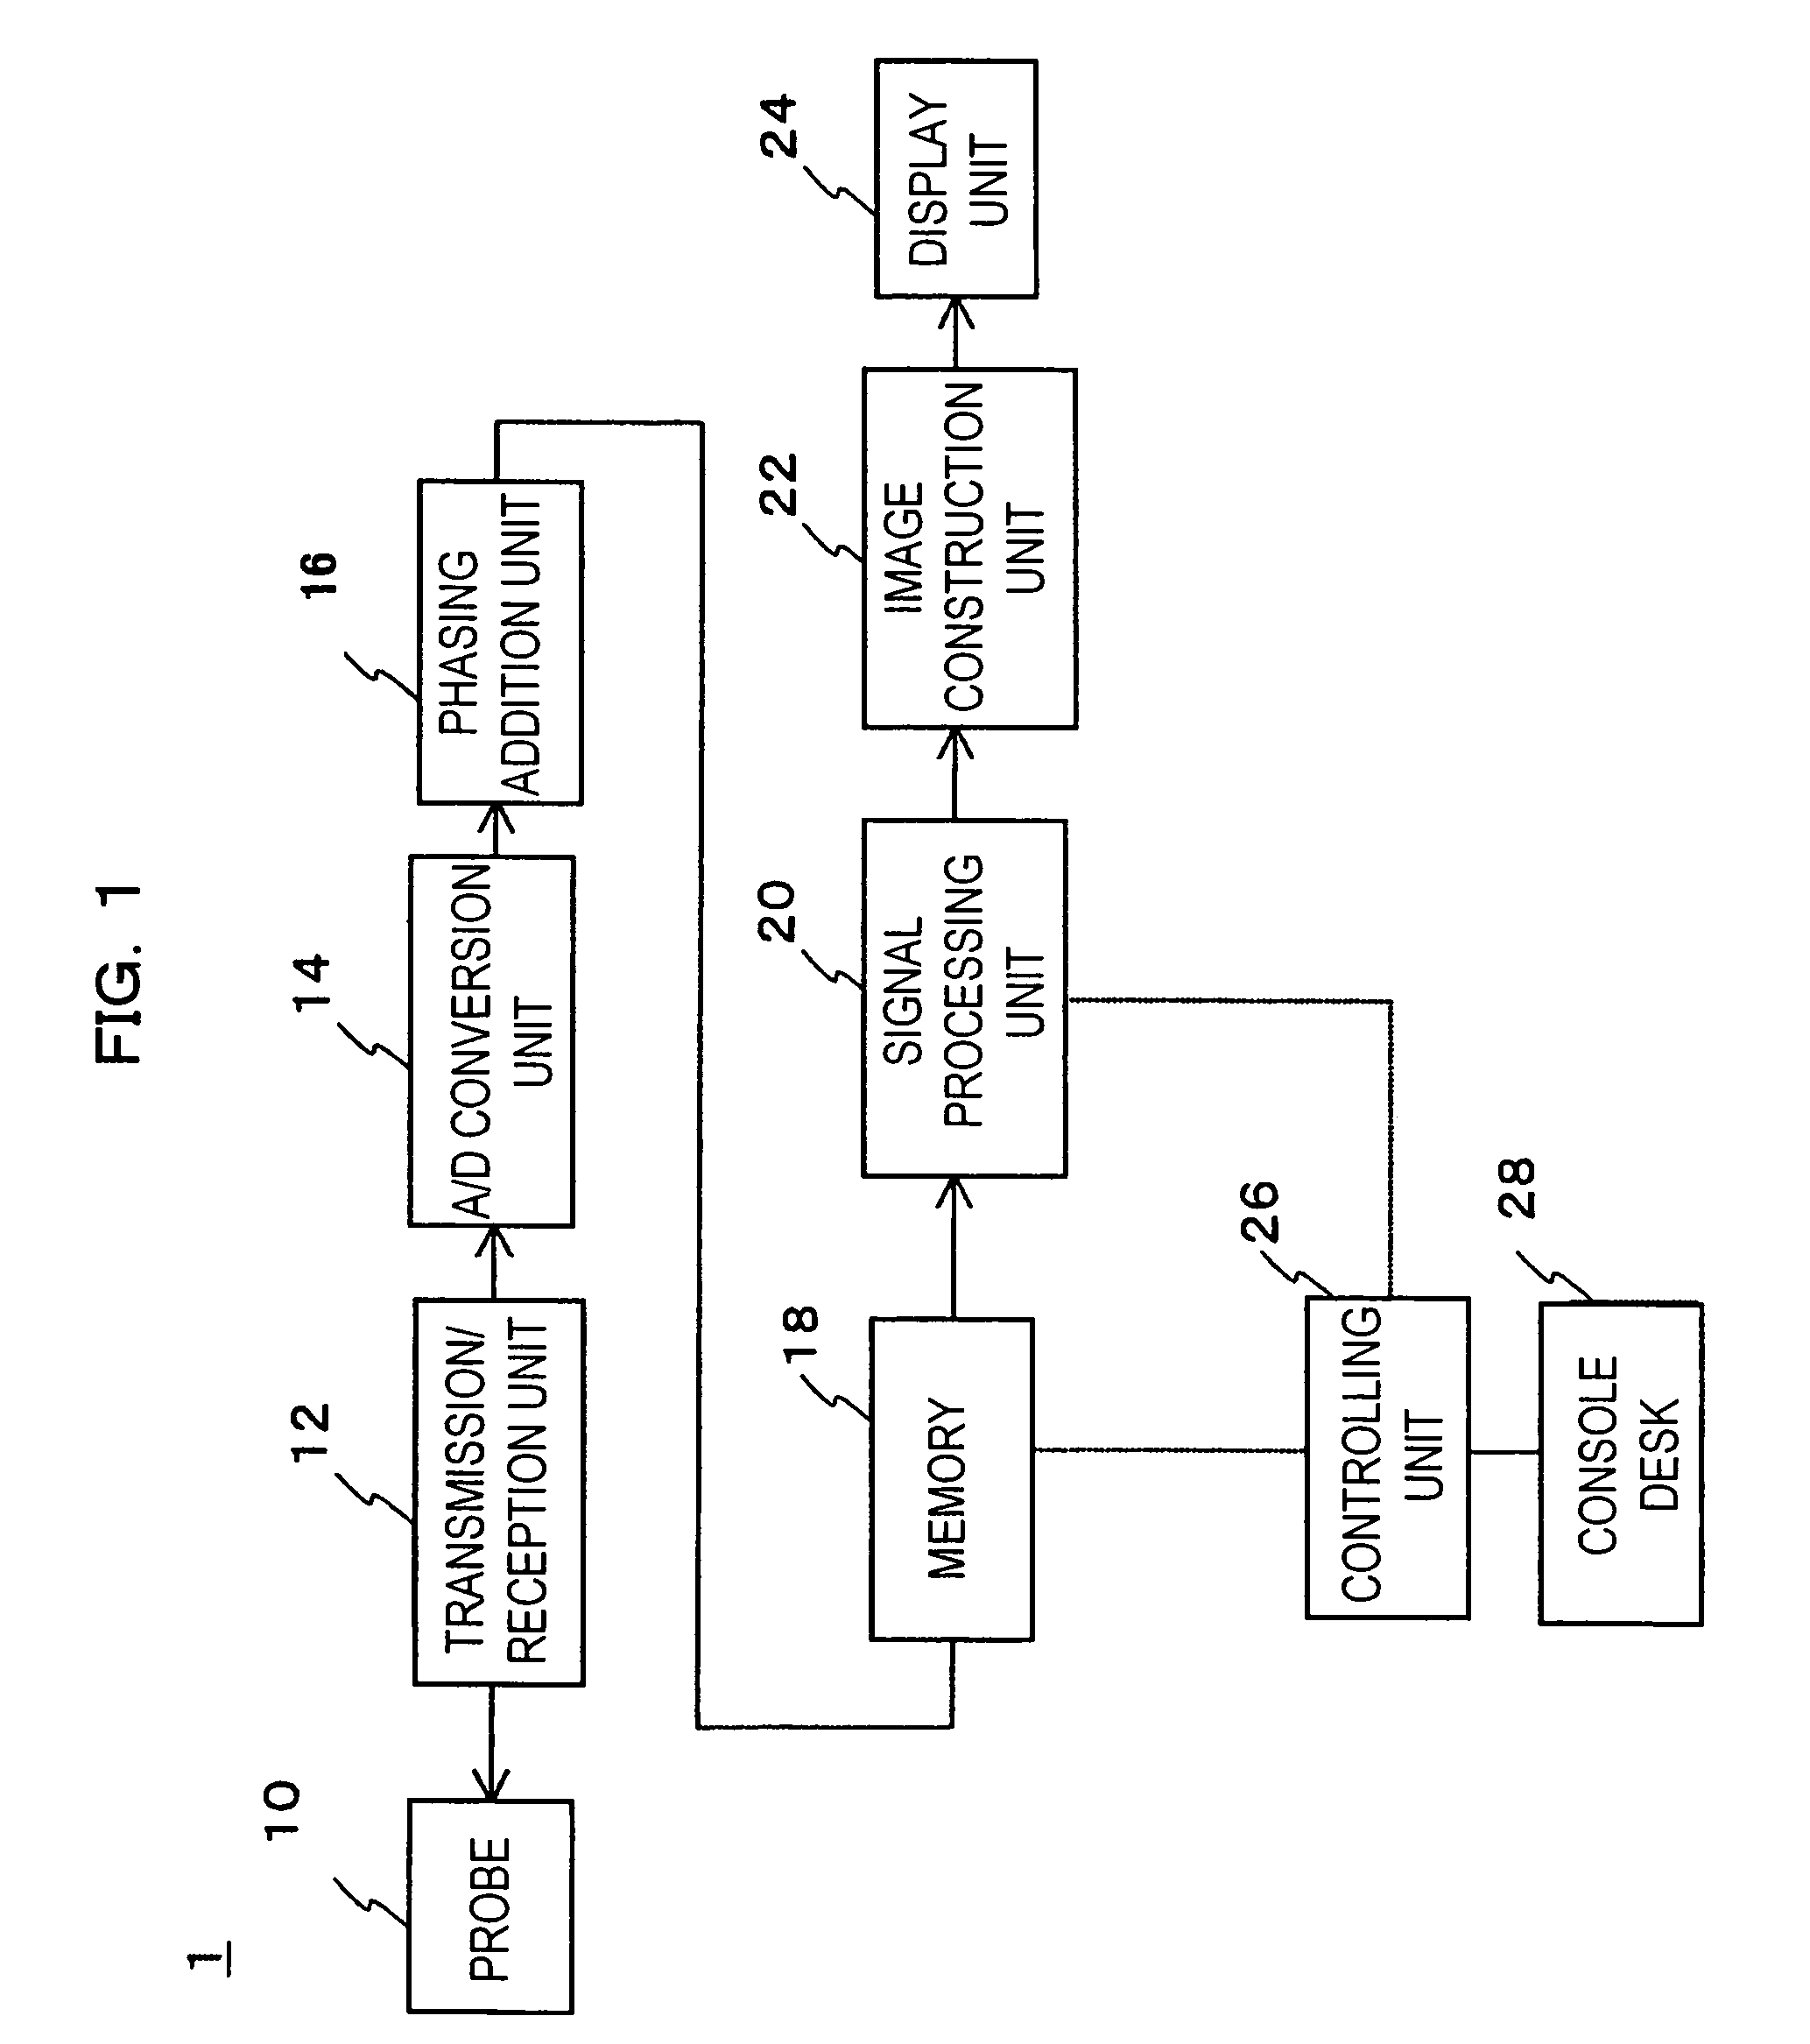
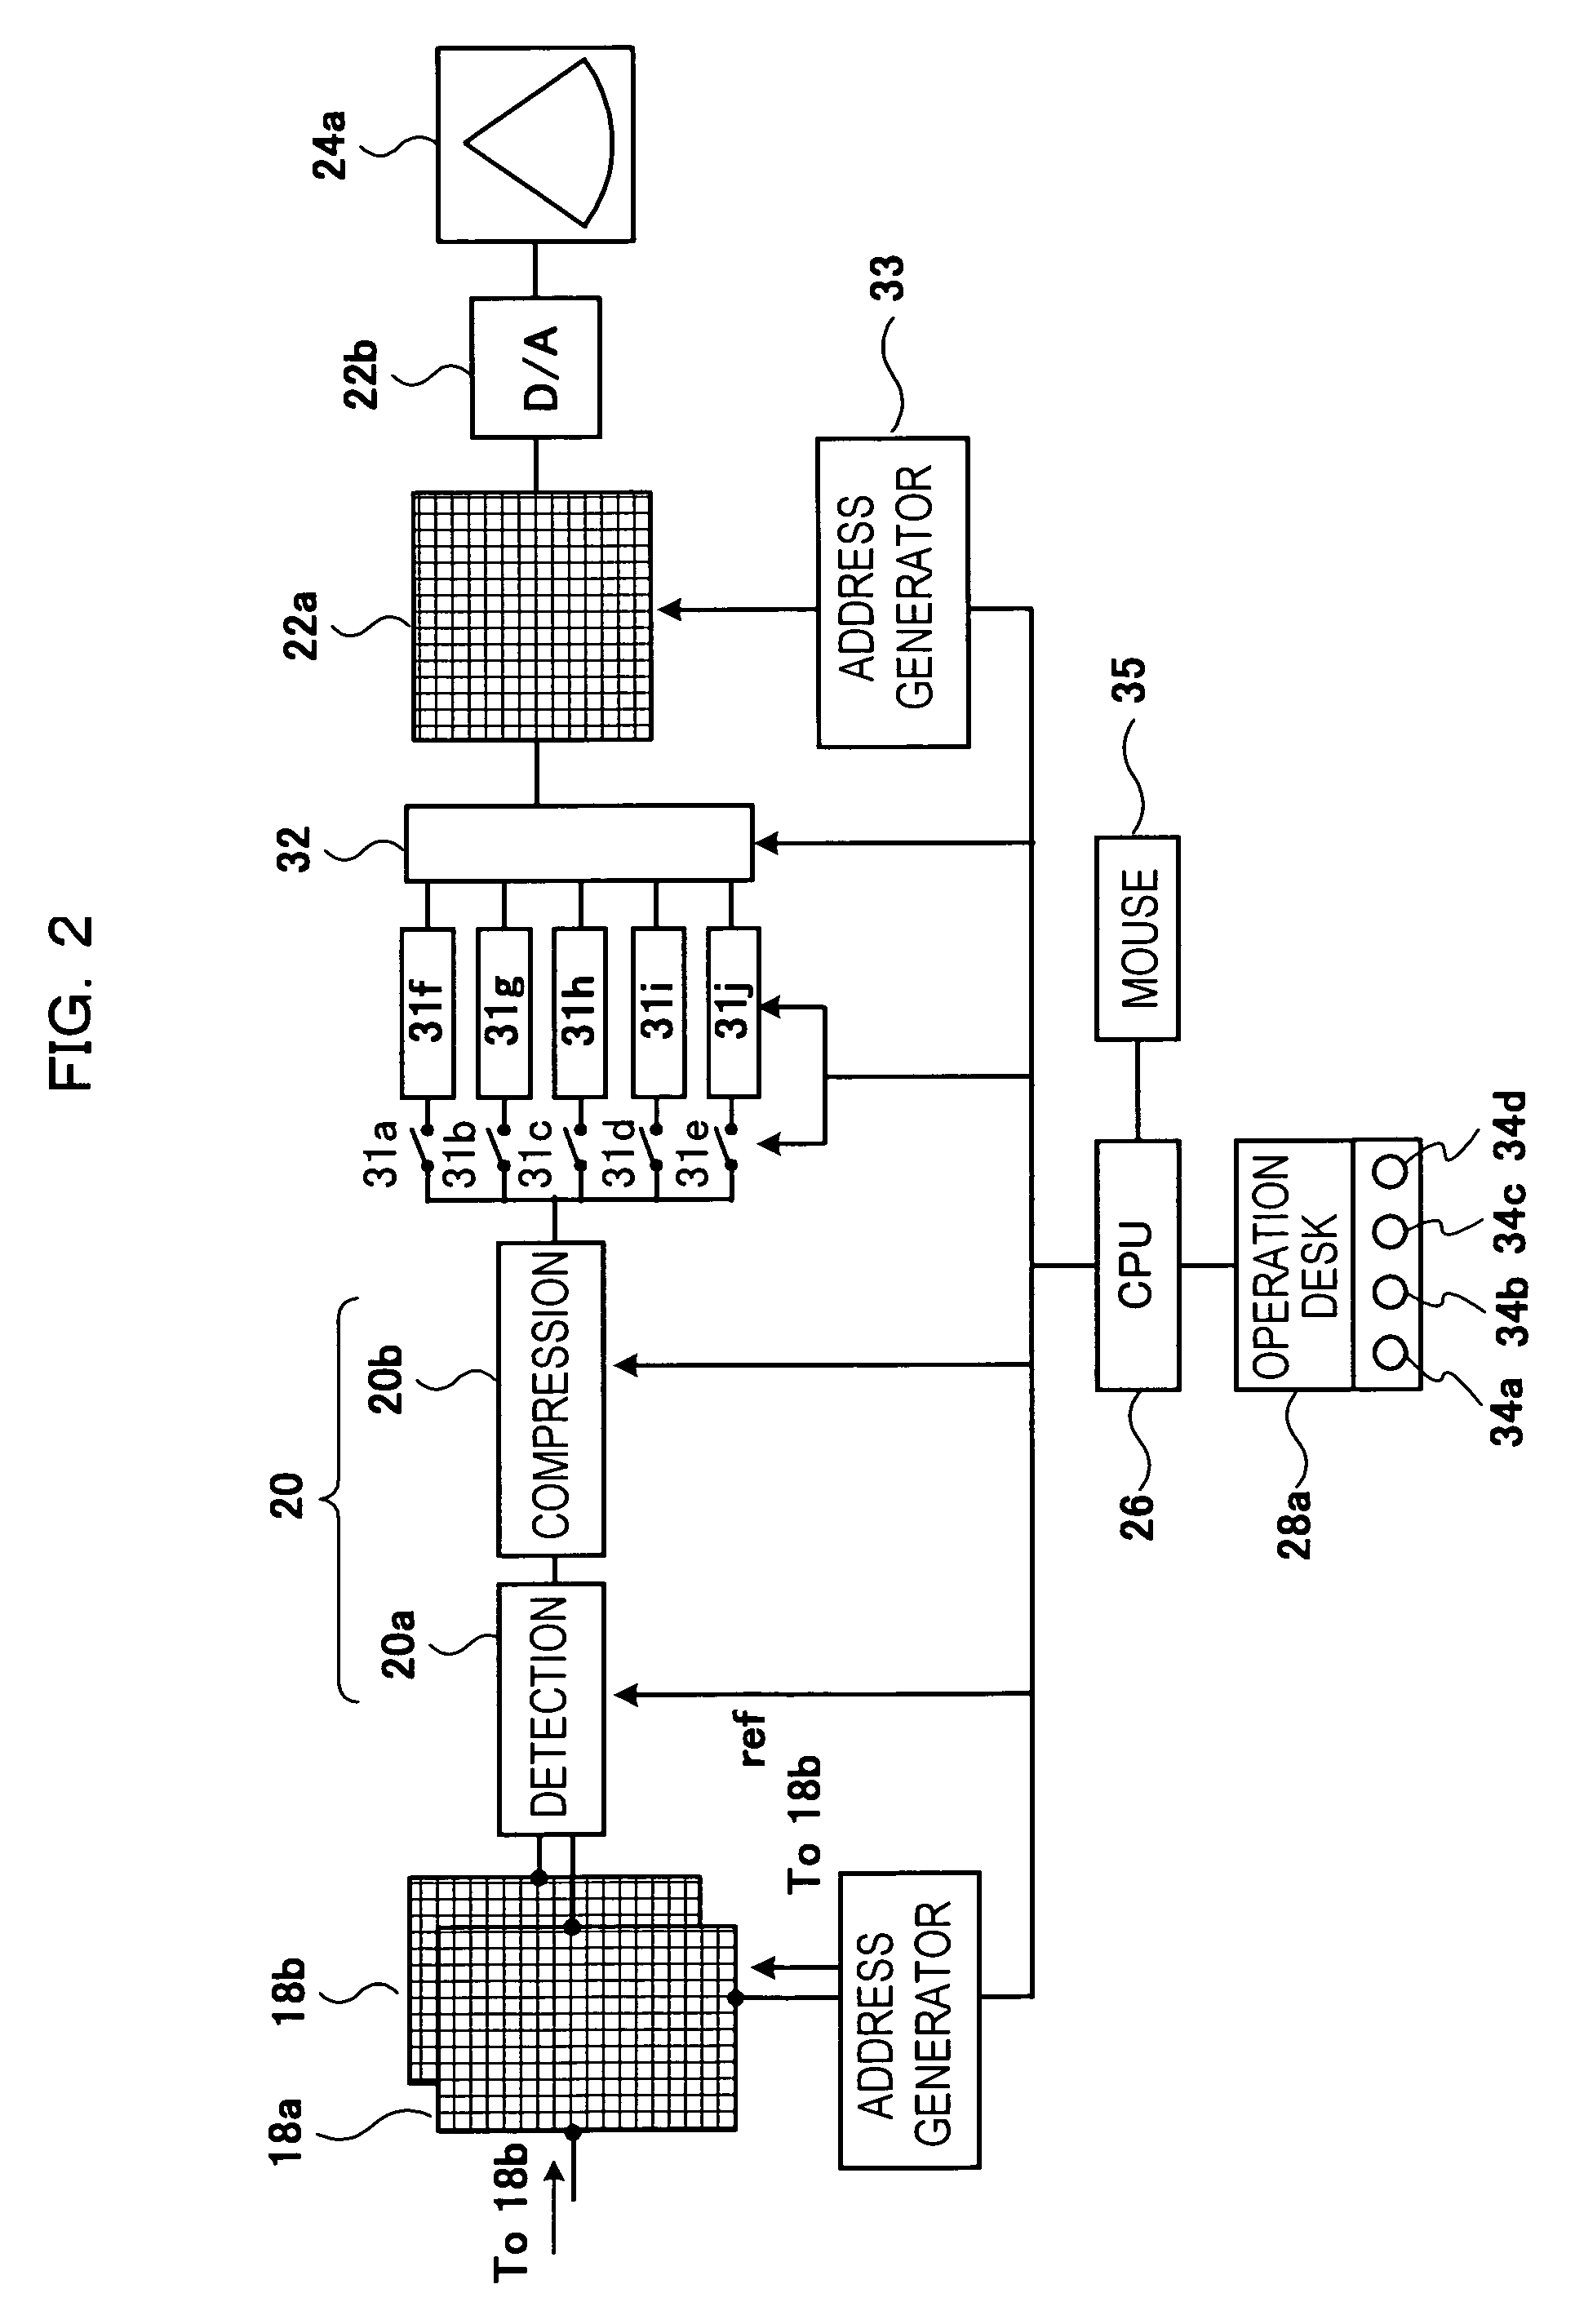
[0041]The first embodiment of an ultrasonic diagnostic apparatus relating to the present invention will now be described referring to FIG. 1 to FIG. 8. First, the configuration of the ultrasonic diagnostic apparatus relating to the present invention will be described using FIG. 1 and FIG. 2.

[0042]Ultrasonic diagnostic apparatus 1 is configured of probe 10, transmission / reception unit 12 that has a transmission unit and a reception unit, AD conversion unit 14, phasing addition unit 16, memory 18, signal processing unit 20, image construction unit 22, display unit 24 that has a monitor, controlling unit (CPU) 26, console desk 28, and so forth.

[0043]Next, the operation of the above-mentioned ultrasonic diagnostic apparatus 1 will be explained. First, a doctor applies probe 10 on the body surface of an object to be examined. Next, the doctor inputs an order to start ultrasound examination using console desk 28. Corresponding to a starting order, an order to output driving pulse is issue...

embodiment 2

[0083]The second embodiment relating to the present invention will now be described referring to FIG. 11 and FIG. 12. The difference between the present embodiment and the first embodiment is that the intended ultrasound images are M-mode images, not B-mode images. In this embodiment, explanation will be omitted for the equivalent with embodiment 1 in function as well as configuration, with encoding remaining the same. FIG. 11 shows the M-mode images indicating the morphological variation of a heart wall in one heartbeat. FIG. 12 shows a display example of the plurality of M-mode images with different sensitivity range being arranged and displayed on the same screen simultaneously.

[0084]As shown in FIG. 11, M-mode images indicate temporal morphological variation toward ultrasound beam direction of, for example, heart wall 50 and 51 that form ventriculus sinister 52, and electrocardiographic (ECG) waveform 53 measured by an electrocadiograph (not shown in the diagram) is temporally s...


PUM


Abstract

A probe 10 receives an echo signal, and the echo signal is stored in memory 18. Operation desk 28a has at least one readout-range setting device 34 for setting an echo signal readout-sensitivity range of the echo signal stored in memory 18. Echo signals in the sensitivity range preset by readout-range setting device 34 is read out from memory 18 from among the echo signals in the sensitivity range stored in memory 18. The echo signal read out of memory 18 is converted into data corresponding to the display dynamic range of monitor 24a by a digital gain regulation circuit 31. The converted data is inputted into image construction unit 22 to create image data. The image data is displayed on the screen of monitor 24a.

Description

TECHNICAL FIELD[0001]The present invention relates to an ultrasonic diagnostic apparatus and in particular to the apparatus that is advantageous for observing the fine structure of a diagnostic region with the image in an optimal contrast resolution.BACKGROUND OF THE INVENTION[0002]An ultrasonic apparatus is an apparatus that transmits ultrasonic waves from a probe to the body surface of an object to be examined, electrically prosesses an echo reflected from the object, forms an ultrasound image (such as B-mode image, M-mode image, D-mode image, or CFM-mode image) from the processed echo signals, and displays the ultrasound images thereof on a monitor.[0003]In such ultrasonic diagnostic apparatus, while a dynamic range that is a sensitivity range generally possible to be displayed on a monitor range is, for instance, between 0 dB˜40 dB, there are cases that the dynamic range of the echo ranges is, for instance, between 0 dB˜90 dB. In this case, when an ultrasound image is displayed ...

Claims


Application Information

Patent Timeline
Patent Type & Authority Patents(United States)
IPC IPC(8): A61B8/00G01S7/52
CPCA61B8/00A61B8/06A61B8/13A61B8/486G01S7/52025G01S7/52034G01S7/5206G01S7/52071G01S7/52073G01S7/52074
Inventor SASAKI, AKIRA
Owner HITACHI MEDICAL CORP
Why Eureka
Try Eureka