
Clustered computing model and display

a computing model and display technology, applied in the field of data networking, can solve problems such as problems, and achieve the effect of improving performan

Inactive Publication Date: 2009-06-30
INTEL CORP
View PDF22 Cites 41 Cited by
  • Summary
  • Abstract
  • Description
  • Claims
  • Application Information

AI Technical Summary

Benefits of technology

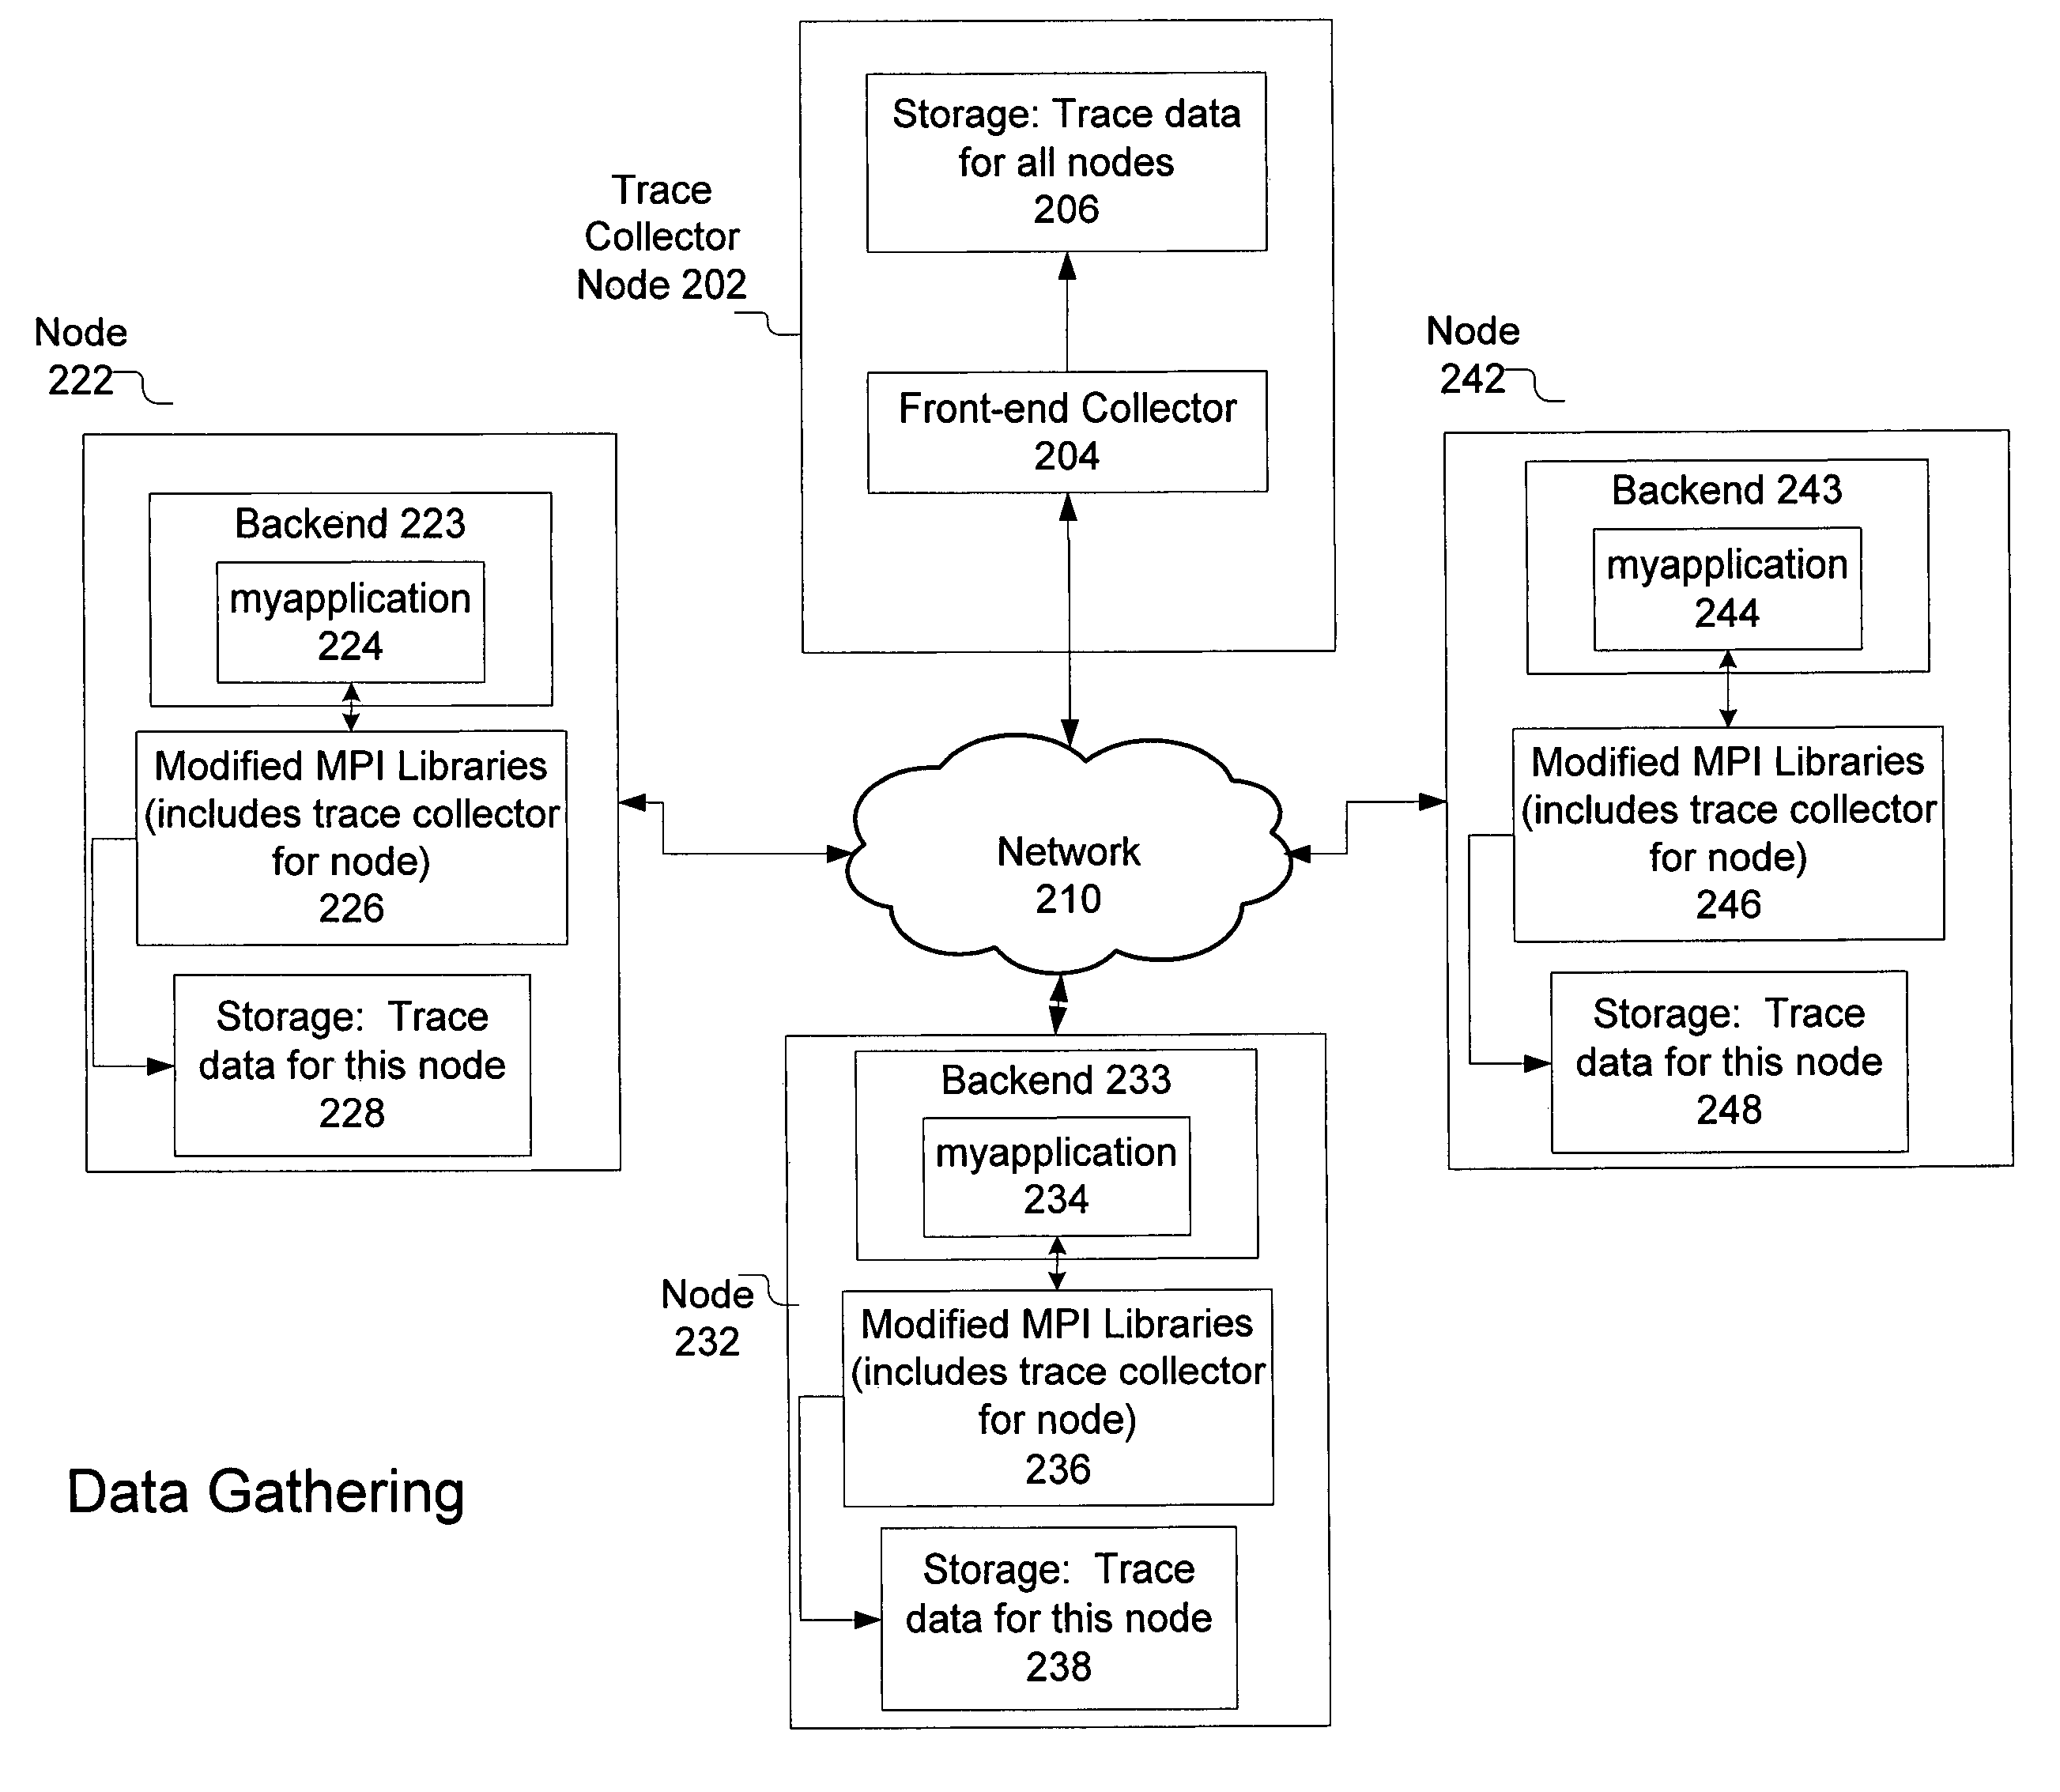
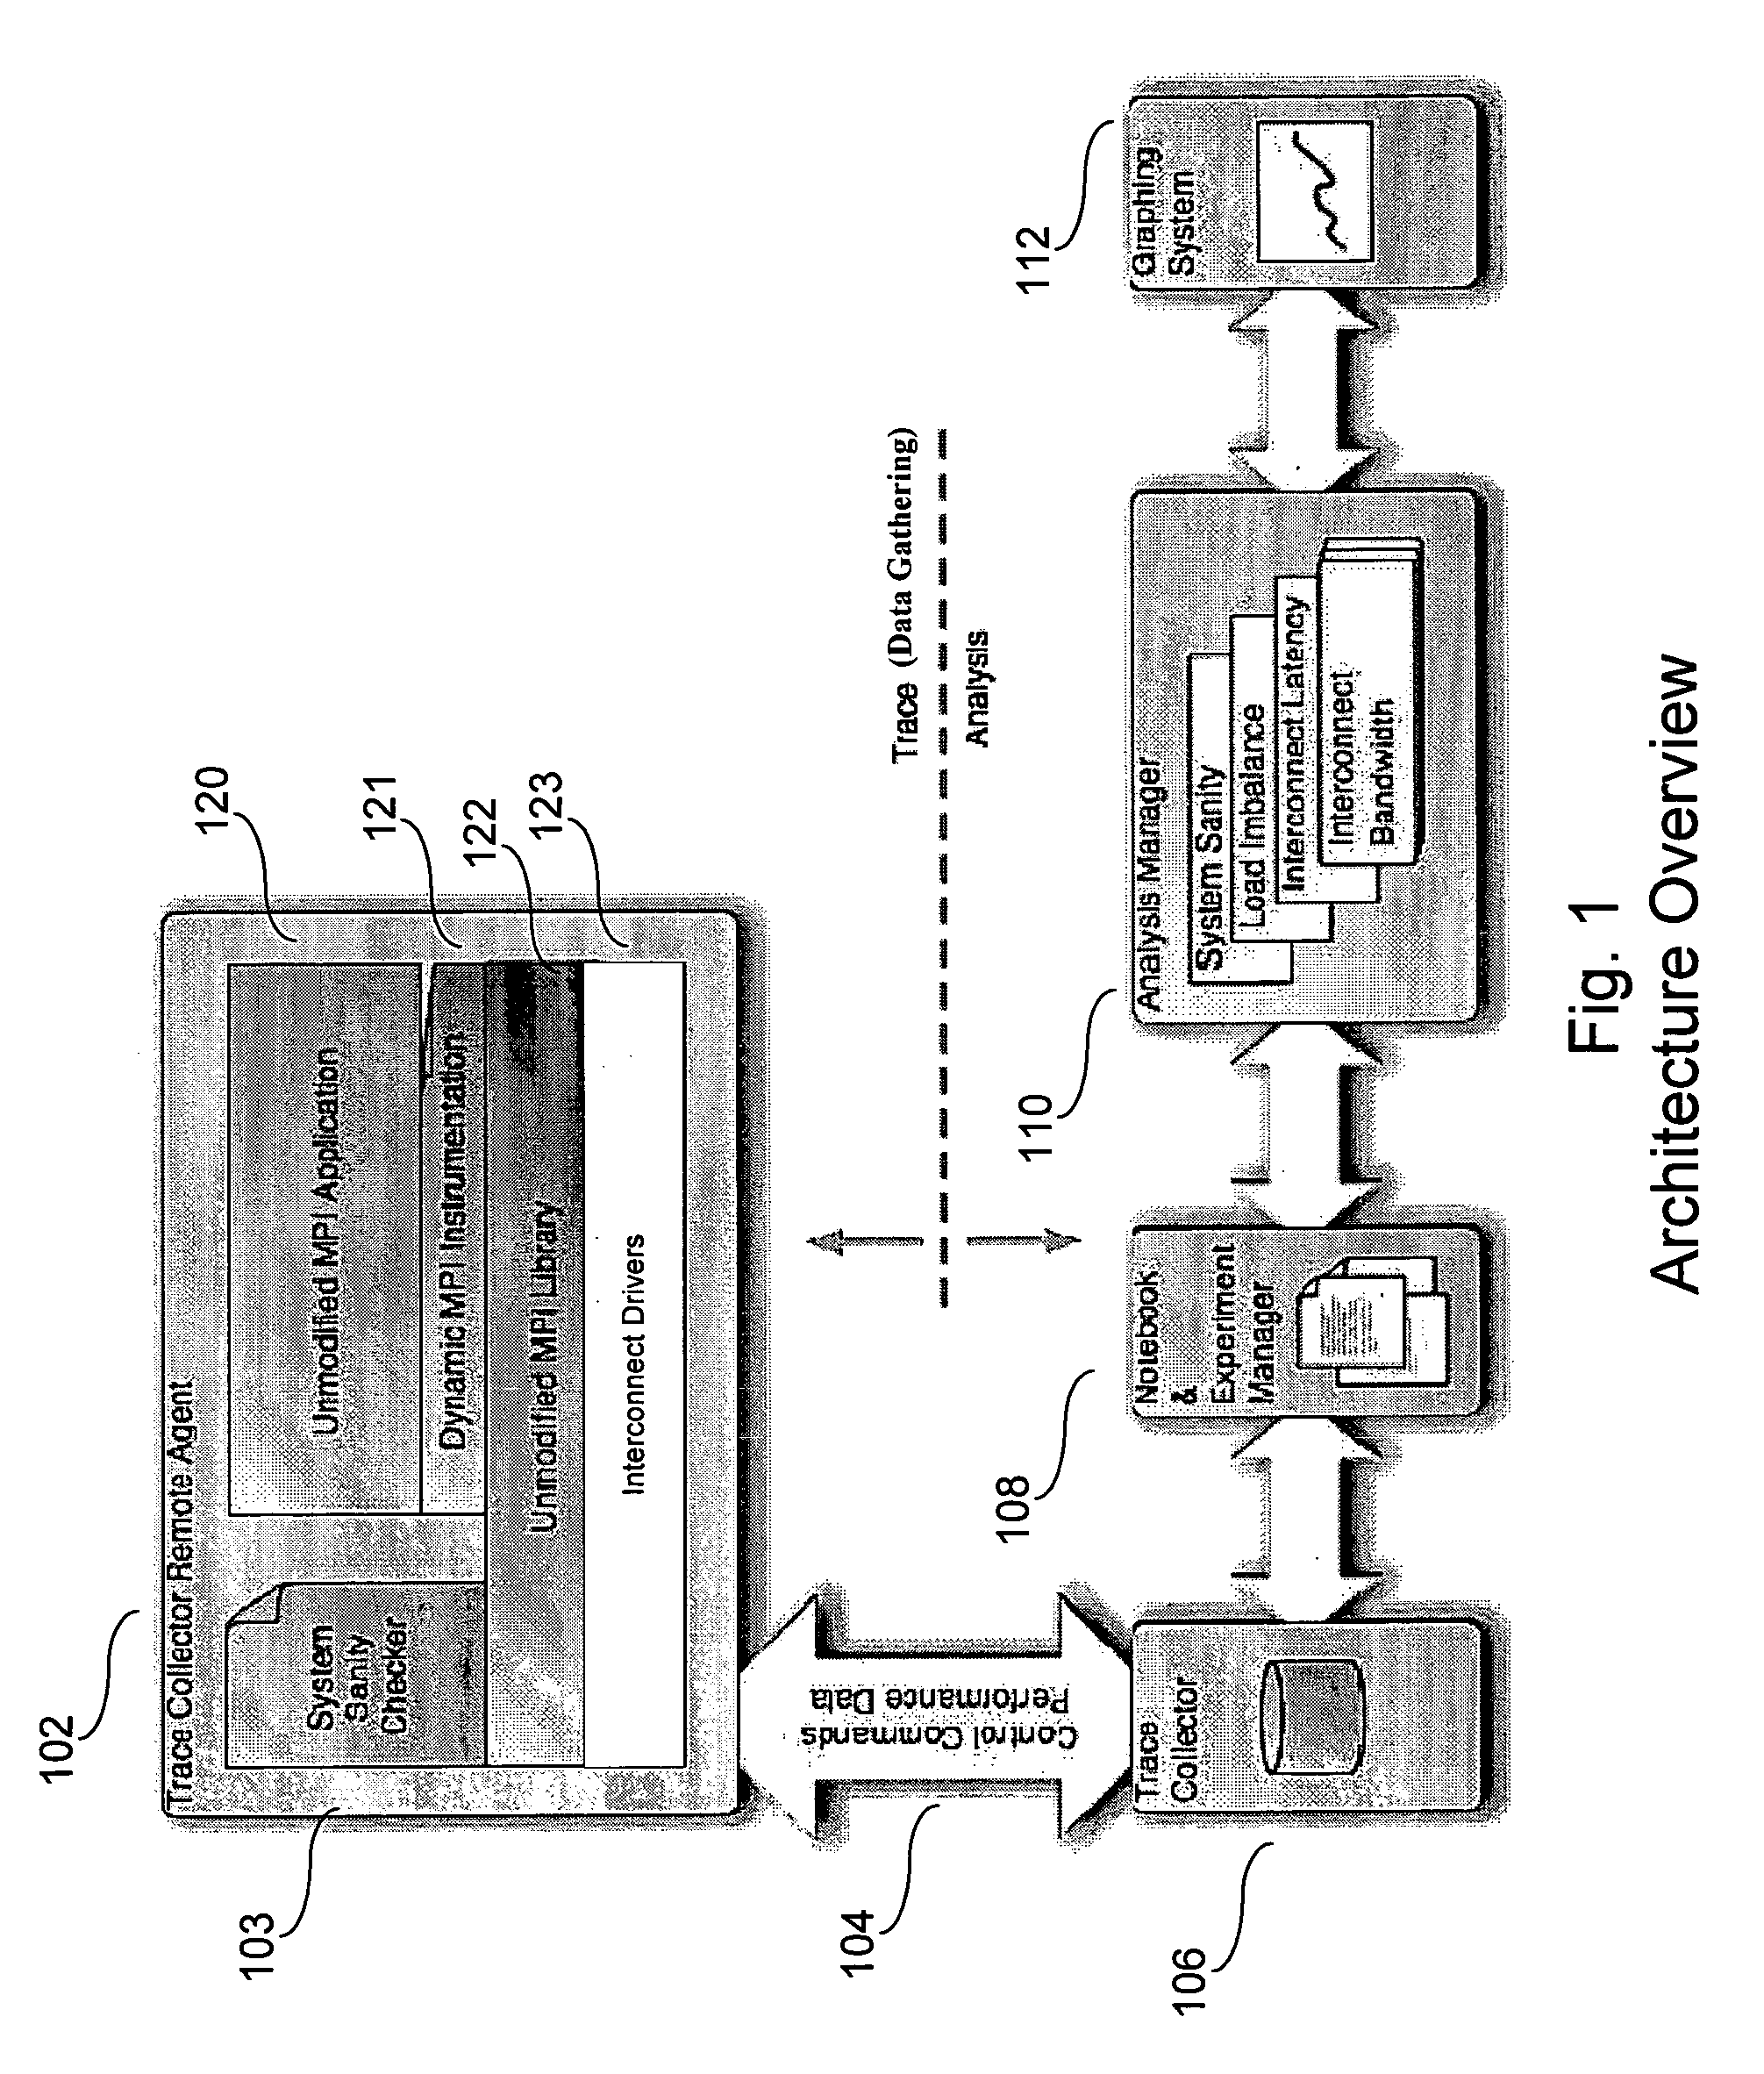
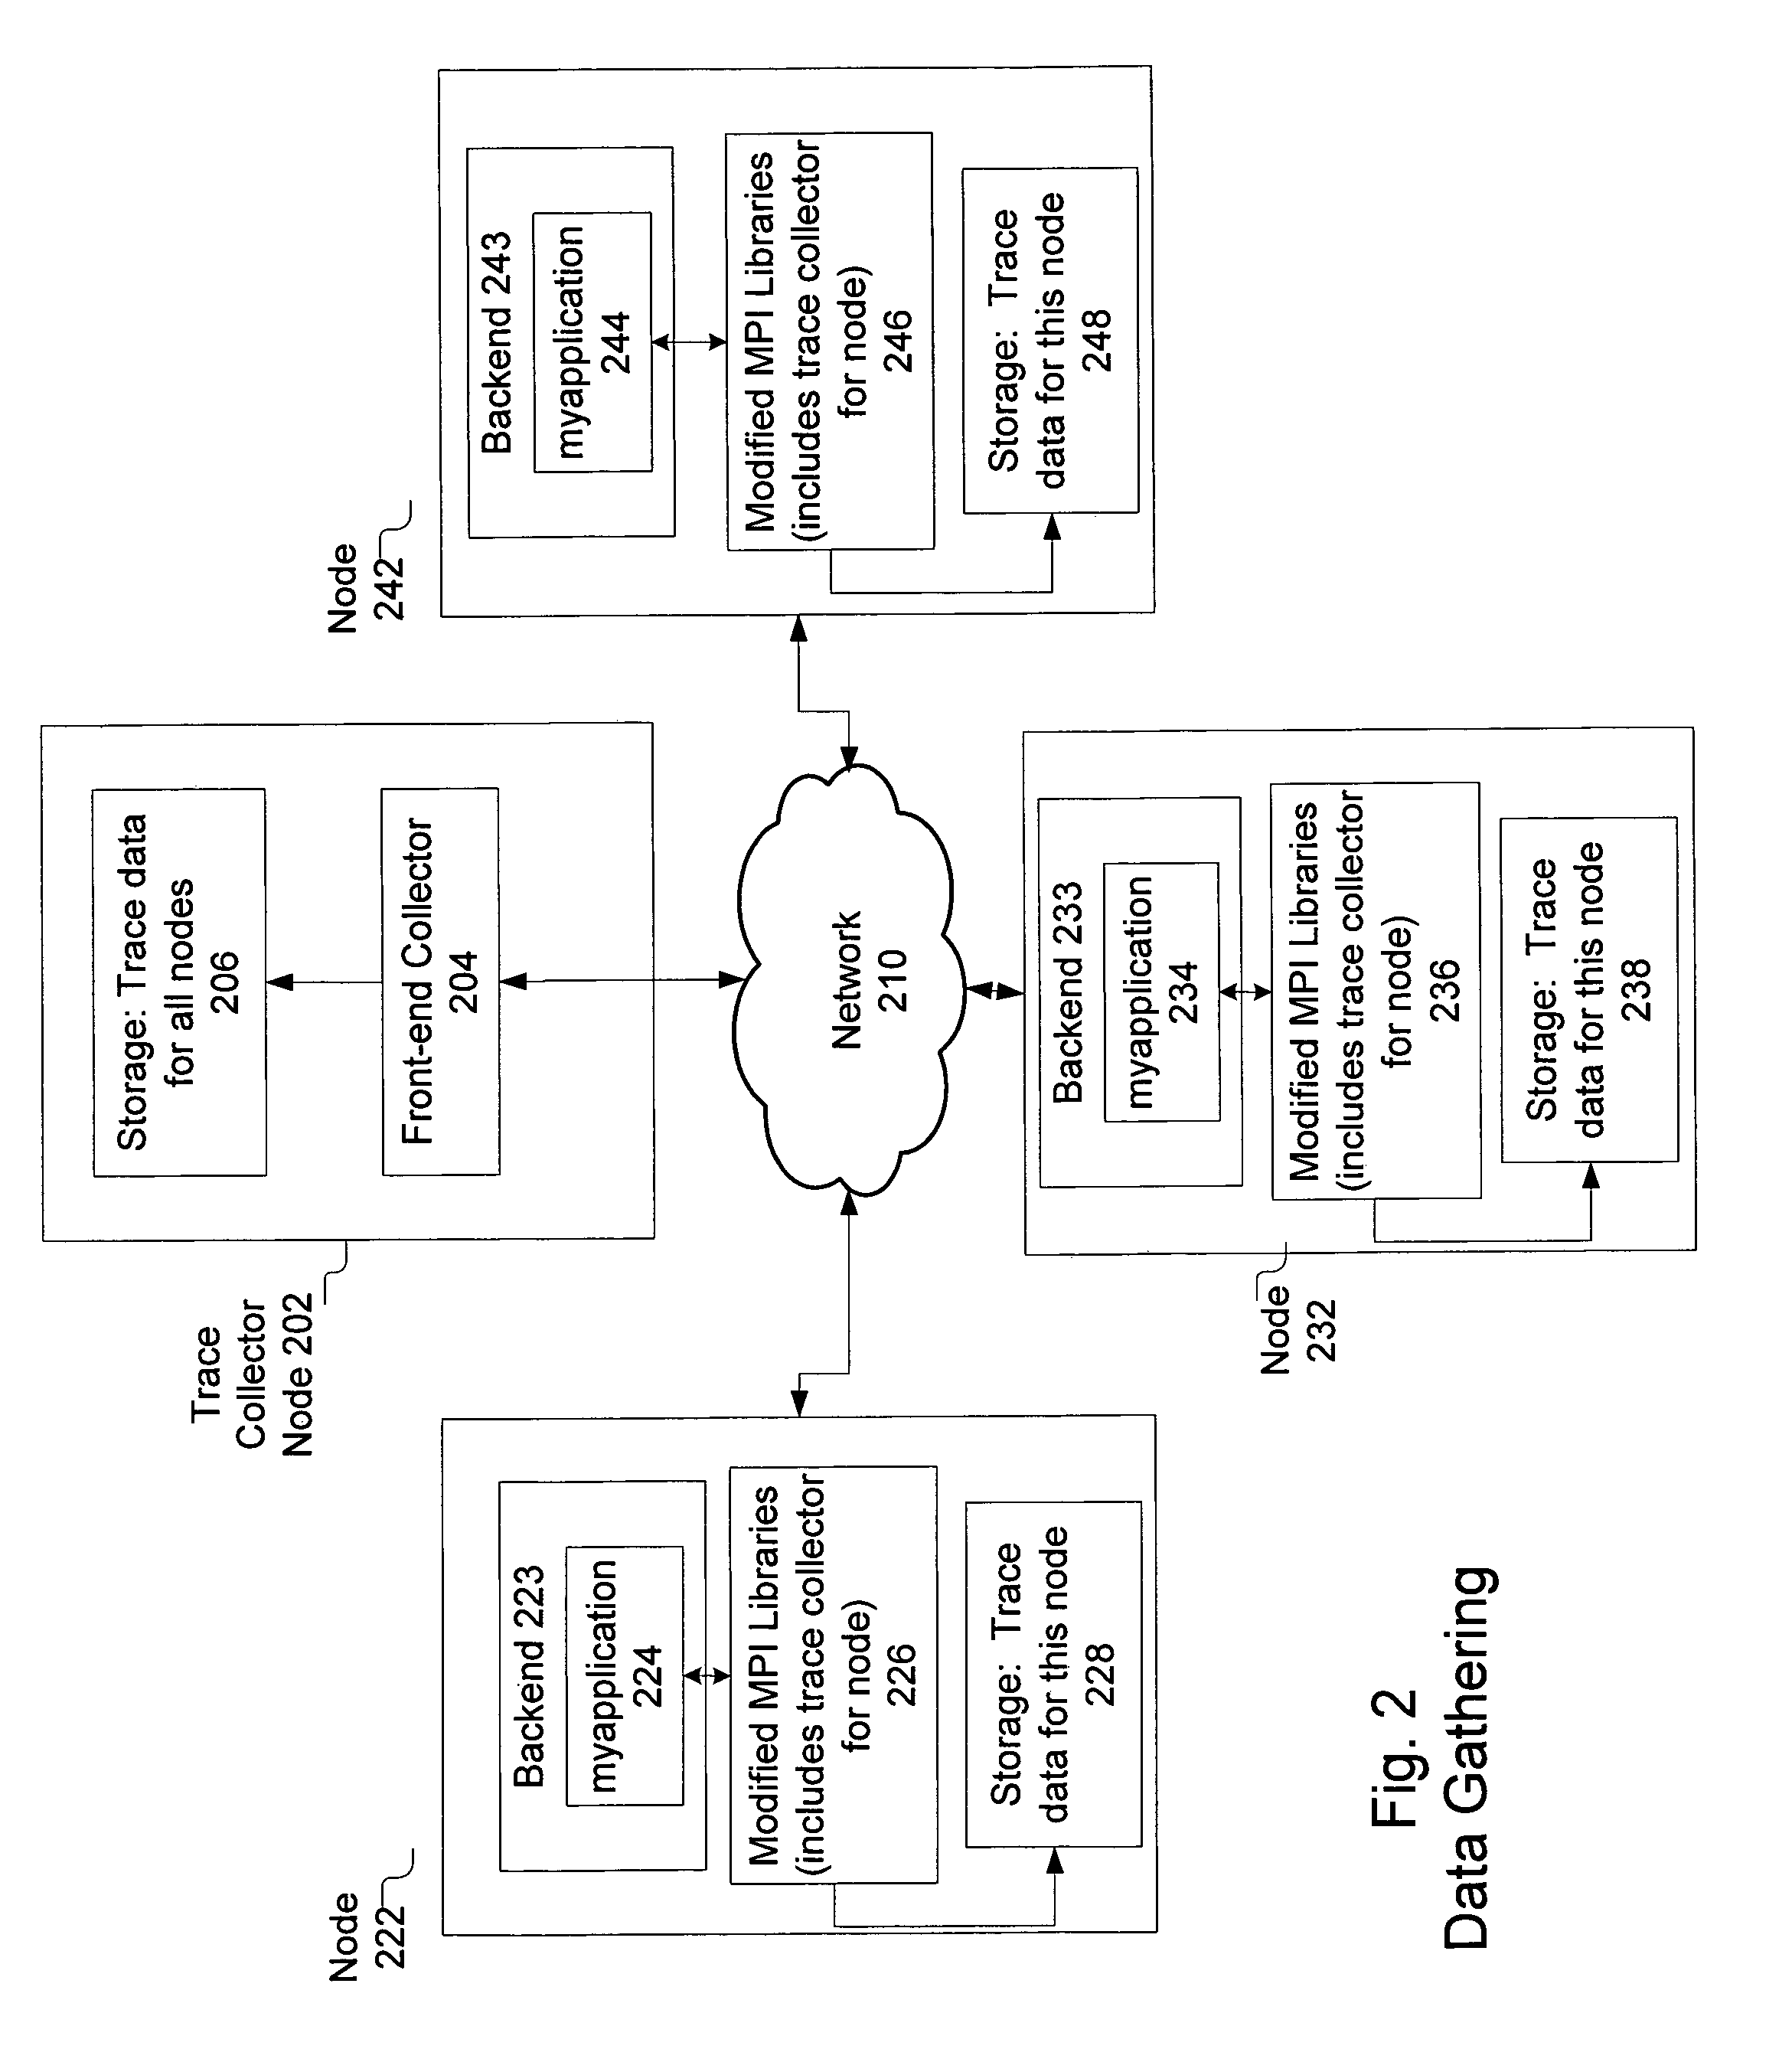
[0010]A preferred embodiment of the present invention provides a way of gathering performance data during execution of an application executing on clustered machines. This data is then presented to the user in a way that makes it easy to determine what variables and situations to change in order to improve performance.
[0011]The described embodiments liberate a user or systems administrator from the need to take months-long detours into becoming an MPI performance tuning expert. The present invention can be implemented to support the most popular 32- and 64-bit HPC platforms; the most widely used Linux distributions; and a variety of cluster interconnects. Most importantly, the described tools guide the user straight to the root causes of his application's performance problems, and starts him or her on the road to fixing them.
[0012]In addition, in the described embodiments, the color of displayed vertical bands indicates how much a particular call or calls from one or more nodes in one or more experiments is contributing to the effect of communication time, latency, and bandwidth.
[0014]Such tools eliminate much of the mental effort, manual data gathering, and repetition of traditional performance analysis, by automating the parts of the process that ought not to require human intervention. In addition, the tools are structured to make light work of the performance analysis and tuning process. The tools provide a powerful graphical user interface, and complete control from the command line for the times when a user wants to write scripts.
[0015]The tools make organizing performance experiments simple, by collecting them into Groups called “notebooks.” Each notebook a tool for letting the user group experiments together that is meaningful to the user. A collection of experiments might be comparing different versions of the program, different runs of the same program with different data values, or runs on different collections of computers, etc.

Problems solved by technology

For each problem, the tools display graphics indicating when, and how much, the problem occurs.

Method used


Image

  • Clustered computing model and display
  • Clustered computing model and display
  • Clustered computing model and display

Examples


Embodiment Construction

General Discussion

[0035]In contrast to the conventional trial and error method, the tools in a preferred embodiment of the present invention operate as follows: An administrator tells the tools just once how to run an application, and how to change a few variables that might affect performance—such as cluster size, model resolution, or the data sets to use. An administrator can follow the tools' suggestions for the kinds of experiments to run, for example “run at cluster sizes 2, 4, 8, 16, and 32.” With a few clicks, he can run a batch of experiments. If he needs to, he can run more experiments later, or rerun the same ones to check their consistency. The administrator will be brought straight to the worst problems, right down to the exact lines of code affected. He will be presented with an application's performance trends as the number of CPUs or a model resolution change. He can read about why the problem may be occurring, and what he can do to fix it.

[0036]Once he has made some ...


PUM


Abstract

A preferred embodiment of the present invention provides a way of gathering performance data during execution of an application executing on clustered machines. This data is then presented to the user in a way that makes it east to determine what variables and situations to change in order to improve performance. A described embodiment displays the color of displayed vertical bands in accordance with how much a particular call is contributing to the effect of communication time, latency, and bandwidth.

Description

FIELD OF INVENTION[0001]The present invention relates to data networking and specifically to improving performance in a parallel computing application.BACKGROUND[0002]It is always important in a parallel or clustered computing environment to achieve the best performance. Conventionally, a parallel network is fine-tuned by trial and error, often by trying various network setups until one deemed optimum is arrived at.[0003]Clusters of commodity systems are becoming the dominant platform for high performance computing (HPC), currently making up more than half of the TOP 500 list of the world's fastest supercomputers. Scientists and engineers use clusters to split up an application into a number of cooperating elements, working in parallel on small chunks of the overall problem. These elements are distributed across the individual computers in a cluster, and communicate using, for example, the Message Passing Interface (MPI) Standard.[0004]Within the HPC community, achieving good perfor...

Claims


Application Information

Patent Timeline
Patent Type & Authority Patents(United States)
IPC IPC(8): G06F15/173
CPCH04L12/6418
Inventor CAMPBELL, RALPH B.O'SULLIVAN, BRYAN N.WALSH, ROBERT J.
Owner INTEL CORP
Learn More