Molecular determinants of myeloma bone disease and uses thereof
a bone disease and molecular determinant technology, applied in the field of multiple myeloma, can solve the problems of unelucidated mechanisms responsible for such impairment, and achieve the effects of increasing bone mass, increasing bone mass, and partial repair of lytic lesions
- Summary
- Abstract
- Description
- Claims
- Application Information
AI Technical Summary
Benefits of technology
Problems solved by technology
Method used
Image
Examples
example 1
Patients
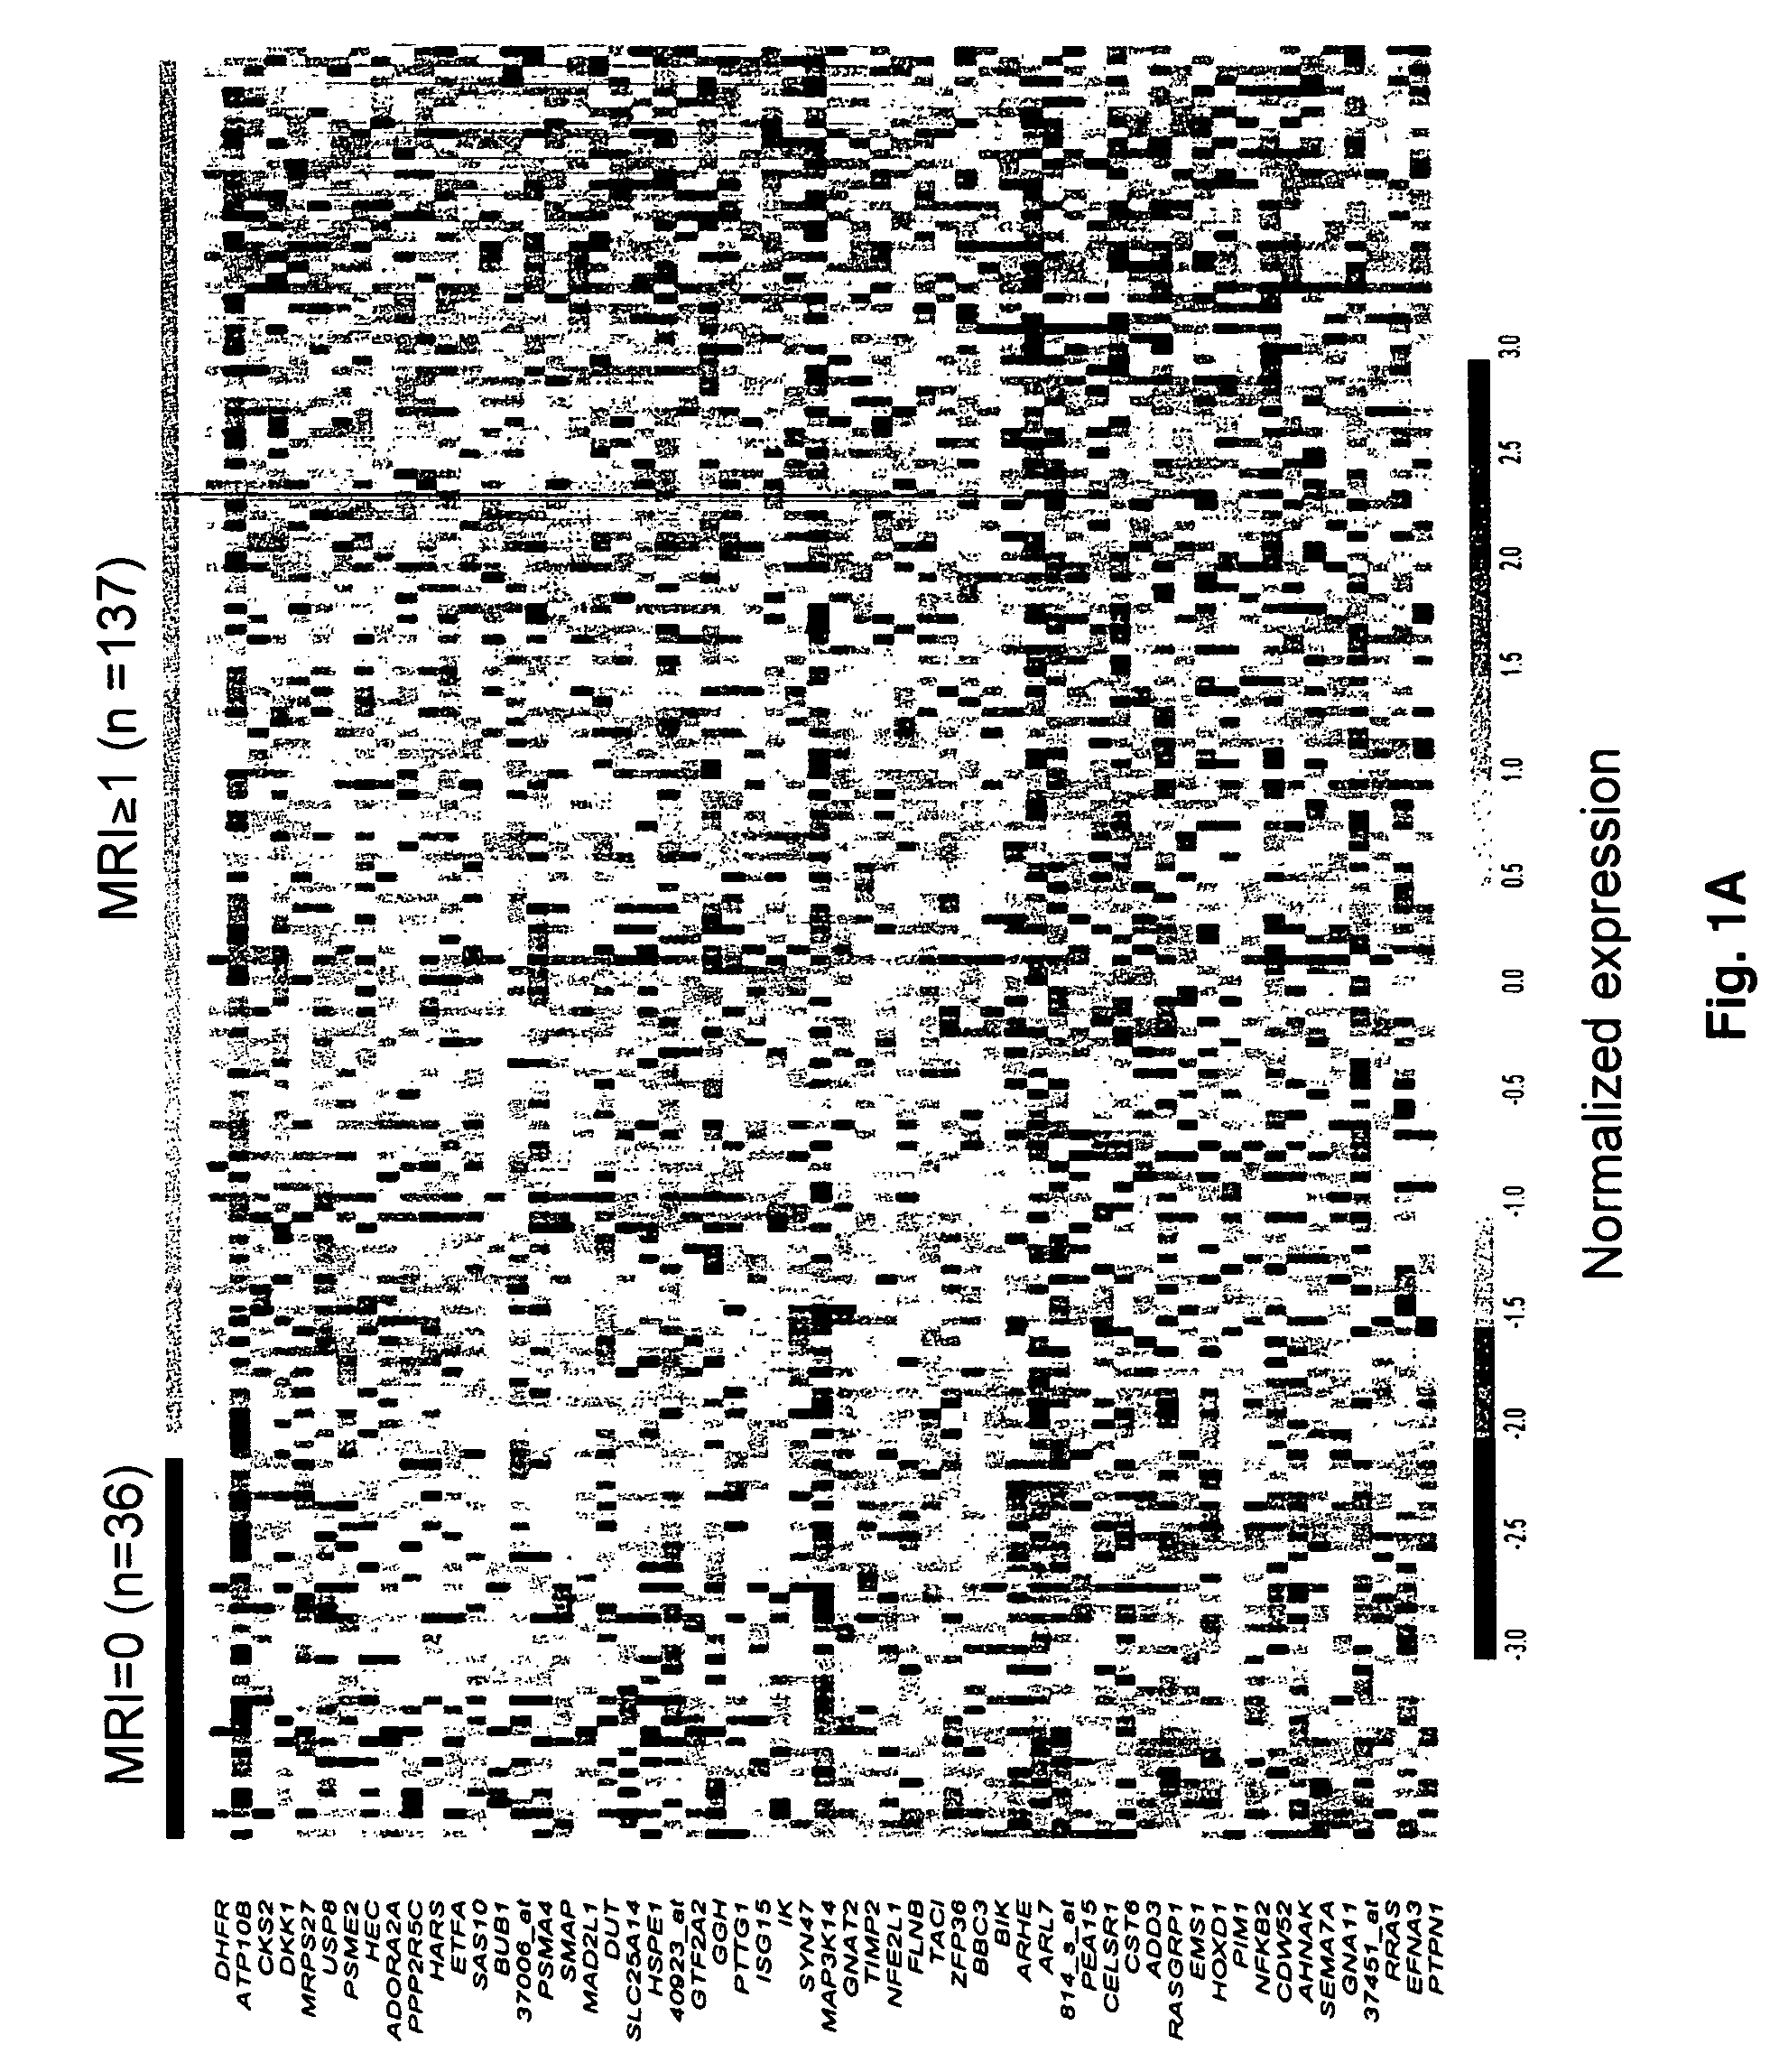
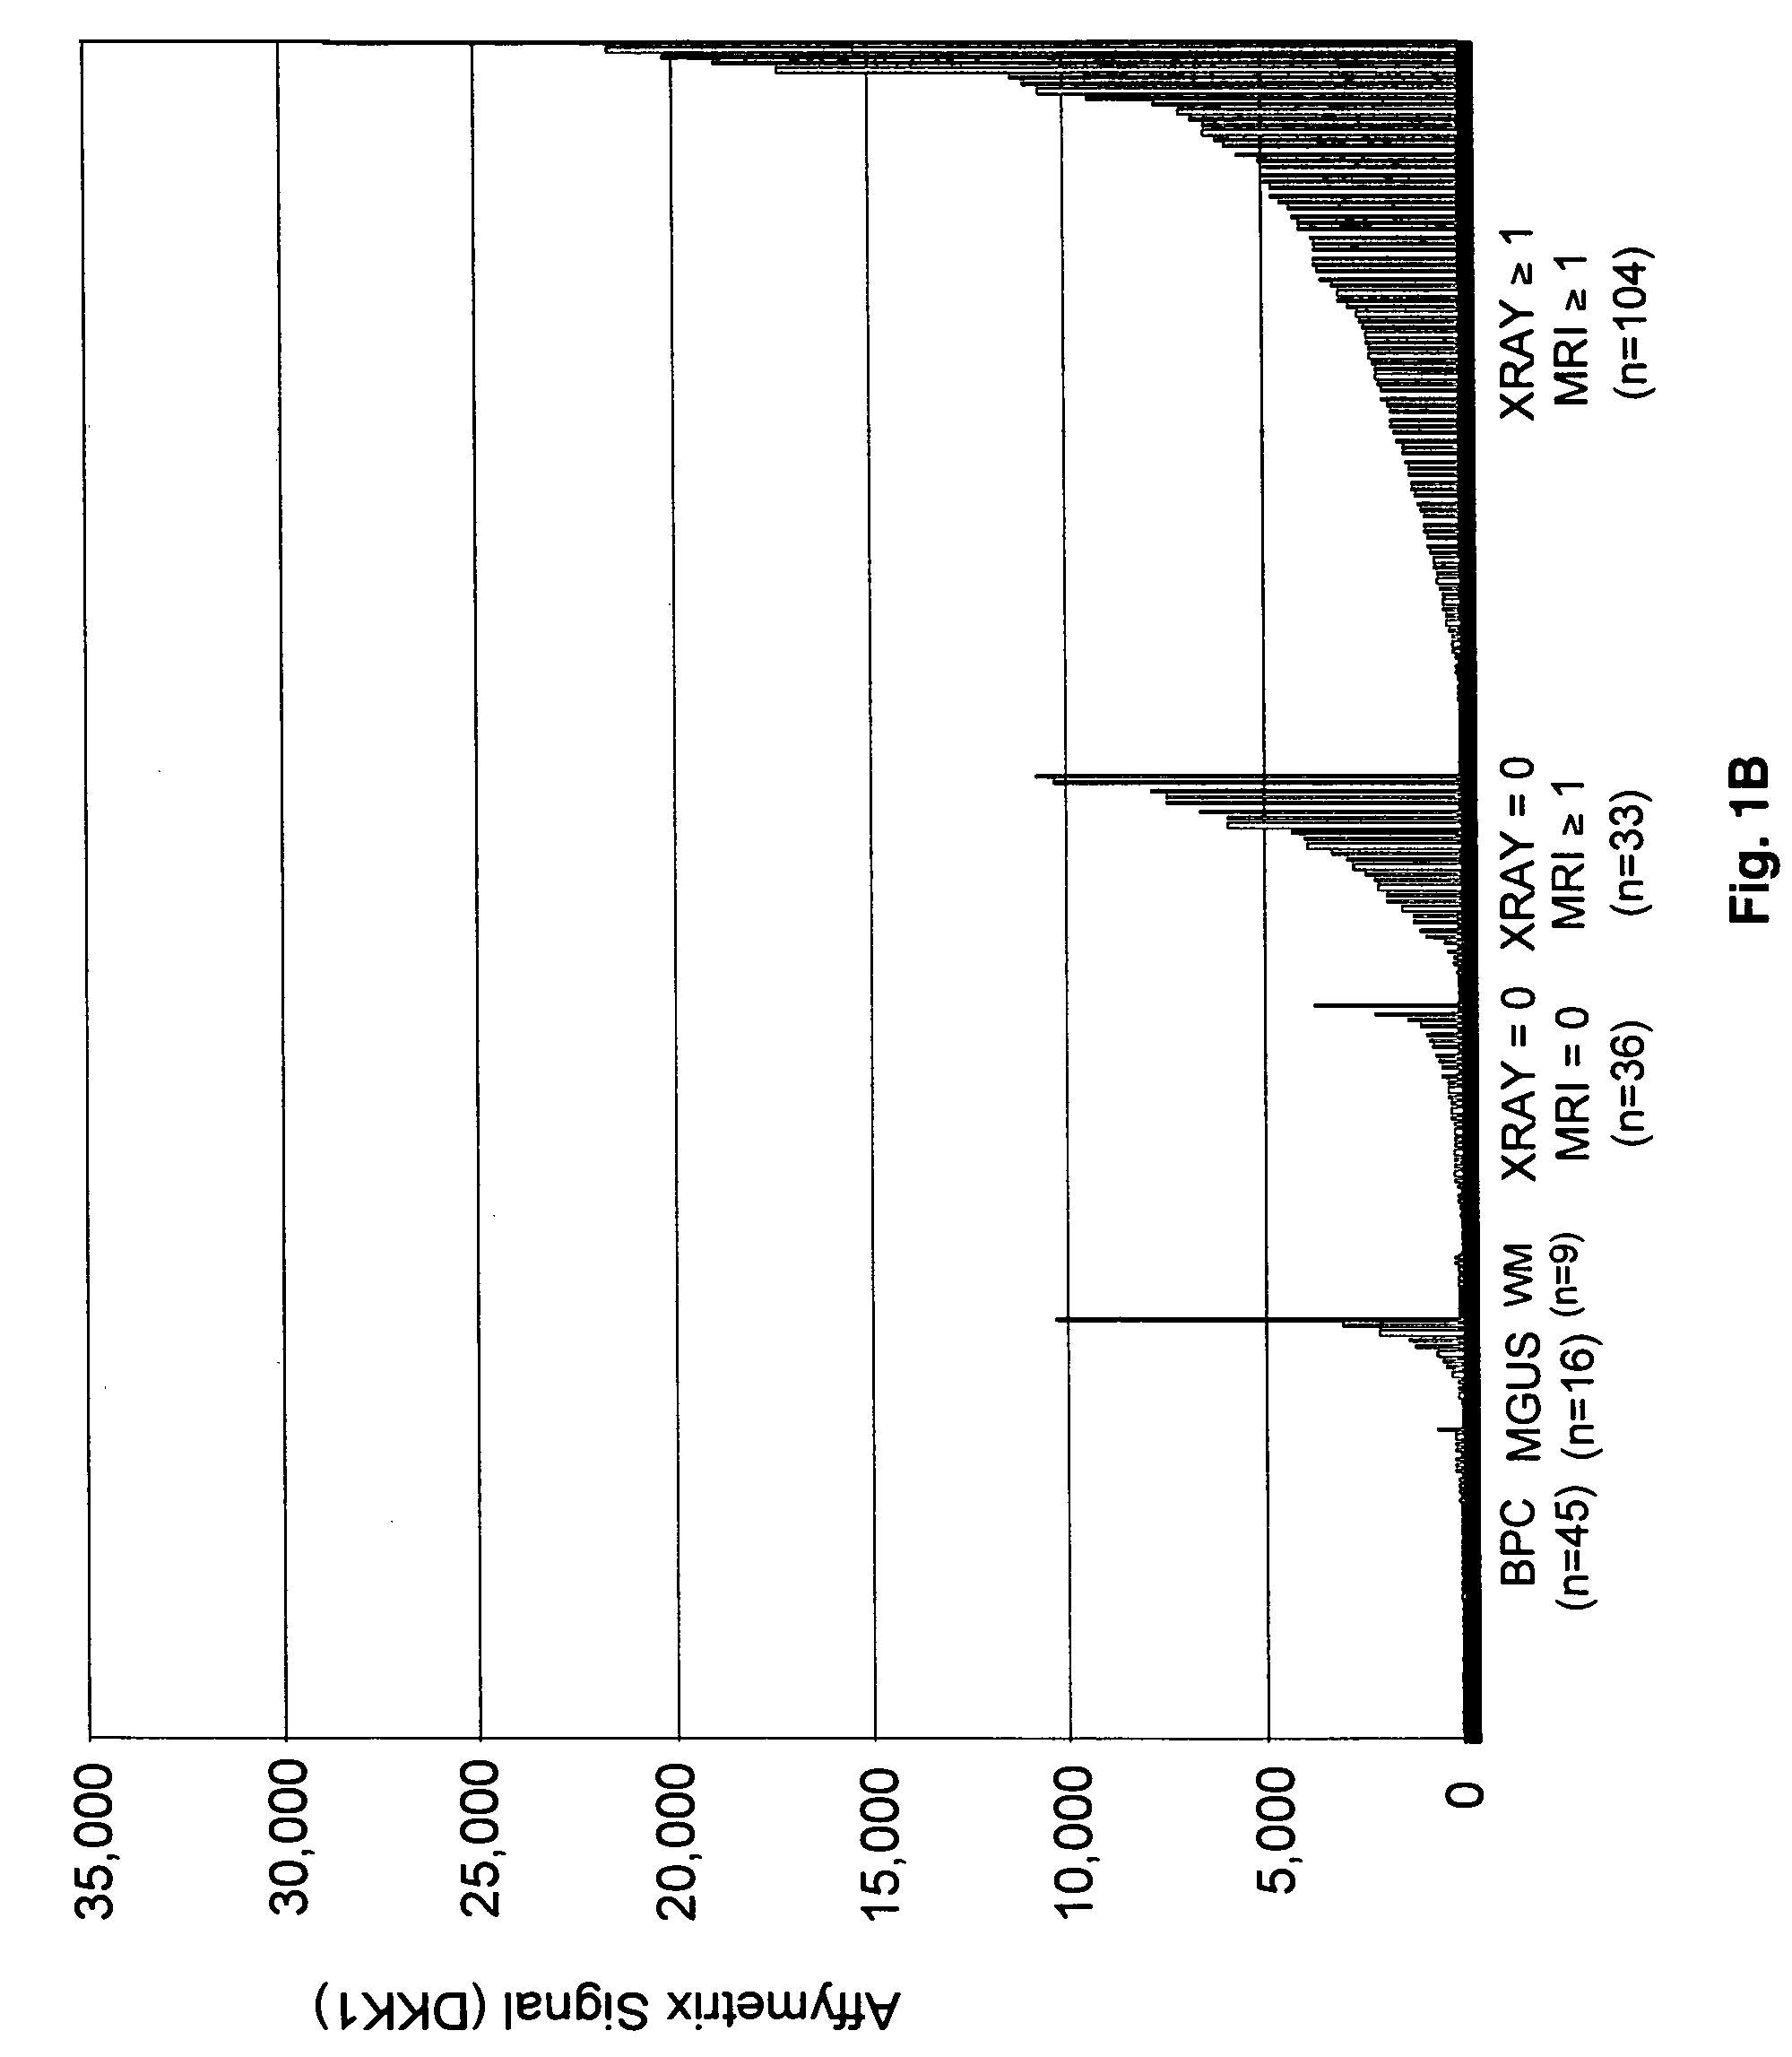
[0097]174 patients with newly diagnosed multiple myeloma, 16 patients with monoclonal gammopathy of undetermined significance, 9 with Waldenström's macroglobulinemia, and 45 normal persons were studied. Table 1 shows the characteristics of the patients with multiple myeloma.
[0098]
TABLE 1Myeloma patient characteristics and their relationship to MRI lesionsPVariablen / N%MRI = 1+MRI = 0valueAge ≧ 65 yr23 / 1691417 / 132 (12.9%) 6 / 36 (16.7%) 0.59*Caucasian147 / 169 87113 / 132 (85.6%) 33 / 36 (91.7%) 0.42*Female68 / 1694055 / 132 (41.7%)13 / 36 (36.1%)0.55Kappa light chain104 / 165 6379 / 128 (61.7%)24 / 36 (66.7%)0.59Lambda light chain61 / 1653749 / 128 (38.3%)12 / 36 (33.3%)0.59IgA subtype39 / 1692325 / 132 (18.9%)14 / 36 (38.9%) 0.012B2M ≧ 4 mg / L60 / 1693647 / 132 (35.6%)13 / 36 (36.1%)0.96CRP ≧ 4 mg / L12 / 166711 / 129 (8.5%) 1 / 36 (2.8%) 0.47*Creatinine ≧ 2 mg / dL19 / 1691116 / 132 (12.1%)3 / 36 (8.3%) 0.77*LDH ≧ 190 UI / L52 / 1693144 / 132 (33.3%) 8 / 36 (22.2%)0.20Albumin 23 / 1691419 / 132 (14.4%) 4 / 36 (11.1%) 0.79*Hgb 40 / 1692431 / 132 ...
example 2
[0099]Images were reviewed, without prior knowledge of gene expression data, using a Canon PACS (Picture Archiving and Cataloging System). MRI scans were performed on 1.5 Tesla GE Signa™ scanners. X-rays were digitized from film in accordance with American College of Radiology standards. MRI scans and x-rays were linked to the Canon PACS system using the ACR's DICOM (Digital Imaging and Communications in Medicine) standard. Imaging was done in accordance with manufacturers' specifications. MRI images were created with pre- and post-gadolinium T1-weighting and STIR (short-tau inversion recovery) weighting.
example 3
Plasma Cell Isolation and Gene Expression Profiling
[0100]Following Ficoll-Hypaque gradient centrifugation, plasma cells obtained from the bone marrow were isolated from the mononuclear cell fraction by immunomagnetic bead selection using a monoclonal mouse anti-human CD138 antibody (Miltenyi-Biotec, Auburn, Calif.). More than 90 percent of the cells used for gene expression profiling were plasma cells, as shown by two-color flow cytometry using CD138+ / CD45− and CD38+ / CD45− markers, the presence of cytoplasmic immunoglobulin light chains by immunocytochemistry, and morphology by Wright-Giemsa staining. Total RNA was isolated with RNeasy Mini Kit (Qiagen, Valencia, Calif.). Preparation of labeled cRNA and hybridization to U95Av2 microarrays containing approximately 10,000 genes (Affymetrix, Santa Clara, Calif.) was performed as previously described (Zhan et al., 2002; Zhan et al., 2003). RNA amplification was not required.
PUM
| Property | Measurement | Unit |
|---|---|---|
| concentration | aaaaa | aaaaa |
| concentration | aaaaa | aaaaa |
| concentration | aaaaa | aaaaa |
Abstract
Description
Claims
Application Information
 - R&D
- Intellectual Property
- Life Sciences
- Materials
- Tech Scout
- Unparalleled Data Quality
- Higher Quality Content
- 60% Fewer Hallucinations
Browse by: Latest US Patents, China's latest patents, Technical Efficacy Thesaurus, Application Domain, Technology Topic, Popular Technical Reports.
© 2025 PatSnap. All rights reserved.Legal|Privacy policy|Modern Slavery Act Transparency Statement|Sitemap|About US| Contact US: help@patsnap.com


