[0012]An embodiment of the present invention relates to systems, methods, and computer products that efficiently present typically large amounts of entity information in a graphical display that retains all or most of the relevant
contextual information about the entities. More particularly, the preferred embodiment of the present invention enables efficient analysis of data with a graphical display that improves
data analysis by minimizing
distortion of the text in the graphical display, retaining contextual information associated with
data objects in the graphical display, and positioning the objects to optimally represent relational
database associations. Techniques of the past have not been able to sufficiently improve the graphical display of a typically large number of objects that may be used with
data analysis techniques such as
data mining of relational
database information or
multidimensional data, and OLAP data.
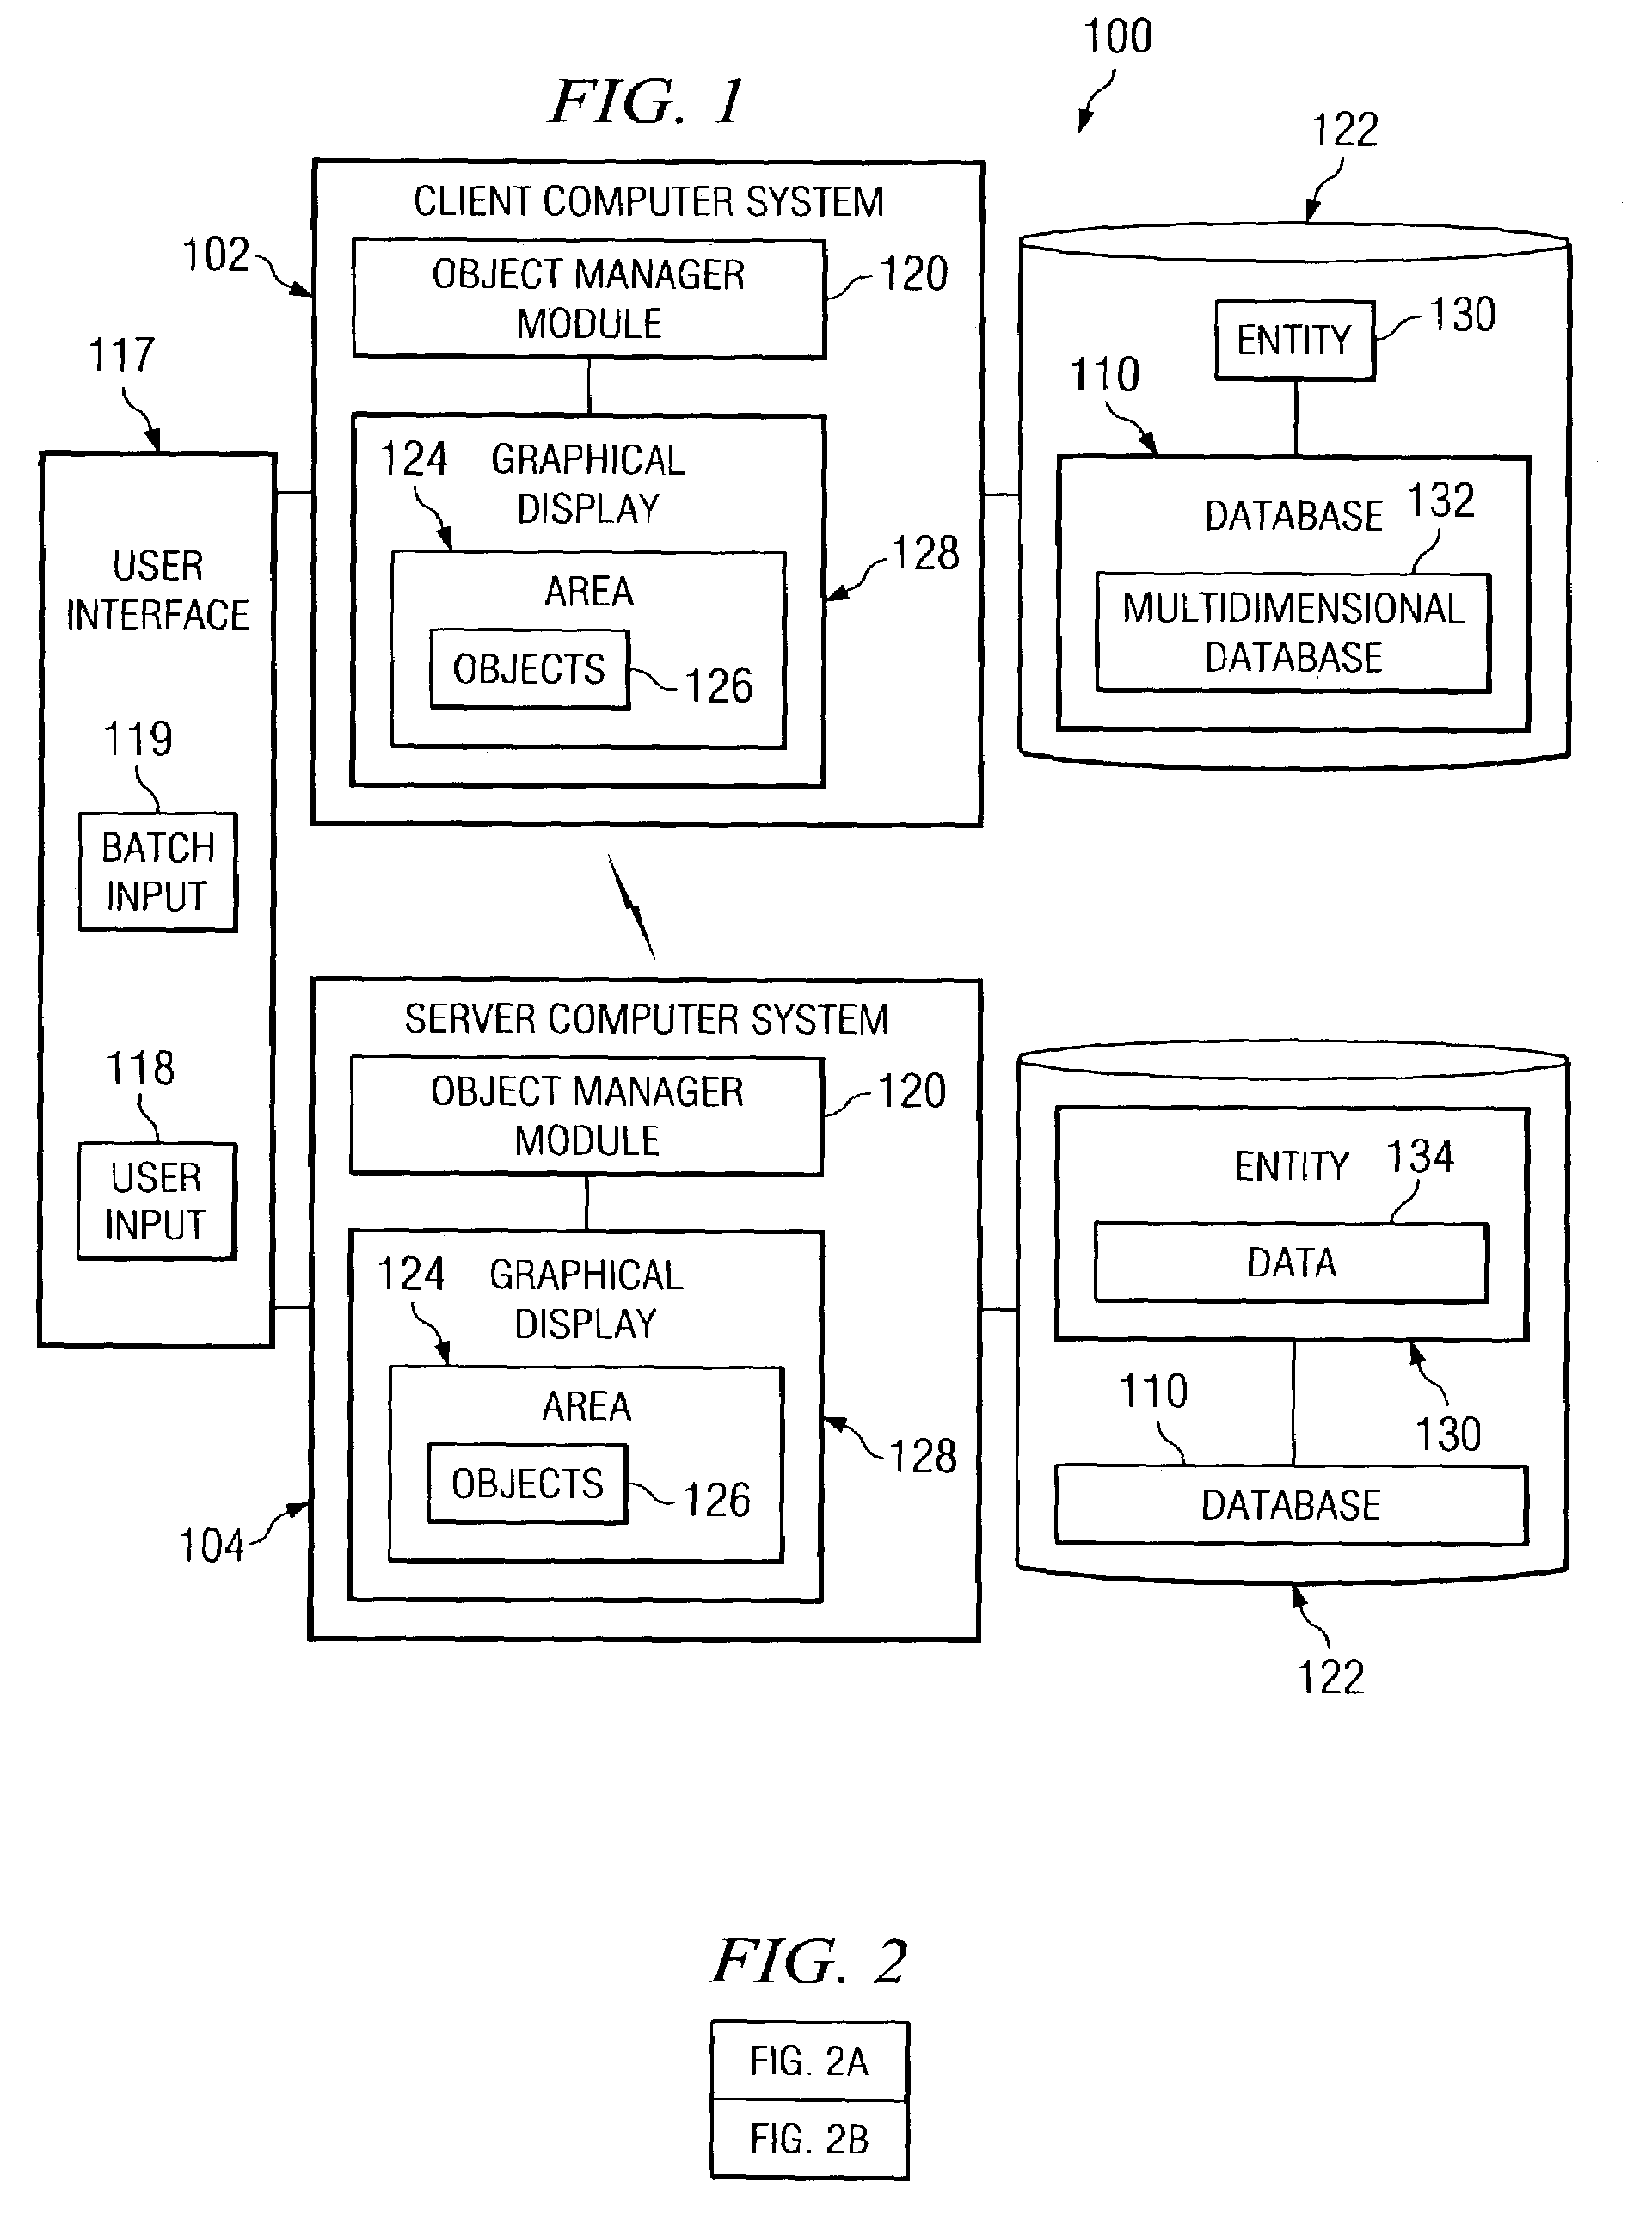
[0013]The preferred embodiment of the present invention employs a technique that enables expansion of some objects that represent entities while also presenting other non-expanded objects within the graphical display in a manner that retains all or most of the contextual information. The preferred embodiment of the present invention may rely on a typical
star schema layout of data entities that includes a facts object, typically containing a single facts table, in the center of the display surrounded by dimension objects. A
star schema is a set of relational tables including multiple main tables, sometimes referred to as fact tables, and related dimension tables wherein the dimension tables intersect the main tables via common columns and wherein the dimension tables are each associated with a column in the main tables corresponding to each of the rows in the dimension tables. Because a
star schema is simple, having few tables, it minimizes the complexity required to process database operations. This helps both to increase performance speed and to ensure correct results of database operations. Therefore many relational databases have been built in a star schema configuration to minimize database management overhead.
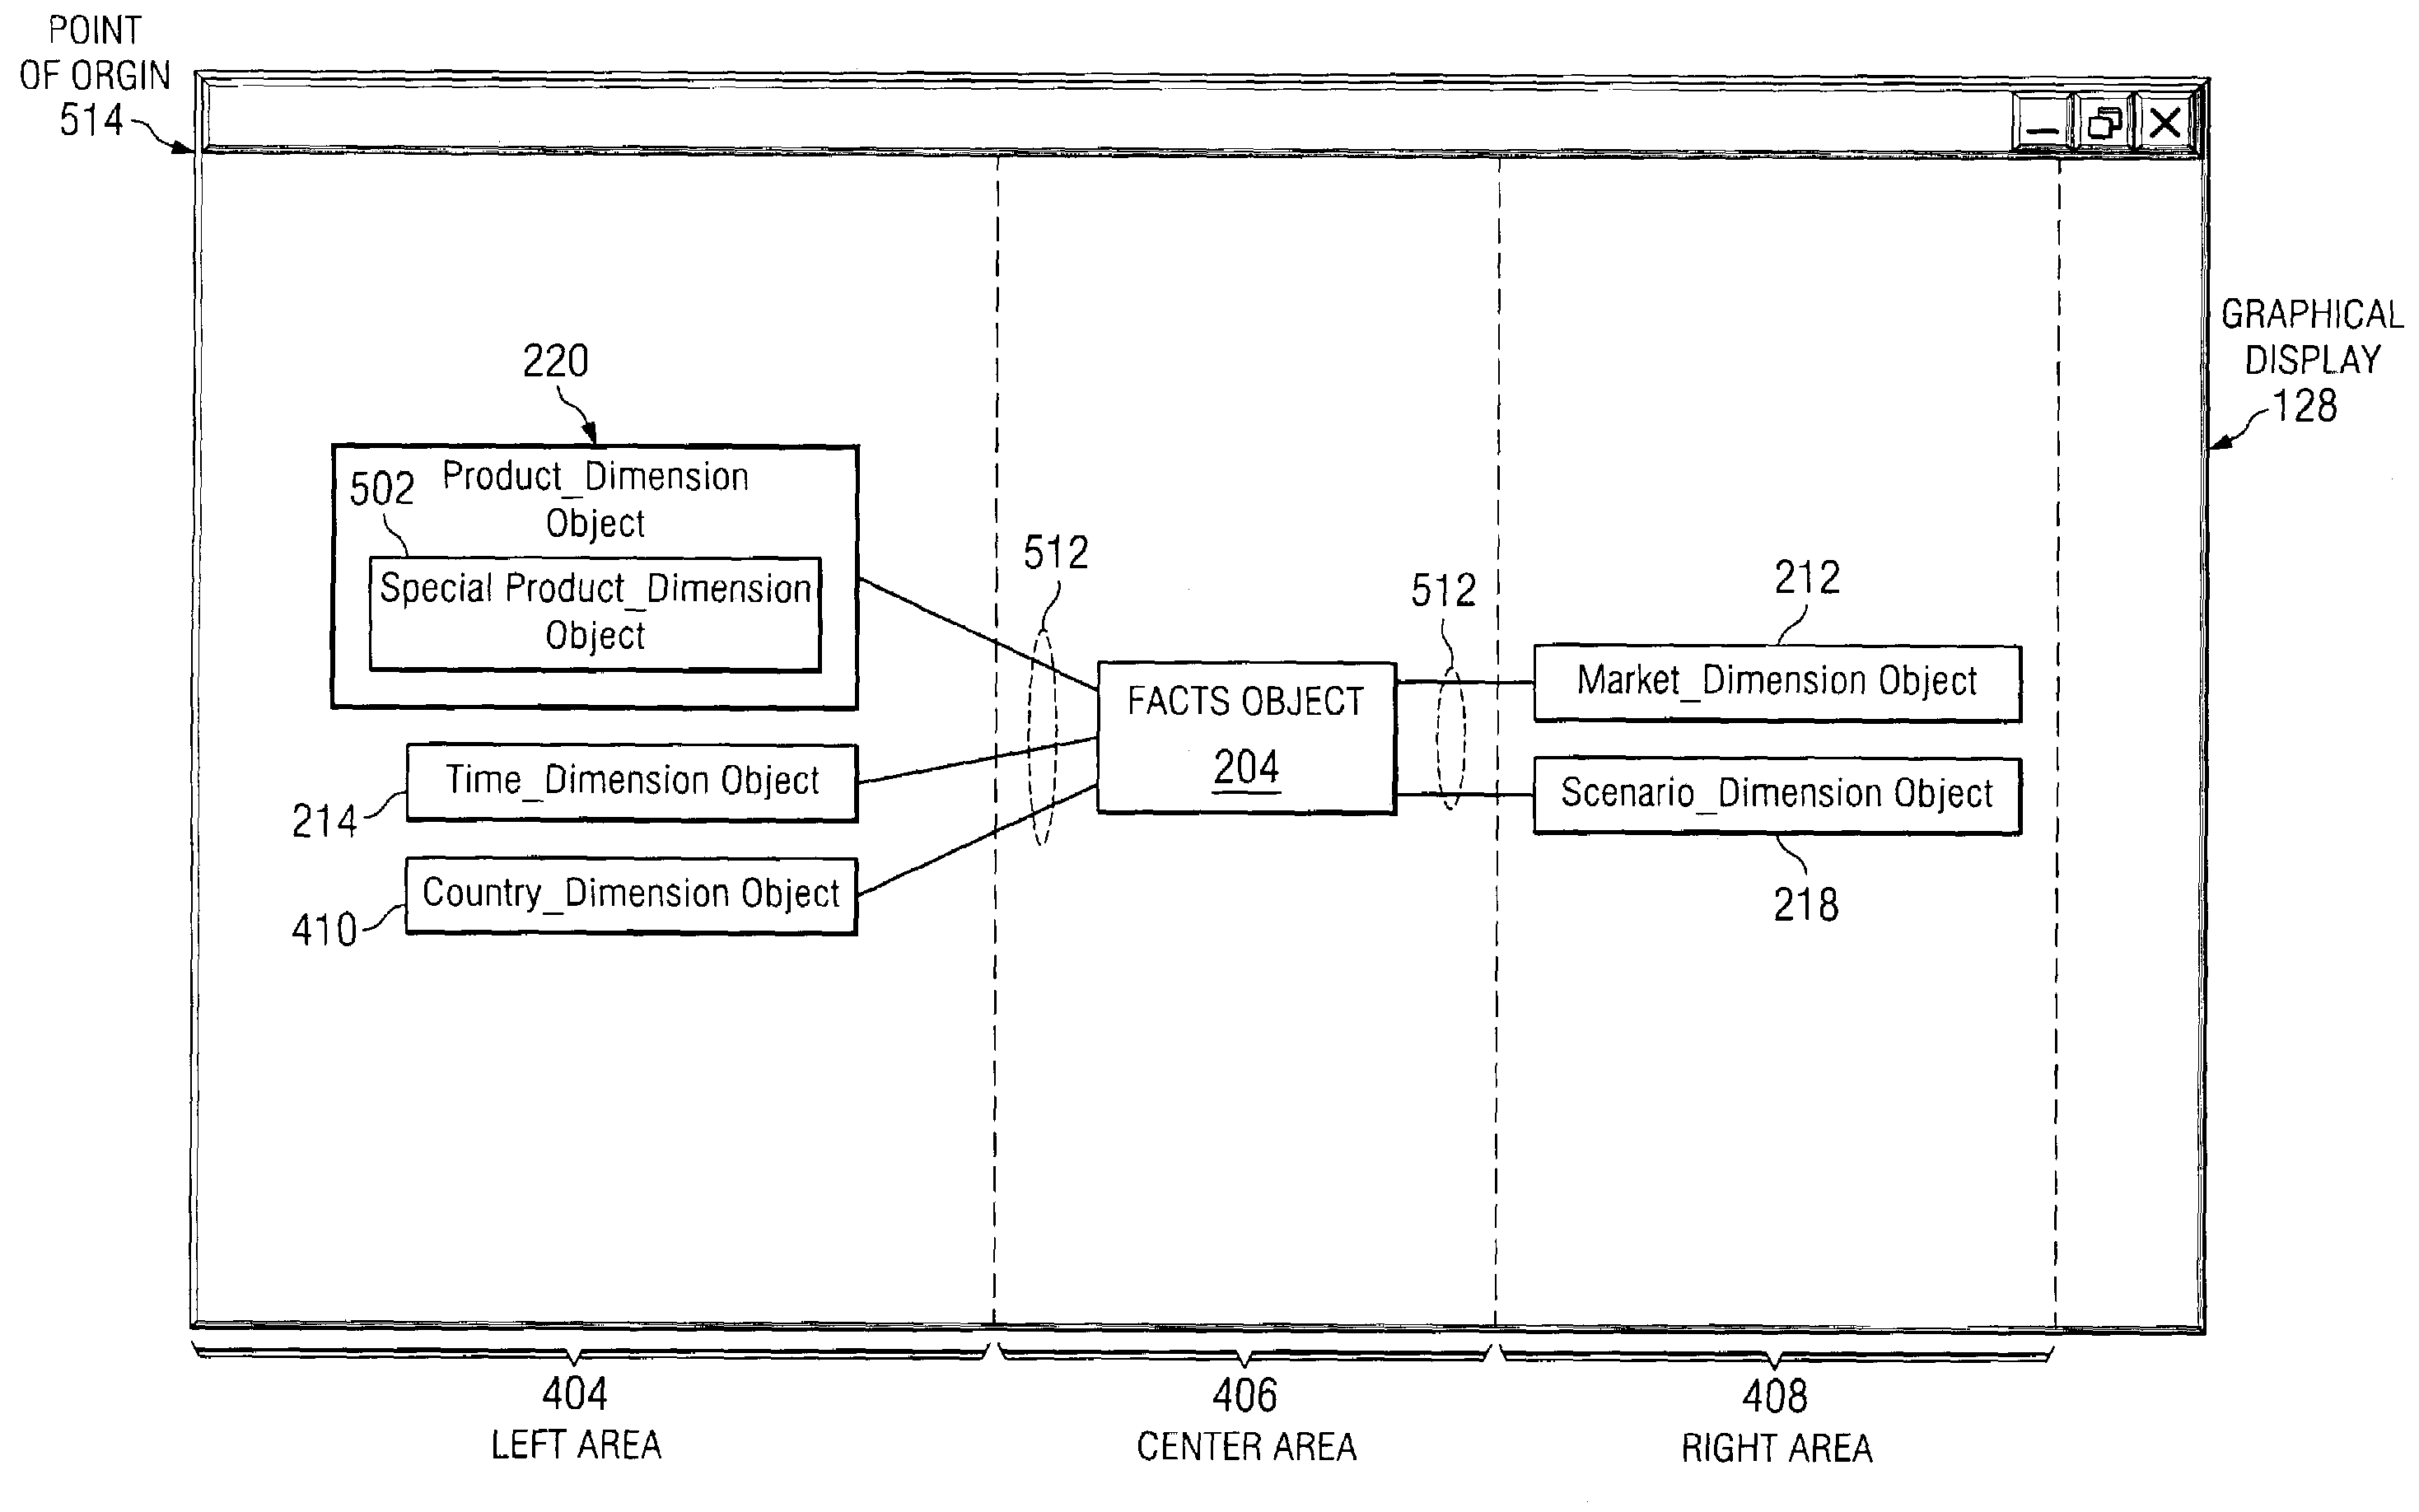
[0016]The preferred embodiment of the present invention splits the graphical display into three areas: a left area, a center area, and a right area. The facts object is placed in the center area and the dimensions are distributed between the left area and the right area. It will be understood that the present invention may operate on a different number of areas, either less than or greater than three areas. When an object is expanded it causes the associated area to also expand, which causes the neighboring areas and their contents, such as objects, to adjust their position, typically by moving, to minimize
distortion and to retain contextual information.
[0018]Also, in one embodiment of the present invention that relies on the star schema configuration, the objects in the left area are right aligned and the objects in the right area are left aligned. The objects in the center area are center aligned. This helps optimize the representation of connecting lines in the graphical display that are used to illustrate associations between the facts objects and the dimension objects. That is, positional justification of objects to ensure that the objects are grouped toward the center of the graphical display reduces the instance of connecting lines crossing over other connecting lines.
[0019]An embodiment of the present invention is achieved by systems, methods, and computer products that improve the graphical display of a large number of objects that may be used with data analysis techniques such as
data mining of relational database information,
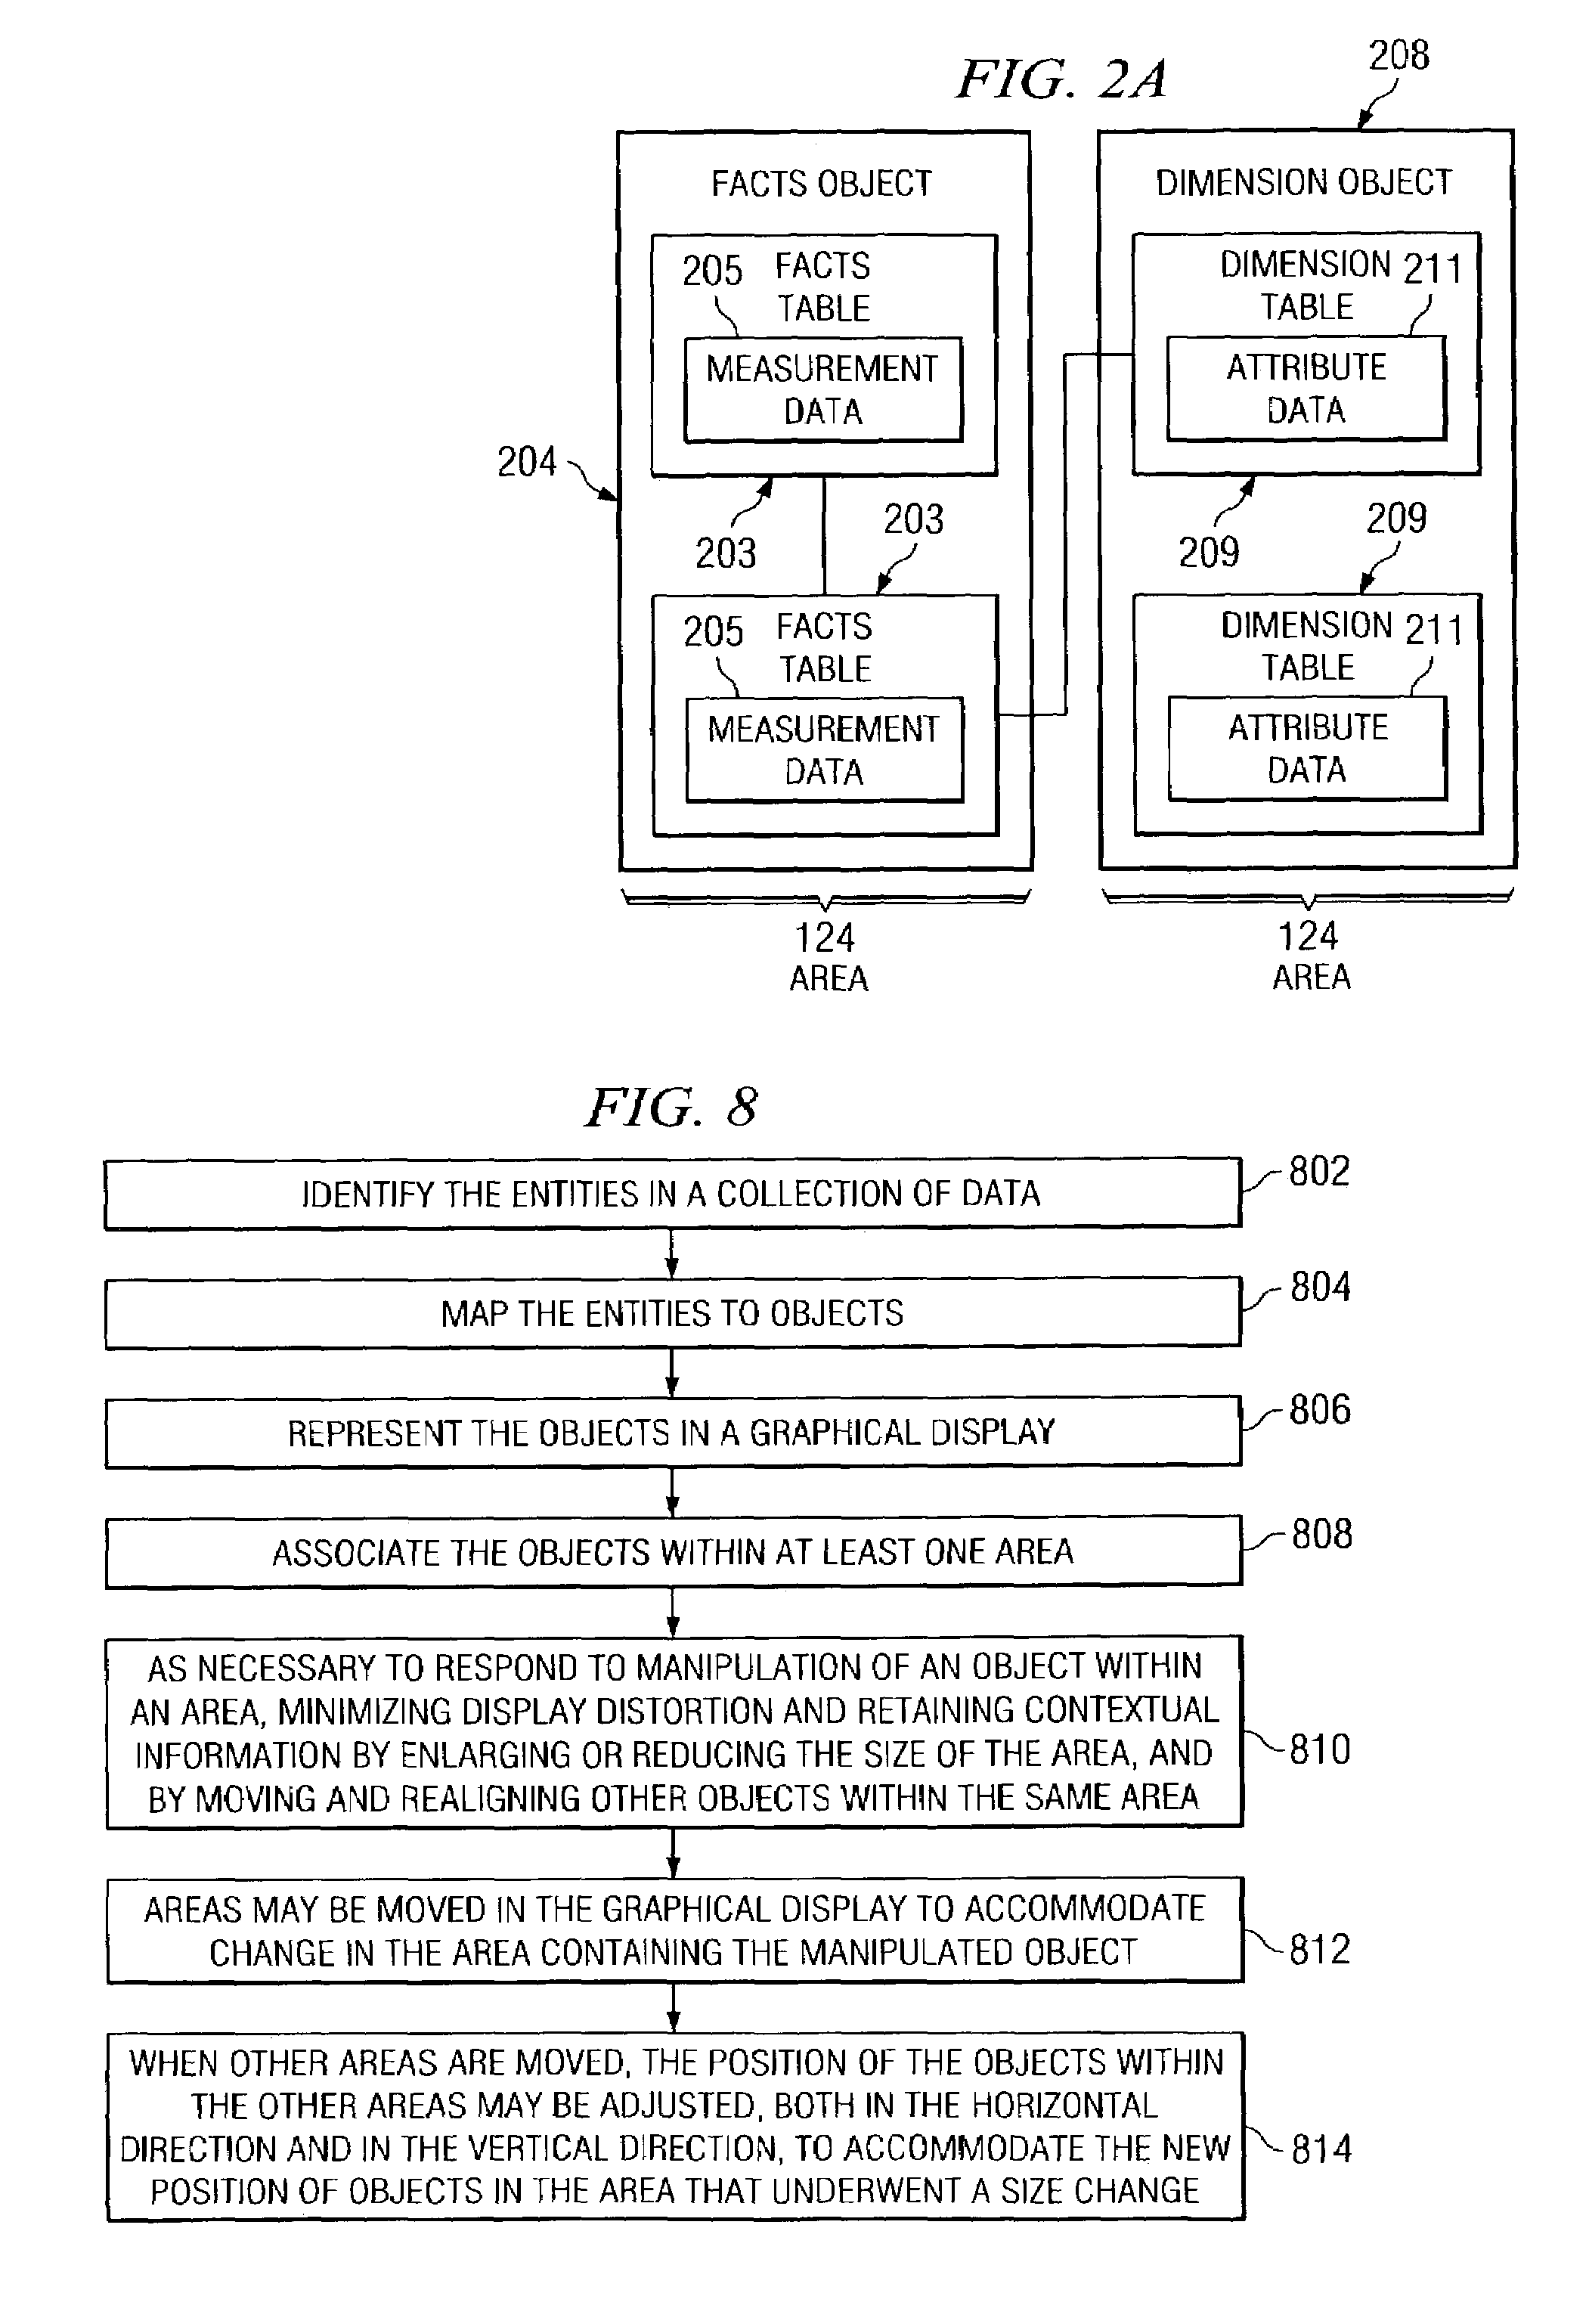
multidimensional data, and OLAP data. A method comprises: (a) identifying the entities in a collection of data, (b) mapping the entities to objects that are represented in a graphical display, (c) identifying the objects in at least one area; (d) associating the objects within each area together by techniques such as showing connecting lines that illustrate associations between objects; (e) as necessary and to respond to manipulation of an object within an area, minimizing display distortion and retaining contextual information by: (i) enlarging or reducing the size of the area, and moving and realigning the other objects within the same area, (ii) moving objects in other areas that have not been adjusted in size to accommodate change in the area containing the manipulated object, and (iii) adjusting the position of objects within other areas, both in the horizontal direction and in the vertical direction, to accommodate the new position of objects in the area that underwent a
size change.

