
Methods for diagnosing glaucoma utilizing combinations of FD-OCT measurements from three anatomical regions of the eye

a technology of fd-oct and combination, applied in the field of glaucoma diagnosis, can solve the problems of information crisis, difficult to interpret and combine diverse sources of information to arrive at meaningful clinical diagnosis, and often miss the early stages of the disease, etc., to achieve easy administration and operation, high glaucoma diagnostic sensitivity and specificity, and easy deployment

Inactive Publication Date: 2011-03-15
UNIV OF SOUTHERN CALIFORNIA
View PDF2 Cites 4 Cited by
  • Summary
  • Abstract
  • Description
  • Claims
  • Application Information

AI Technical Summary

Benefits of technology

The present invention provides a method and system for automatically analyzing and diagnosing glaucoma using optical coherence tomography (OCT) images. The method involves obtaining OCT images from three anatomic regions of the eye, processing the images to obtain a predetermined collection of diagnostic parameters, transforming the parameters to a reduced set of global parameters, and applying a pre-trained machine classifier to the parameters to arrive at a single indicator. The system includes a computing unit for receiving and processing the OCT images, and an input / output unit for outputting the indicator to the end user. The method and system provide a quantitative and automated approach to diagnosing glaucoma, which can help improve the accuracy and efficiency of diagnosis.

Problems solved by technology

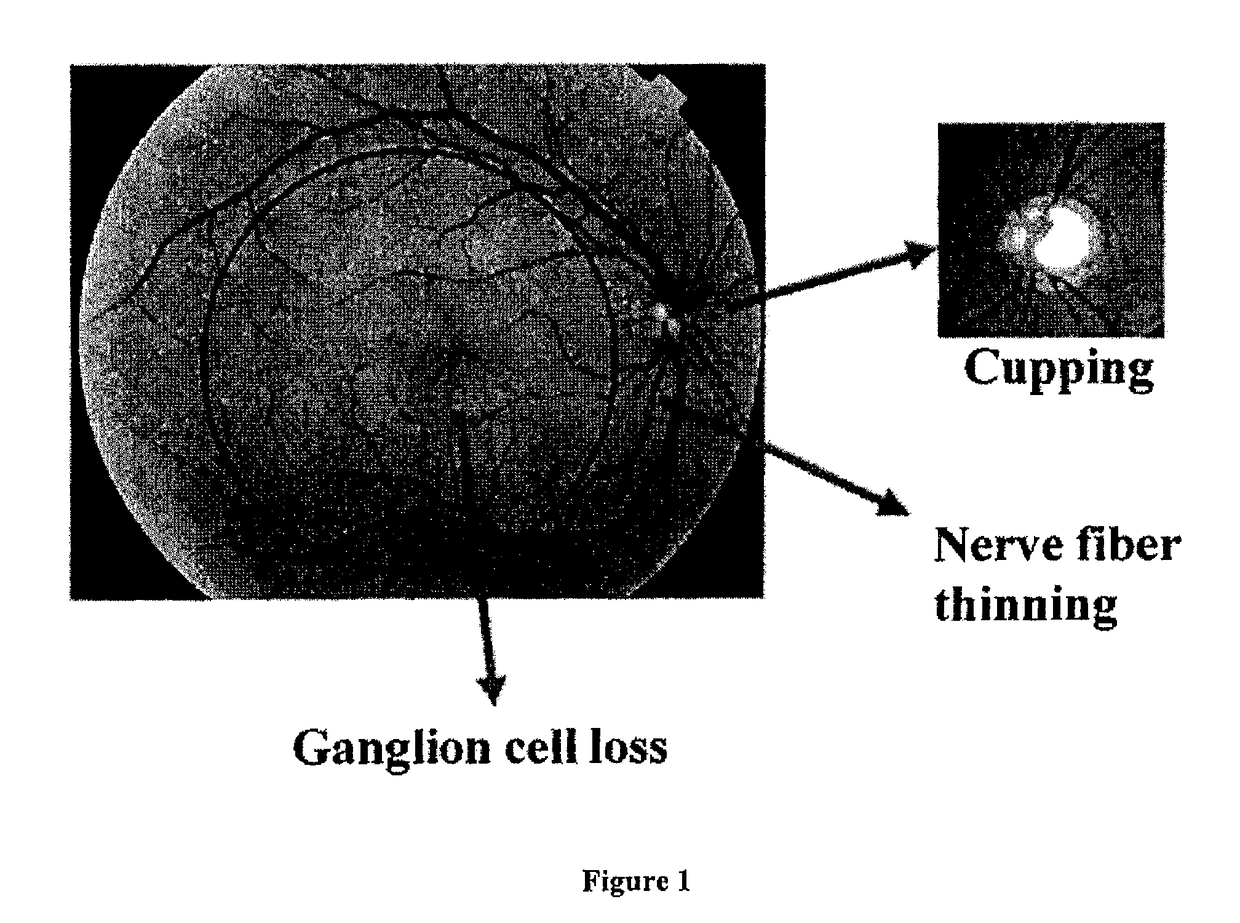
Because there may be significant structural loss before functional loss begin to manifest, these tests often miss early stages of the disease.
Ironically, these technological advances have created an informational crisis.
Given the variety of methods and instrumentations providing a bewilderment of diagnostic information, how to interpret and combine these diverse sources of information to arrive at a meaningful clinical diagnosis has become a major challenge.
Thus, the information has not led to better or easier clinical decision making.

Method used


Image

  • Methods for diagnosing glaucoma utilizing combinations of FD-OCT measurements from three anatomical regions of the eye
  • Methods for diagnosing glaucoma utilizing combinations of FD-OCT measurements from three anatomical regions of the eye
  • Methods for diagnosing glaucoma utilizing combinations of FD-OCT measurements from three anatomical regions of the eye

Examples


example

Three Steps to Combine FD-OCT Parameters from Three Anatomic Regions

Step 1: Combine Parallel Parameters Across mGCC, ppNFL and Rim Regions

[0081]To generate “across region” parameters, a simple method that combines parallel parameters for FLV, GLV, GPCC and PCV across mGCC and ppNFL regions by a weighted sum was considered. This method was computationally inexpensive. The weight was one for each region. It was evaluated by AROC analysis such that the “across region” parameters were combined additively with weight one if no statistical difference between the AROC values of parallel parameters. The weights were proportional to the AROC's and were summed up to two as the statistically difference of AROC values was observed.

Step 2: Combine Inferior, Superior and Overall Region Information

[0082]A global variable from the three across-region GPCC parameters was defined to indicate the worst structural loss reflected by GPCC parameters (maximum among the three GPCC parameters) and denoted b...


PUM


Abstract

This invention discloses methods and systems for diagnosing glaucoma by combining diagnostic parameters derived from optical coherence tomography images of three different anatomic regions of the eye, including the macular ganglion cell complex (mGCC), the peripapillary nerve fiber layer (ppNFL), and the optic nerve head (ONH). The combined diagnostic parameters form a reduced set of global parameters, which are then fed to pre-trained machine classifiers as input to arrive at a single diagnostic indicator for glaucoma. Also disclosed are methods for training a machine classifier to be used in methods and systems of this invention.

Description

CROSS-REFERENCE TO RELATED APPLICATIONS[0001]This application claims the benefit of U.S. Provisional Application No. 61 / 174,463, file on Apr. 30, 2009. The above application(s) is hereby incorporated herein by reference.STATEMENT REGARDING FEDERALLY SPONSORED RESEARCH OR DEVELOPMENT[0002]This invention was made with government support under Contract No. RO1 EY013516 awarded by the National Institute of Health. The government has certain rights in the invention.FIELD OF THE INVENTION[0003]The present invention relates in general to glaucoma diagnosis. More specifically, the invention relates to methods and systems for combining diagnostic information derived from two or three anatomic regions of the eye to arrive at a single diagnostic indicator for glaucoma. The key combinations of anatomic regions are the macular ganglion cell complex, the peripapillary nerve fiber layer, and the optic nerve head; or the macular ganglion cell complex and the peripapillary nerve fiber layer.BACKGROU...

Claims


Application Information

Patent Timeline
Patent Type & Authority Patents(United States)
IPC IPC(8): A61B3/00
CPCA61B3/102A61B3/12G06T7/0012G06T2207/10101G06T2207/20081G06T2207/30041
Inventor HUANG, DAVIDLU, AKETAN, OU
Owner UNIV OF SOUTHERN CALIFORNIA
Learn More