Tumor grading from blood volume maps

a technology of tumor grade and volume map, applied in the field of tumor grade, can solve the problems of not being able to reliably indicate the tumor grade, the degree of contrast enhancement is by no means reliable, and the tumor grade is not conveyed. , to achieve the effect of little leakag

Active Publication Date: 2012-07-31
UNIV OSLO HF
View PDF0 Cites 11 Cited by
  • Summary
  • Abstract
  • Description
  • Claims
  • Application Information

AI Technical Summary

Benefits of technology

[0008]The invention thus provides a method and a system for grading tumors based on BV or cellular metabolism maps, and a method for preparing a correlation data set to be used in such grading. An overall advantage of the invention is that it is much less dependent on subjective user interaction.
[0009]According to a first embodiment, the invention provides a method for grading a tumor on the basis of a map of values representing blood volume or cellular metabolism of a tumor region, the method comprising
[0010]selecting regions of the tumor whose corresponding values in the map are to be applied in the grading, excluding large blood vessels and areas of necrosis;
[0011]defining a plurality of value intervals and counting the number of values of the selected regions within each interval to determine a frequency distribution of values in the selected regions;
[0012]assessing a tumor grade based on the frequency distribution, where the more heterogeneous distribution corresponds to a higher grade.
[0013]Similarly, in a second embodiment, the invention provides a system for providing parameters to be used in grading tumors, the system comprising

Problems solved by technology

While being excellent for determining position and size, these techniques convey little information about the functional status of the tumor tissue or adjacent tissue (e.g. degree of angiogenesis, tissue viability, malignancy, etc).
Although tumor malignancy to some extent may be suggested indirectly by contrast enhanced imaging, several studies have shown that the degree of contrast enhancement is by no means a reliable indicator of tumor grade.
However, there are several limitations to this method.
First, the selection of glioma hot-spot is highly user-dependent and differentiation between vessels and tumor region of true blood volume elevation can be challenging and a source of error.
Secondly, since only a few image pixels are typically used to determine the rCBV hot-spot, the method is inherently sensitive to image noise and other sources of spurious pixel values (e.g. spikes introduced by the algorithms used to generate the nCBV maps).
However, incorrect selection of reference rCBV values might result in either under- or overestimation of nCBV values.
As a result, cut-off nCBV values between high-grade and low-grade gliomas might be harder to establish if oligodendrogliomas are included.
Also, a mean nCBV has the disadvantage of not reflecting the diversity of values in the tumor.

Method used


Image

  • Tumor grading from blood volume maps
  • Tumor grading from blood volume maps
  • Tumor grading from blood volume maps

Examples


Embodiment Construction

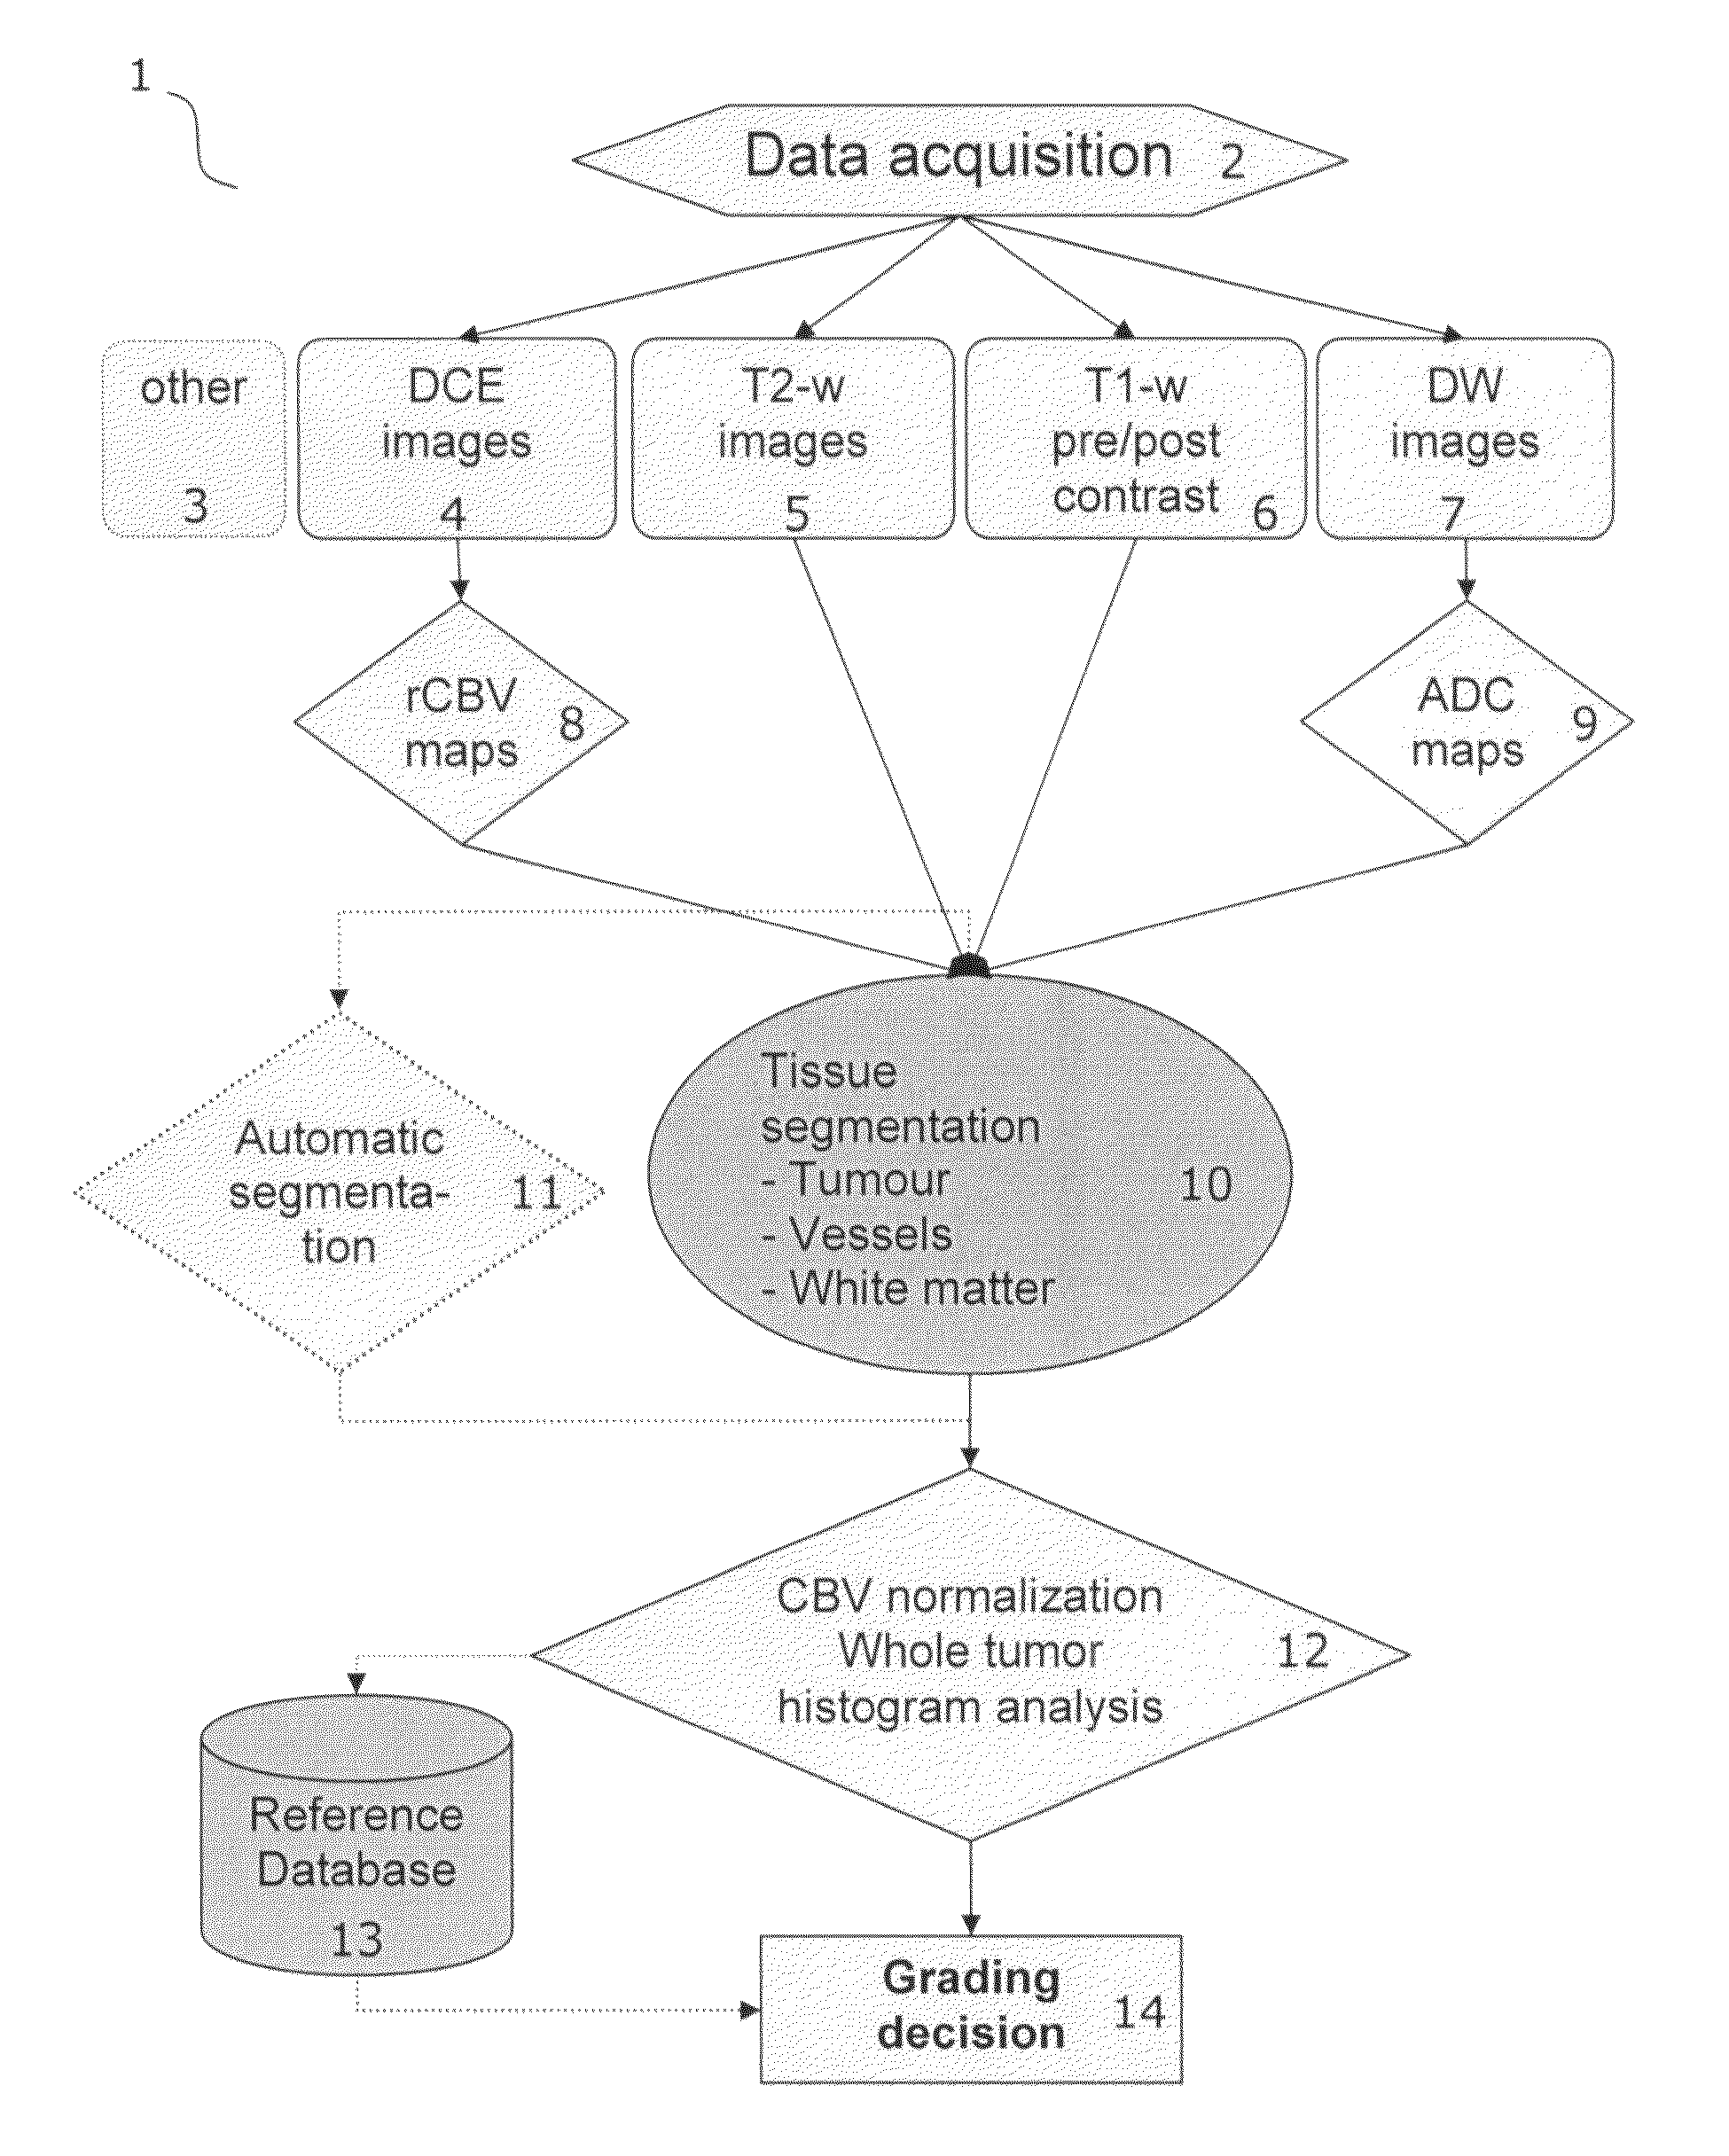
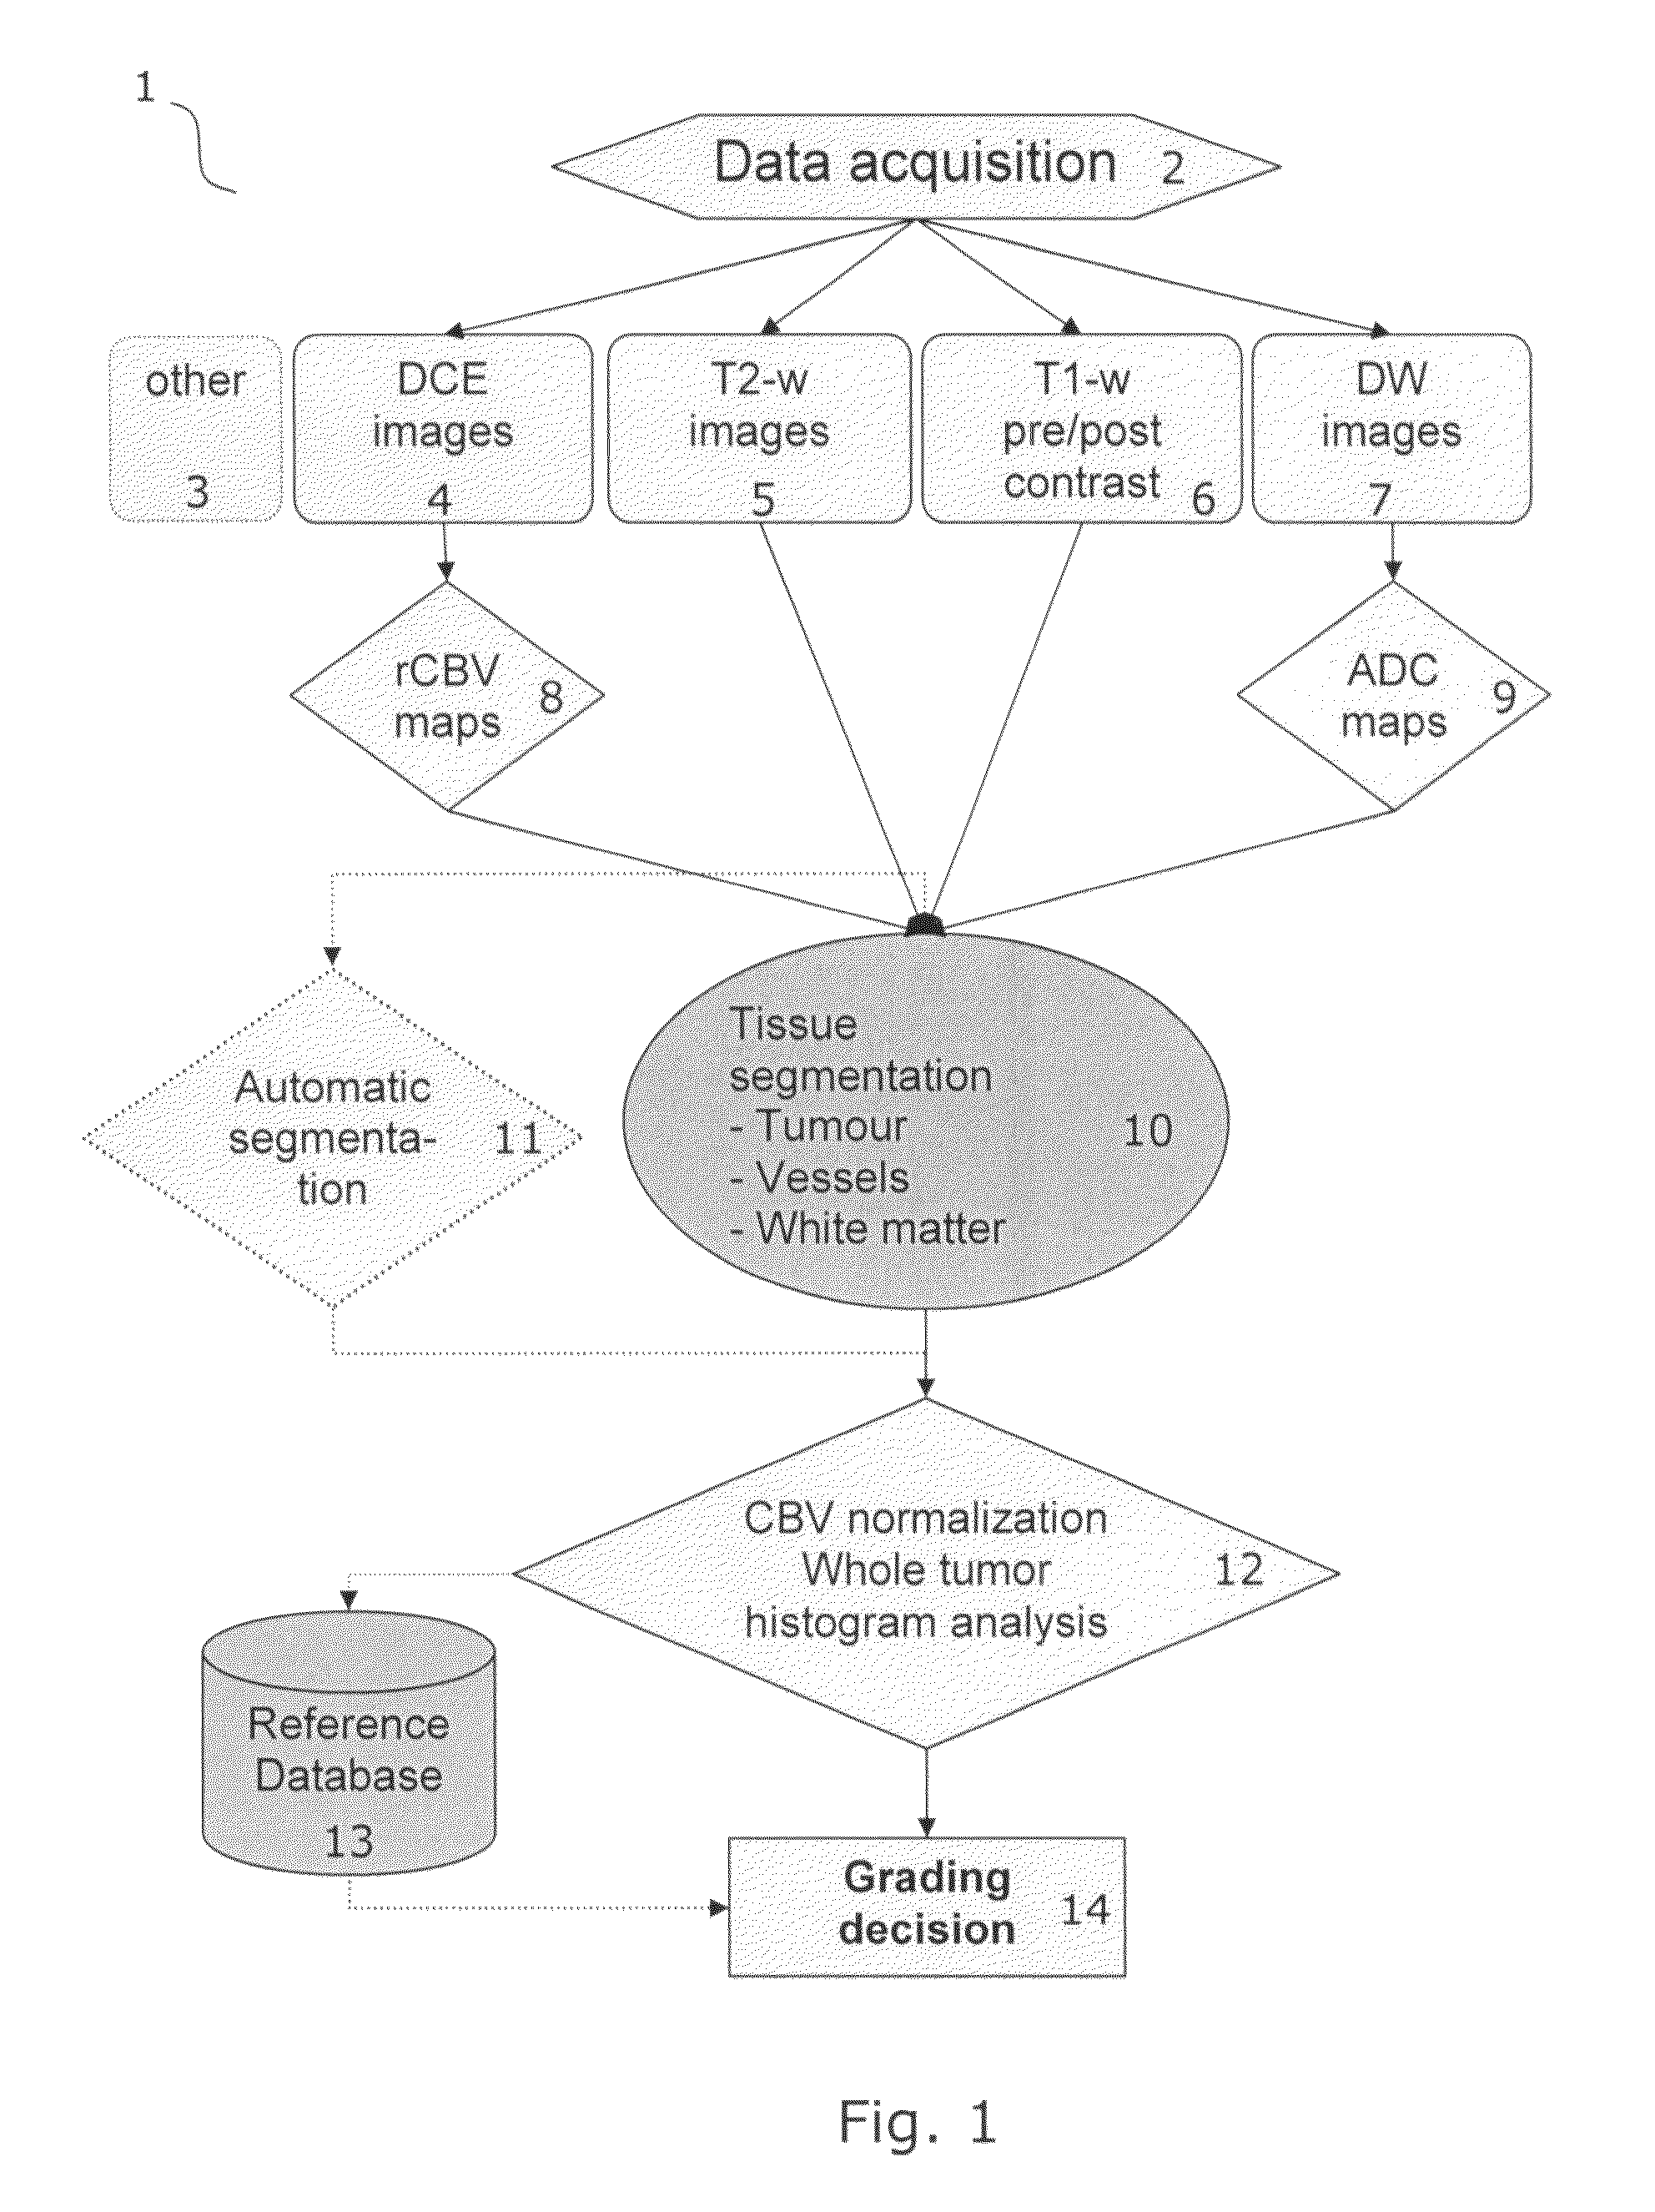
[0063]FIG. 1 is a flow diagram 1 used in the following to embody various embodiments of the invention. The flow diagram 1 outlines and embodies the process steps comprised in the method for grading a tumor according to an embodiment of the invention. The flow diagram 1 outlines and embodies the system architecture, such as software architecture, of the system for providing parameters to be used in grading tumors according to an embodiment of the invention. Also, the flow diagram 1 outlines and embodies the process steps comprised in the method for preparing a correlation data set for use in grading a tumor according to an embodiment of the invention. Although described in relation to the example of CBV maps of brain tumors obtained by perfusion MRI, the corresponding process or architecture can be applied to techniques applied by other embodiments of the invention.

[0064]First, the data used to form maps representing blood volume or cellular metabolism and to perform tissue segmentat...


PUM


Abstract

An embodiment of the invention is to make possible a non-invasive grading of a tumor based on parameters determined from a frequency distribution (histogram) of values in a map representing cerebral blood volume (CBV) or cellular metabolism in the tumor. The method is especially applicable to brain tumors such as gliomas where histological grading is difficult. The invention provides a precise and consistent grading since it relies on values selected from the whole tumor (not just from hot spots); since it takes the diversity or heterogeneity of the vascularization into account by analyzing the frequency distribution (not just a mean value); and since it involves and allows for a more automated procedure wherein any subjective contributions from human operators is not critical to the resulting grading. CBV maps may be obtained by perfusion imaging using MRI or CT scanning. Cellular metabolism maps may be obtained from a glucose metabolism map obtained by positron emission tomography (PET).

Description

FIELD OF THE INVENTION[0001]The present invention relates to tumor grading, in particular tumor grading by analysis of blood volume maps obtained by e.g. perfusion imaging using contrast agents.BACKGROUND OF THE INVENTION[0002]It is often of interest to locate and characterize tumors in a non-invasive manner, this is especially relevant for brain tumors (gliomas) due to their inherent inaccessibility. Here, MRI (Magnetic Resonance Imaging) and CT (Computed tomography) imaging are typically the imaging methods of choice. While being excellent for determining position and size, these techniques convey little information about the functional status of the tumor tissue or adjacent tissue (e.g. degree of angiogenesis, tissue viability, malignancy, etc). Although tumor malignancy to some extent may be suggested indirectly by contrast enhanced imaging, several studies have shown that the degree of contrast enhancement is by no means a reliable indicator of tumor grade. Based on these short...

Claims


Application Information

Patent Timeline
Patent Type & Authority Patents(United States)
IPC IPC(8): A61B5/05
CPCG06T7/0012G06T7/0081A61B6/501A61B6/507G06T2207/30016G06T2207/30096G06T2207/10072G06T7/11
Inventor BJORNERUD, ATLEEMBLEM, KYRRE EEG
Owner UNIV OSLO HF
Why Eureka
Try Eureka