Generation, display, and manipulation of measurements in computer graphical designs

a technology of computer graphical design and measurement information, applied in the field of graphical display by computer systems, can solve the problems of major productivity bottleneck and incorrect corresponding display rulers, and achieve the effects of reducing display visual clutter, and facilitating user interaction

Active Publication Date: 2014-04-29
CADENCE DESIGN SYST INC
View PDF13 Cites 2 Cited by
  • Summary
  • Abstract
  • Description
  • Claims
  • Application Information

AI Technical Summary

Benefits of technology

[0009]The embodiments described herein allow a user to work efficiently within a graphical interface and design image by providing displayed measurements for shapes in the design. Various embodiments described herein include embodiments providing automatically-generated measurements, filtered or altered displayed measurements according to user preferences or defined rules, and reduction of displayed visual clutter caused by measurements, thereby providing the user with desired information about features of the design and leading to greater design efficiency and user satisfaction.

Problems solved by technology

Thus, manual placement of rulers in a graphical design involves numerous operations and is often a major productivity bottleneck.
Furthermore, after a user has drawn all the rulers manually in the design, the user may want to alter some of the dimensions and / or positions of shapes or other features of the design.
However, in current design software, the rulers display static measurements, and so any changes to shapes would cause corresponding displayed rulers to become incorrect.

Method used


Image

  • Generation, display, and manipulation of measurements in computer graphical designs
  • Generation, display, and manipulation of measurements in computer graphical designs
  • Generation, display, and manipulation of measurements in computer graphical designs

Examples


Embodiment Construction

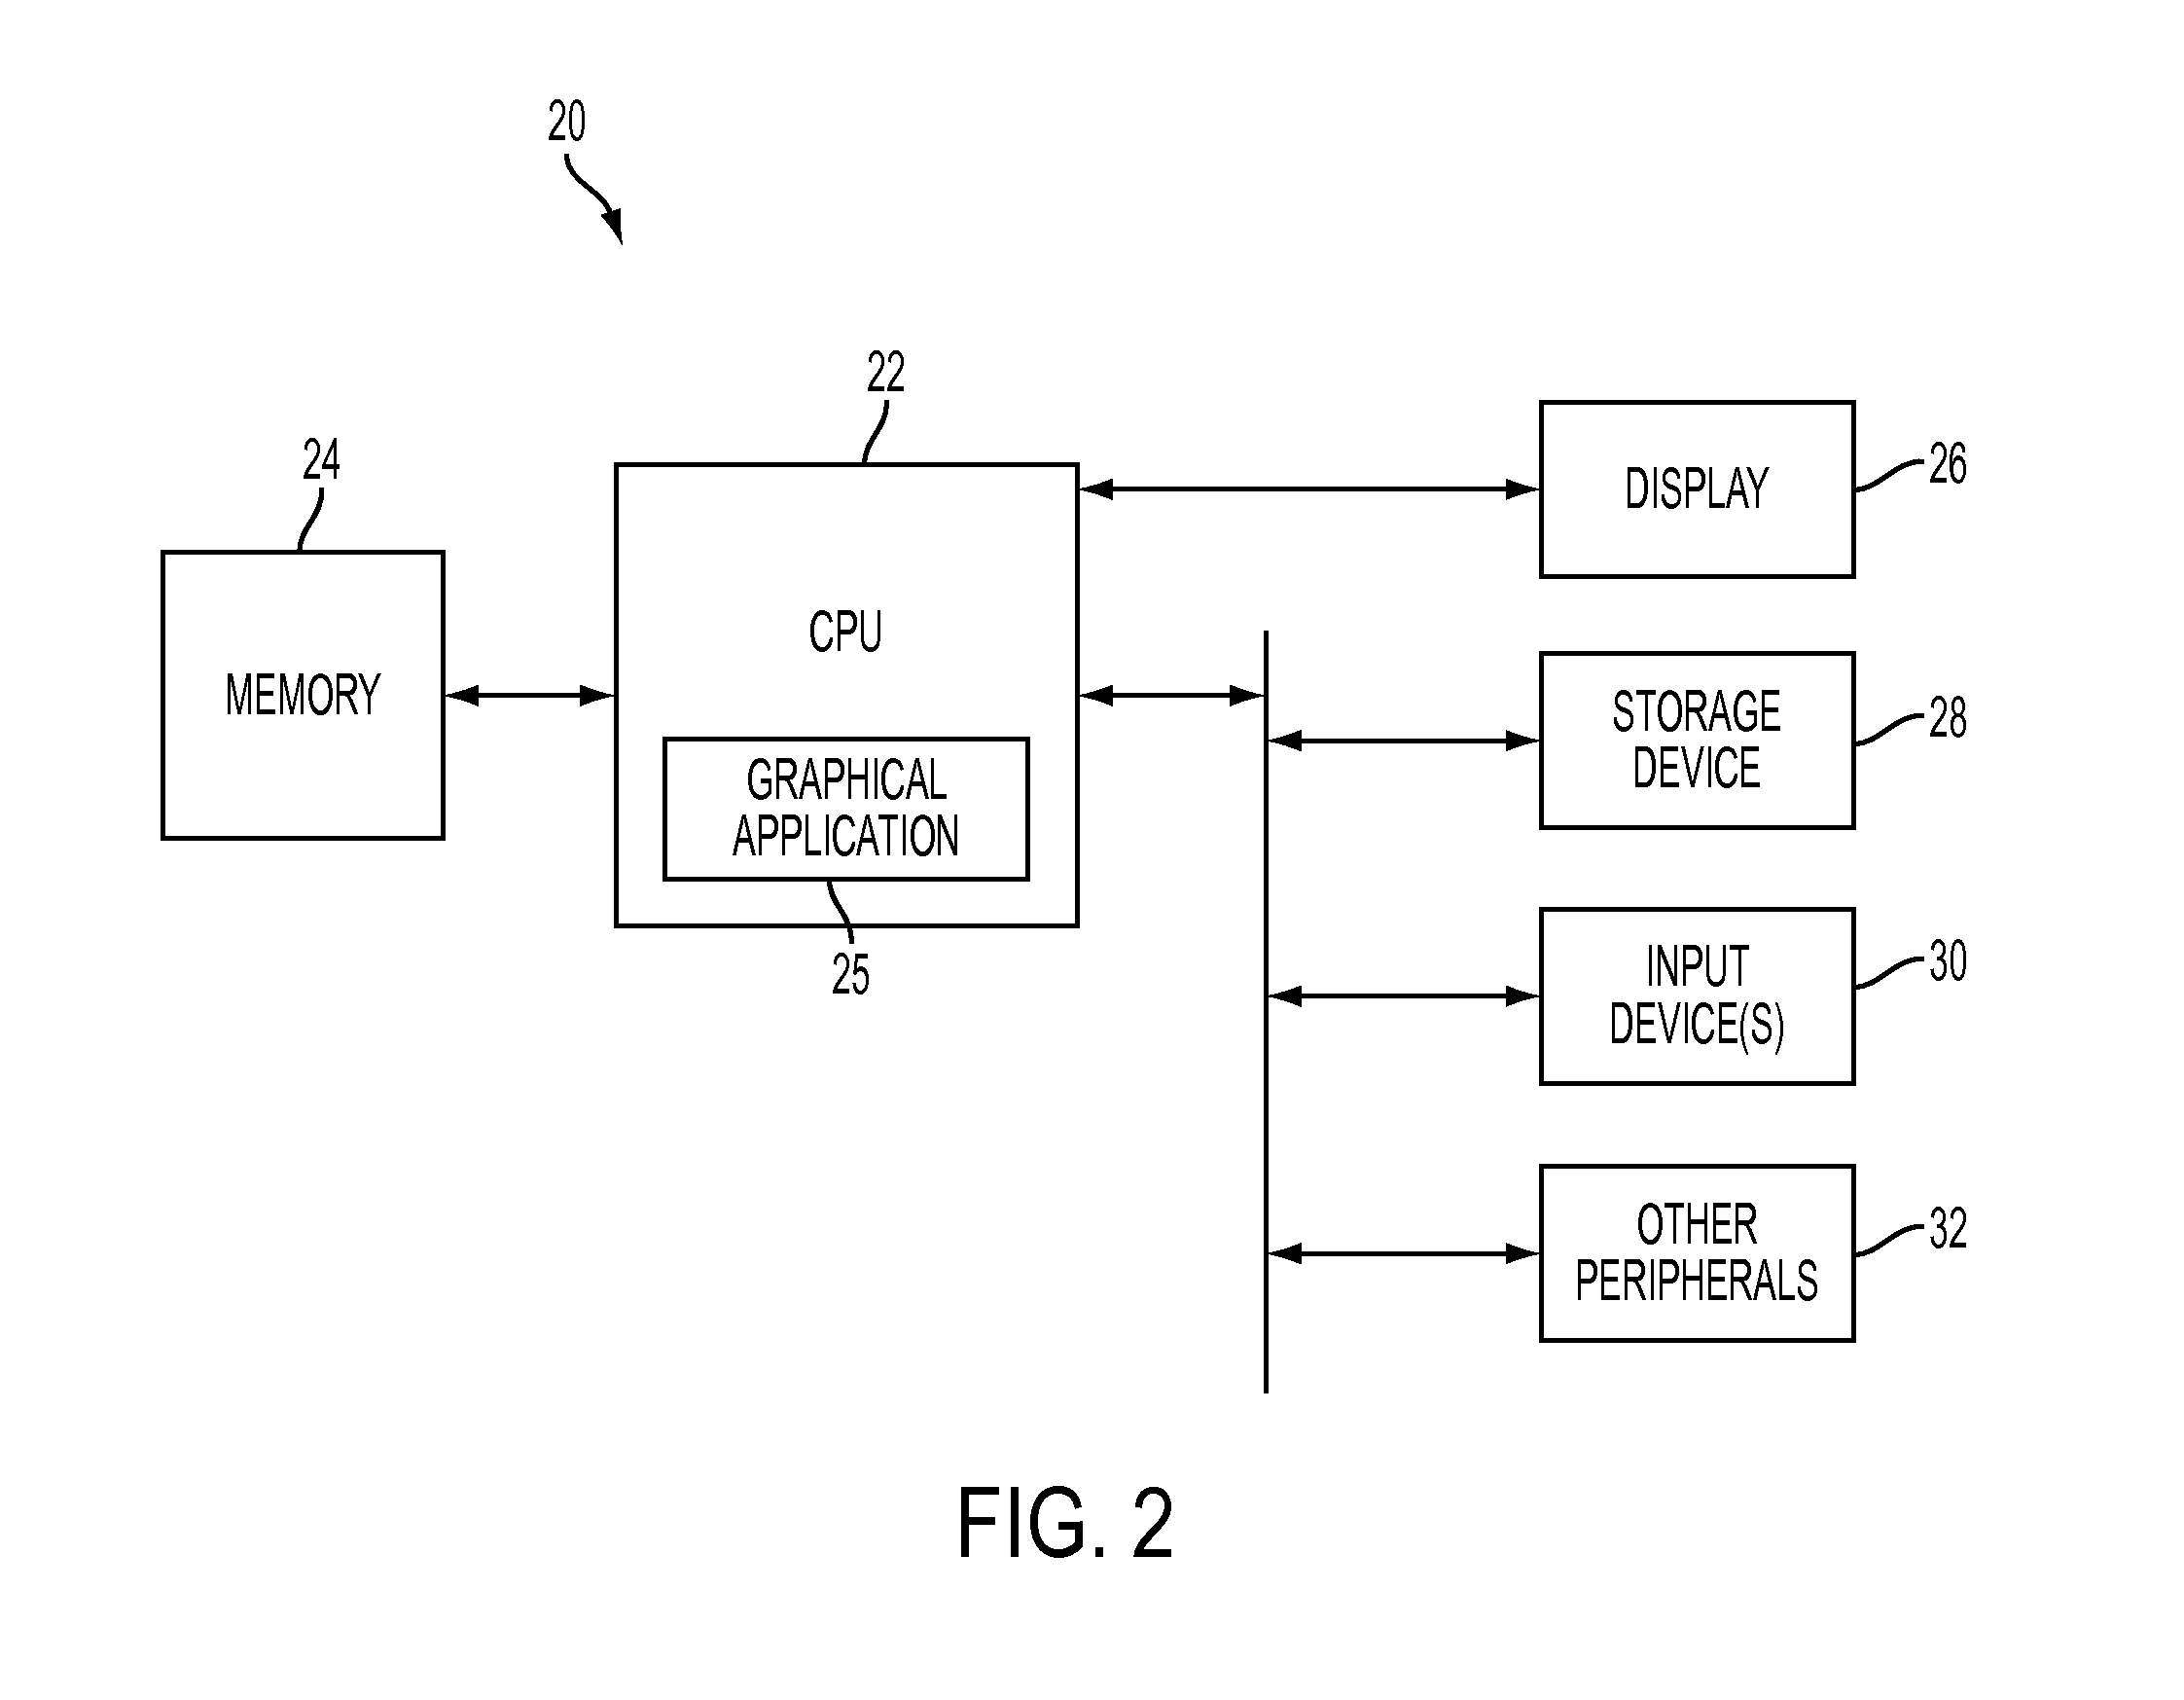
[0025]The present inventions relate to graphical display by computer systems, and more particularly to displaying graphical measurement information in graphical designs using a computer system. The following description is presented to enable one of ordinary skill in the art to make and use the inventions and is provided in the context of a patent application and its requirements. Various modifications to the preferred embodiment and the generic principles and features described herein will be readily apparent to those skilled in the art. Thus, the inventions are not intended to be limited to the embodiments shown but are to be accorded the widest scope consistent with the principles and features described herein.

[0026]The embodiments herein are mainly described in terms of particular methods and systems provided in particular implementations. However, one of ordinary skill in the art will readily recognize that these methods and systems will operate effectively in other implementat...


PUM


Abstract

Display of measurements in a graphical design on a computer system. In one aspect, shapes are displayed in an image, and a definition of a defined area of the image is received. One or more measurements are determined for one or more of the shapes displayed within the predefined area, the one or more measurements determined automatically without a user designating endpoints for the measurements. The one or more measurements are displayed as being associated with the one or more shapes.

Description

FIELD OF THE INVENTION[0001]The present invention relates to graphical display by computer systems, and more particularly to displaying graphical measurement information in graphical designs using a computer system.BACKGROUND OF THE INVENTION[0002]Computer-enabled graphical display and editing systems are used in a wide variety of different applications and industries to view and edit different types of visual images and designs on computer systems or other electronic devices. One common application is electronic design automation, including such applications as layout design, in which the designs for components and spatial layout of electronic components such as integrated circuits and circuit boards are viewed, created and edited using displayed images in graphical software applications. Custom layout design involves rapid manual activity of a designer, where productivity is the key. Improvements in designer productivity, especially involving the more repetitive activities, lead t...

Claims


Application Information

Patent Timeline
Patent Type & Authority Patents(United States)
IPC IPC(8): G09G5/00
CPCG06F17/50G09G5/00G06F17/5081G06F30/398
Inventor MAJUMDER, CHAYANO'RIORDAN, DONALD J.PARAMESWARAN, HARINDRANATH
Owner CADENCE DESIGN SYST INC
Why Eureka
Try Eureka