Brewing white spirit and alcohol concocted white spirit discrimination method
A technology of liquor and alcohol, which is applied in the field of identification of brewed liquor and alcohol blended liquor, can solve the problem of difficult sensory indicators, and achieve the effect of avoiding the calculation process
- Summary
- Abstract
- Description
- Claims
- Application Information
AI Technical Summary
Problems solved by technology
Method used
Image

Examples
Embodiment 1
[0088] Example 1: Identification of Fen-flavor Brewed Liquor and Liquor Clear Blended Liquor
[0089] (1) Establish fingerprints of brewed liquor and alcohol blended liquor
[0090] a. Preparation of test samples.
[0091] According to the national standards for blending liquor, an enterprise is entrusted to prepare alcohol-blended liquor and provide brewed liquor, including 10 samples of brewed liquor and 7 samples of alcohol-blended liquor.
[0092] b. Carry out coulometric array high performance liquid chromatography detection on the test sample.
[0093] Instrument: Model 5600A produced by ESA Company in the United States, equipped with a high performance liquid chromatograph (HPLC-ECD) with a Coulomb array electrochemical detector.
[0094] Methanol and acetonitrile are chromatographically pure, sodium dihydrogen phosphate is analytically pure, and water is distilled water.
[0095] Chromatographic conditions: Phase A in the mobile phase is: 30mmol aqueous solution of ...
Embodiment 2
[0130] Example 2: Classify and identify liquors with different blending ratios
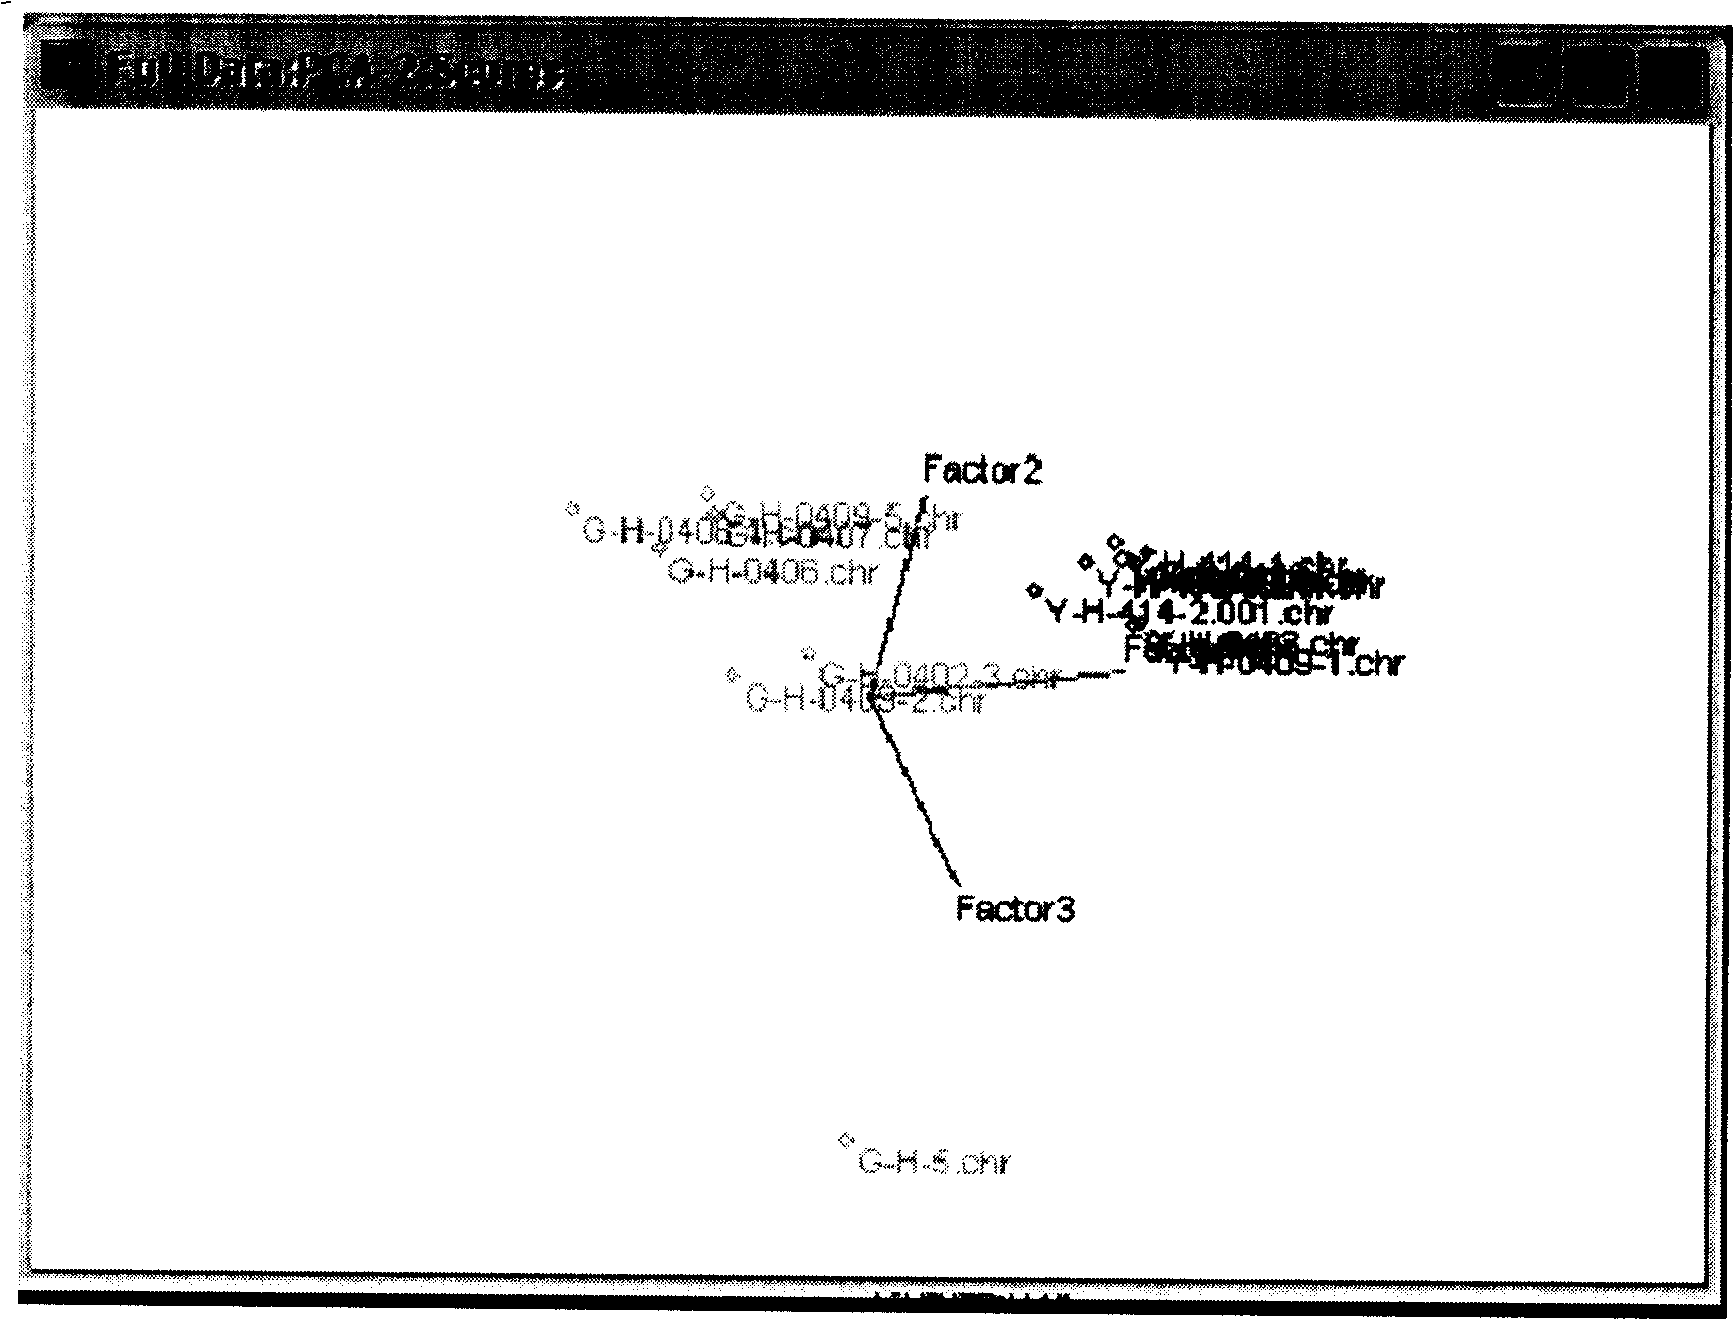
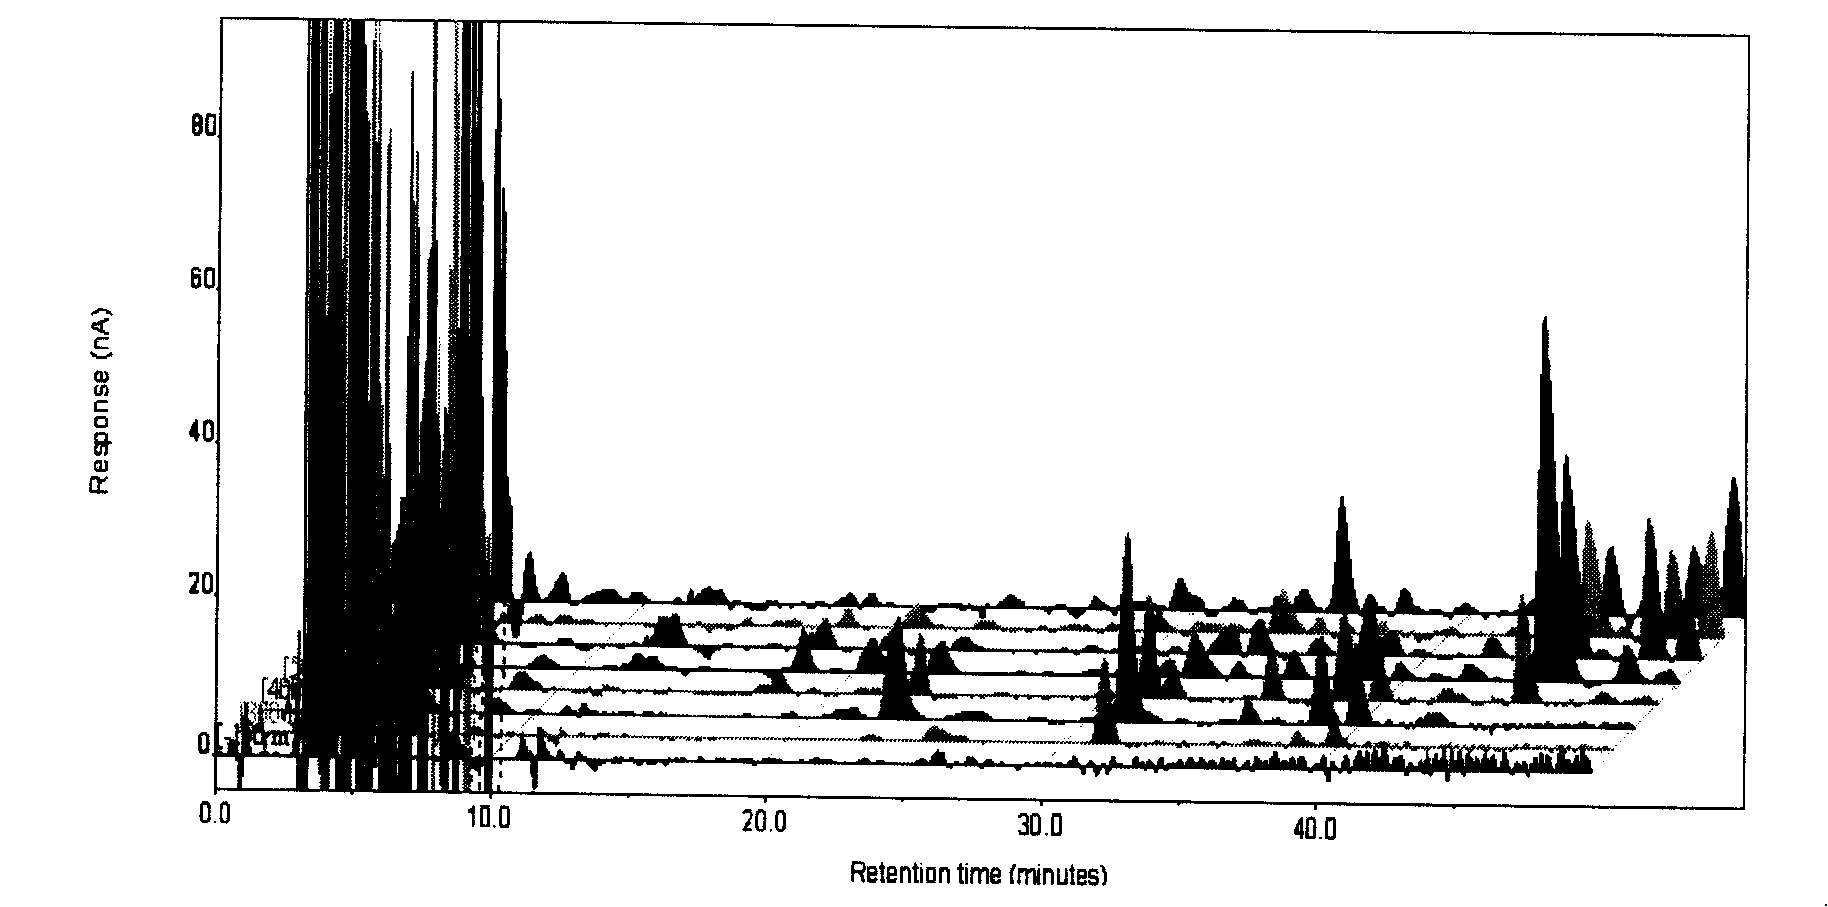
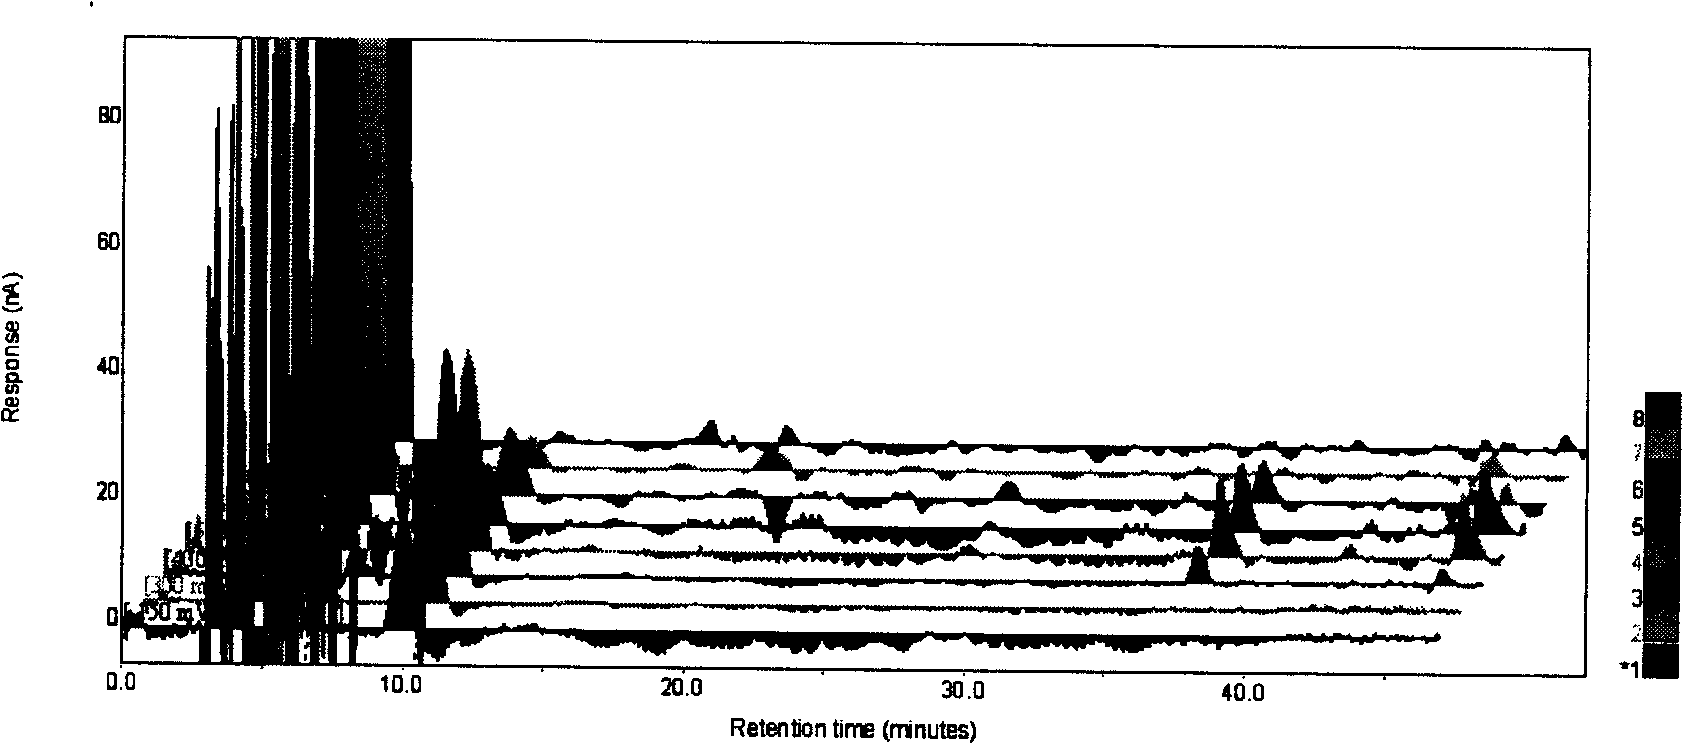
[0131] Four different proportions of brewed liquor (100%, 75%, 15% and 10%) were selected for high-performance liquid chromatography analysis, and the analysis method was the same as in Example 1. The liquid chromatograms of four different proportions of brewed liquor are shown in Figure 17 As shown in Figure 20, from each figure, it is obvious to distinguish liquors with a concentration below 15% and above 75%, and there is little difference between the spectra between 10% and 15%, 75% and 100%, and because the peak There are so many that it is difficult to intuitively select substances for comparison. A large amount of data in the spectrogram was further statistically analyzed using the Pirouette data processing software using the fingerprint model established above. For the data map, please see Figure 21 .
[0132] Cluster analysis was performed on four liquor samples with different concen...
PUM
 Abstract
Description
Claims
Application Information
 - R&D
- Intellectual Property
- Life Sciences
- Materials
- Tech Scout
- Unparalleled Data Quality
- Higher Quality Content
- 60% Fewer Hallucinations
Browse by: Latest US Patents, China's latest patents, Technical Efficacy Thesaurus, Application Domain, Technology Topic, Popular Technical Reports.
© 2025 PatSnap. All rights reserved.Legal|Privacy policy|Modern Slavery Act Transparency Statement|Sitemap|About US| Contact US: help@patsnap.com