Method for modeling rice and wheat leaf nitrogen content spectrum monitoring model
A technology of model modeling and spectral monitoring, applied in measurement devices, material analysis by optical means, instruments, etc., can solve problems such as poor timeliness, poor sensitivity, and large differences in spectral reflectance, to enhance the mechanism, improve Good sensitivity and universality
- Summary
- Abstract
- Description
- Claims
- Application Information
AI Technical Summary
Problems solved by technology
Method used
Image
Examples
Embodiment Construction
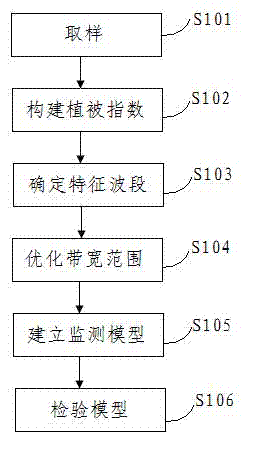
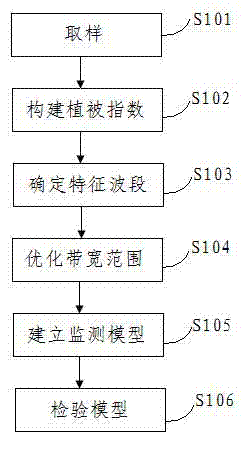
[0032] In this example, the field hyperspectral radiometer collected the reflectance spectrum data of rice and wheat canopy leaves in different farmlands, different years, different varieties, different nitrogen application levels, different water treatments and different growth stages and fused with the nitrogen content data of canopy leaves Construct the optimal rice-wheat vegetation index SAVI from jointing to booting stage, and the optimal vegetation index DVI, RVI and NDVI from heading to filling stage, and tap the common sensitive band λ of nitrogen content in rice-wheat canopy leaves 1 =722nm, λ 2 =812nm, to establish the monitoring model of nitrogen content in the rice and wheat canopy:
[0033] Rice: jointing to booting stage: Y 1 =-4.314 SAVI(R 722 , R 812 )+1.435
[0034] Heading to filling period: Y 2 =-7.588DVI(R 722 , R 812 )+0.779
[0035] or Y 3 =-4.409RVI(R 722 , R 812 ) +4.119
[0036] or Y 4 = -4.656NDVI(R 722 , R 812 )+0.303
[0037] Wheat: ...
PUM
 Abstract
Description
Claims
Application Information
 - R&D
- Intellectual Property
- Life Sciences
- Materials
- Tech Scout
- Unparalleled Data Quality
- Higher Quality Content
- 60% Fewer Hallucinations
Browse by: Latest US Patents, China's latest patents, Technical Efficacy Thesaurus, Application Domain, Technology Topic, Popular Technical Reports.
© 2025 PatSnap. All rights reserved.Legal|Privacy policy|Modern Slavery Act Transparency Statement|Sitemap|About US| Contact US: help@patsnap.com


