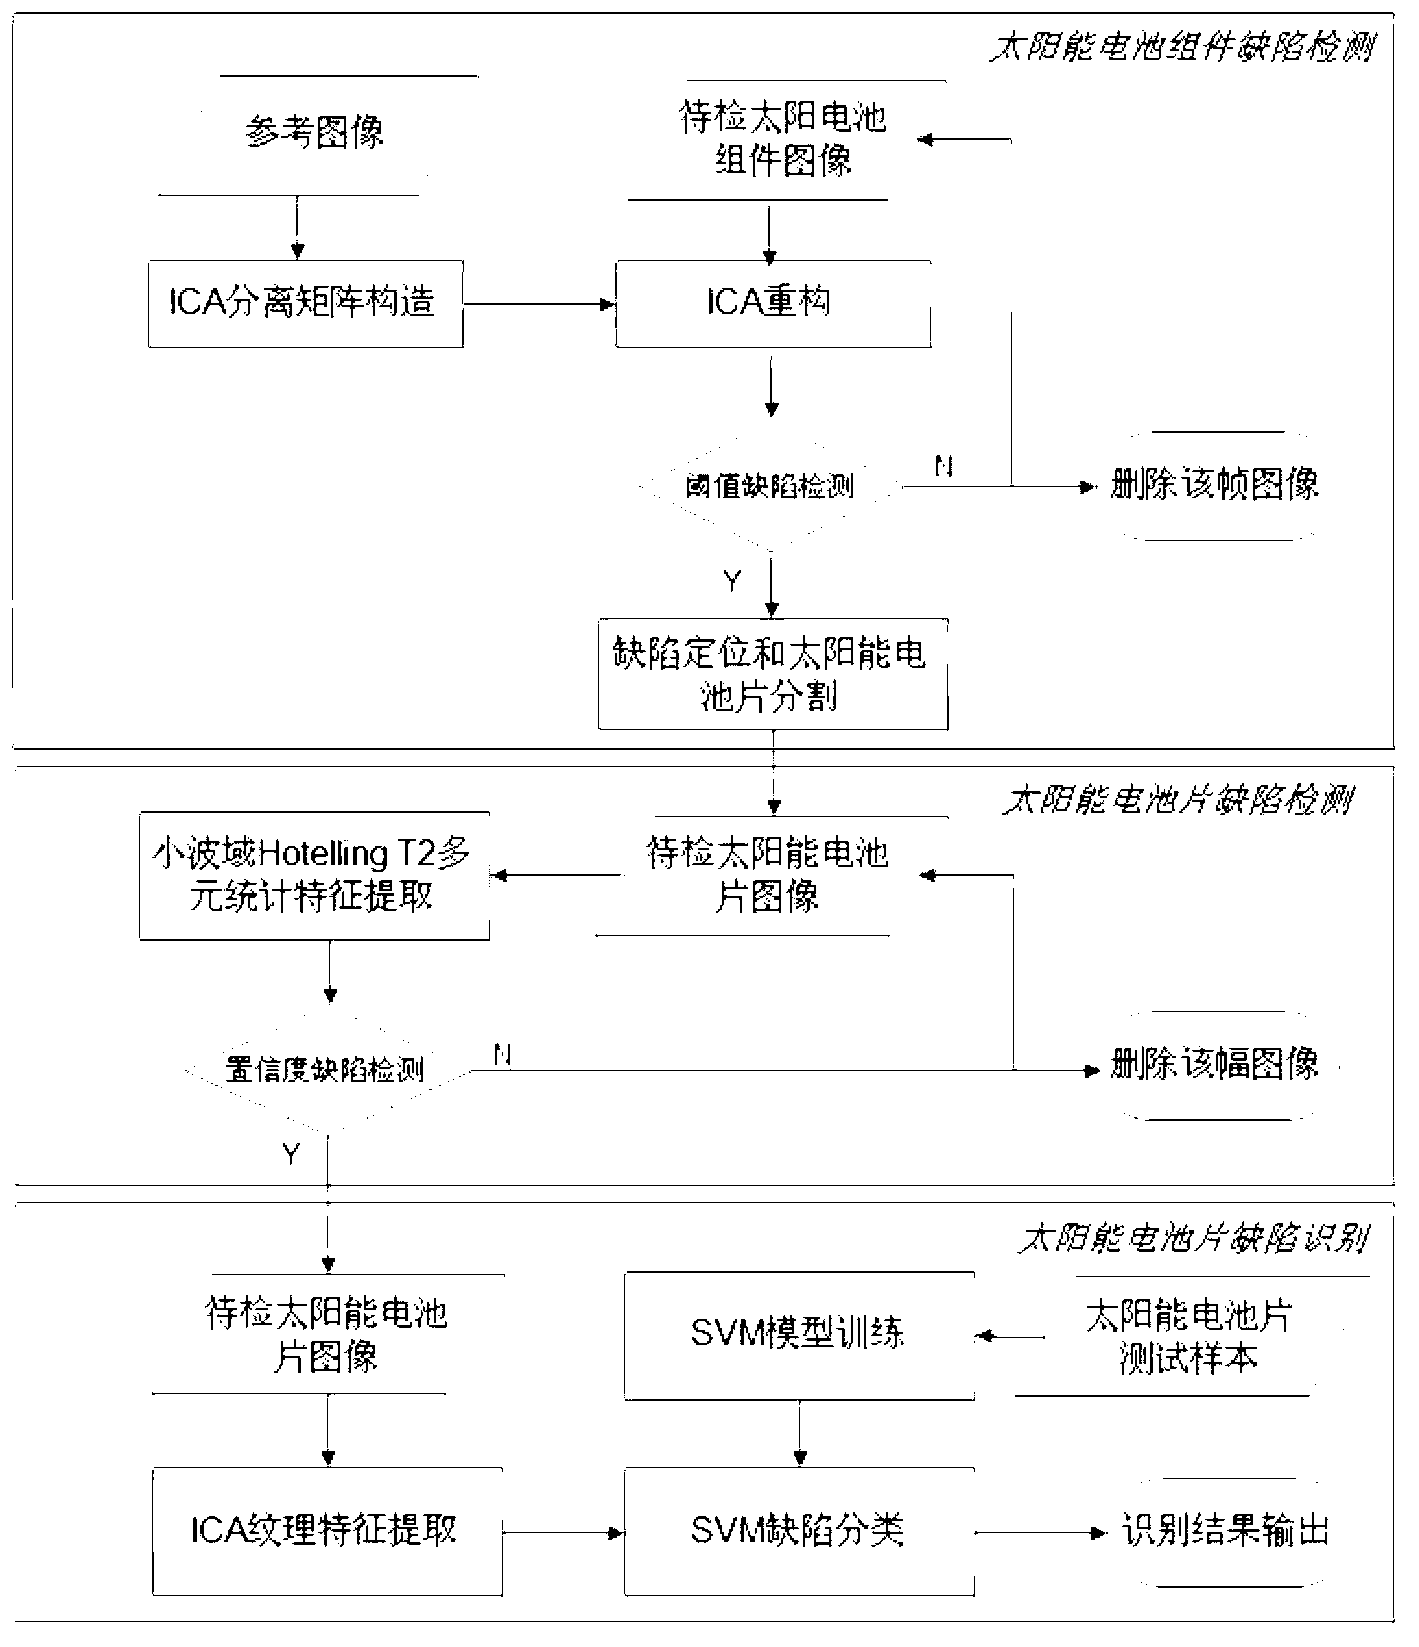
[0016] The present invention will be further described below in conjunction with the drawings.
[0017] Before implementing the present invention, it is necessary to train the reconstruction matrix for image defect detection of solar cell modules and the ICA basis function for solar cell defect classification.
[0018] 1. It is used for image reconstruction and defect detection of solar cell modules. The specific steps include:
[0019] (1), reference image preprocessing
[0020] Select a non-defective solar cell module image to perform de-averaging and whitening preprocessing, and perform a linear transformation on the de-averaging image, so that the original sample data becomes a whitening vector after being projected into the new subspace. The change formula is: Z=VX, where X is the original image, Z is the preprocessed image, linear transformation matrix C=E(X X T ) Is the covariance matrix of the input vector after removing the mean. After whitening, the vectors are not correlated with each other and the covariance matrix is the unit matrix E(z z T ) = I, so that the problem is more in line with the constraints, simplify the problem, and greatly reduce the amount of ICA calculation.
[0021] (2) Particle swarm search for the best separation matrix and IC vector
[0022] The specific process of using the particle swarm (PSO) to select the best separation matrix of the reference image ICA is: set the number of particles and the number of iterations, and randomly generate the initial position W of the particle i i And speed V i. Calculate the best position of particle i and the best position of all particles B i And B g. B i =(b i1 ,b i2 ,...,B ik )=W i , Where W i =(w i1 ,w i2 ,...,W ik ) Is the separation matrix of the input reference image. Where G(y)=(1/α 1 )·Logcosh(α 1 y), X=[X 1 ,X 2 ,...,X h ], h is the number of sub-images used for training. X i =[(x ik ,x ik ,...,X ik )] T The i-th column of the preprocessed reference image X is also the matrix of all pixel values of the sub-image used for training. If the training sub-image size is m×n, then k=m×n, i=1, 2, ..., h. Then, use the formula
[0023]
[0024] w ij new = w ij old + v ij new
[0025] Update the position and velocity of each particle, and orthogonalize the obtained separation matrix. After that, the new fitness value is evaluated, and the local and global best positions are updated. Calculate the local fitness value of the i-th particle in case Then Otherwise, keep the current value and update the global best position At the same time, the global best position B g As the best separation matrix, solve the independent component Ic=B g ·X=[Ic 1 ,Ic 2 ,...,Ic h ], repeat the calculation process of the separation matrix and independent components until the maximum number of iterations and restriction conditions are met. In the PSO search process, in order to minimize the deviation between the restored signal and the original signal, the ICA model is constrained, where the constraint condition is max j { y j } μ y + K σ y , min j { y j } μ y + K σ y , The value of K is 3. among them μ y = 1 h X j = 1 h y j , σ y = { 1 h - 1 X j = 1 h ( y j - μ y ) 2 } 1 / 2 .
[0026] The final global best position B g Is the best separation matrix W * , Independent component IC=B g ·X.
[0027] (3), difference reconstruction IC component and separation matrix
[0028] Calculate the difference d between the peak value and the bottom value of the IC component obtained by the PSO search i =max(IC i )-min(IC i ),
[0029] According to the difference d i Sort in descending order and reorganize the IC components to obtain a new IC component IC′ i ,i=1,2,...,M; replacing the first m IC components of the original IC, the reconstructed separation matrix is
[0030] w ′ i * = w M i = 1,2 , . . . , m w i ′ i = m + 1 , m + 2 , . . , M
[0031] By performing ICA transformation on the defect-free sample image, calculating the separation matrix W and IC components, and sorting the difference of the IC components, the first 40 IC components with the largest changes are shown in Table 1. IC i Is the original IC component, IC′ i Is the sorted IC component. It can be seen from the table that IC 5 The biggest change, on the contrary, IC 37 The change is minimal. The first 40 IC components have a large change value, so 40 IC components are selected to be replaced, and the corresponding first 40 separation matrix row vectors are also replaced. After reorganizing the IC components, IC′ 128 The change value of is the smallest, then the corresponding separation matrix row vector w′ 128 Is used instead of i=1,2,...,40.
[0032] Table 1 The order of the difference of IC components
[0033]
[0034] 2. The ICA basis function construction process for feature extraction of defect classification of solar cells is:
[0035] First, select a group of solar cell surface defect images as a sample set, which should cover all defect types as much as possible. Convert the gray value of each sample image (size m×n) from a two-dimensional matrix to a one-dimensional row vector. which is:
[0036]
[0037] If the image contains a total of k samples, the samples used for ICA transformation are:
[0038]
[0039] Taking the training sample X as the input of the PSO-ICA method, the best separation matrix W can be obtained, and each row of the separation matrix is a basis function. An example of a set of solar cell defect images is a set of basis functions obtained by PSO-ICA transformation, which contains a total of 144 characteristic basis functions. This group of basis functions is a set of filters with local characteristics, directional characteristics, bandwidth characteristics and other characteristics. It can be seen that the ICA method based on high-order statistics can extract the directional features and local features of the image.
[0040] Such as figure 1 As shown, the realization of the defect detection and identification method of the present invention includes the following processes:
[0041] The first step: solar cell module defect detection
[0042] After performing de-averaging and whitening preprocessing on a frame of solar module image to be inspected, the separation matrix obtained in the above training process is used to reconstruct the image to be inspected through matrix operation, and the reconstructed image highlights the defect information to filter out the regular texture of the module image. Then the reconstructed image is threshold binarized according to the formula.
[0043]
[0044] Where y ij Is the gray value of reconstructed image Y at coordinates (i, j), μ i And σ i Is the mean and standard deviation of the gray value of the image in the i-th row, t is the 3-sigma standard constant, t=3.
[0045] Set the defect area as white and the non-defect area as black. According to the binarization result, judge whether there are defects in the component to be inspected, locate the defect and divide the defective solar cell, if there is no defect, then transfer to the next frame of the component to be inspected The image is inspected.
[0046] ICA reconstruction and binarization are performed on the defect samples of solar cell modules, which can effectively detect the position of the defect. However, this method can only detect the position of the defect, not the shape and size of the defect.
[0047] The second step: solar cell defect detection
[0048] A frame of solar cell module image is composed of a set of solar cells arranged, and the defective area only occupies a few or one solar cell. After the first step of inspection and segmentation, the solar cells with suspected defects are separated In order to improve the detection rate of solar cells with different degrees of hidden cracks, it is also necessary to perform defect detection on the segmented solar cells containing suspected defects through multivariate wavelet texture features.
[0049] Image of solar cell to be inspected X T Calculate Hotelling T2 multivariate statistics in wavelet domain. First, take a 256×256 image of the solar cell to be inspected X T Divide into 4×4 statistical units M(x,y), and then divide each statistical unit into 2×2 wavelet units W(x 1 , Y 1 ), W(x 1 ,y 2 ), W(x 2 , Y 1 ), W(x 2 ,y 2 ), one-dimensional Haar wavelet transform is performed in each wavelet unit, the process is as follows:
[0050] Row transformation:
[0051] f R ( i , j ) = [ f ( i , 2 j ) + f ( i , 2 j + 1 ) 2 ] f R ( i , j + [ T 2 ] ) = [ f ( i , 2 j ) + f ( i , 2 j + 1 ) 2 ]
[0052] Among them, 0≤i≤(S-1), [] is the Gaussian symbol.
[0053] Column transformation:
[0054] f c ( i , j ) = [ f R ( 2 i , j ) + f R ( 2 i + 1 , j ) 2 ] f c ( i + [ S 2 ] , j ) = [ f R ( 2 i , j ) - f R ( 2 i + 1 , j ) 2 ]
[0055] among them, 0≤j≤T-1, [] is Gaussian symbol.
[0056] f(i,j) represents a digital image, f c (i,j) is the row transformation of f(i,j), f R (i,j) is f c (i, j) column transformation.
[0057] After the above transformation, 4 wavelet coefficients are obtained:
[0058] A 1 ( i , j ) = f c ( i , j ) D 1 ( i , j ) = f c ( i , j + [ T 2 ] ) D 2 ( i , j ) = f c ( i + [ S 2 ] , j ) D 3 ( i , j ) = f c ( i + [ S 2 ] , j + [ T 2 ] )
[0059] 0 ≤ i ≤ [ S 2 ] - 1 , 0 ≤ j ≤ [ T 2 ] - 1 .
[0060] Among them, A 1 (i,j) represents the best approximation of the original image, D 1 (i,j), D 2 (i,j), D 3 (i,j) reflects the edge, contour and texture of the image in the horizontal, vertical and diagonal directions.
[0061] Therefore, the multiwavelet variable representation of a statistical unit M(x,y) is recorded as
[0062] X = A ( x i , y j ) D 1 ( x i , y j ) D 2 ( x i , y j ) D 3 ( x i , y j )
[0063] Multiwavelet variable mean value of a statistical unit M(x,y) Marked as
[0064] X ‾ = A ‾ ( x , y ) D 1 ‾ ( x , y ) D 2 ‾ ( x , y ) D 3 ‾ ( x , y ) = 1 a X b X i = 1 a X j = 1 b A ( x i , y j ) 1 a X b X i = 1 a X j = 1 b D 1 ( x i , y j ) 1 a X b X i = 1 a X j = 1 b D 2 ( x i , y j ) 1 a X b X i = 1 a X j = 1 b D 3 ( x i , y j )
[0065] The mean of the entire image is recorded as
[0066] X ‾ ‾ = A ‾ ‾ D ‾ ‾ 2 D ‾ ‾ 3 D ‾ ‾ 4 = 1 g X h X i = 1 g X j = 1 h A ‾ ( x , y ) 1 g X h X i = 1 g X j = 1 h D ‾ 1 ( x , y ) 1 g X h X i = 1 g X j = 1 h D ‾ 2 ( x , y ) 1 g X h X i = 1 g X j = 1 h D ‾ 3 ( x , y )
[0067] The covariance matrix of the entire image is recorded as
[0068] C = C A 2 C A , D 1 C A , D 2 C A , D 3 C D 1 , A C D 1 2 C D 1 , D 2 C D 1 , D 3 C D 2 , A C D 2 , D 1 C D 2 2 C A , D 1 C D 3 , A C D 3 , D 1 C D 3 , D 2 C D 3 2
[0069] among them, Is the variance of the c-th eigenvalue in the statistical unit X, Is the covariance of the c-th wavelet feature and the d-th feature.
[0070] Then Hotelling T2 is
[0071] T 2 = a X b X [ X ‾ - X ‾ ‾ ] ′ C - 1 [ X ‾ - X ‾ ‾ ]
[0072] UCL = p ( m - 1 ) ( n - 1 ) mn - m - p + 1 F θ , p , ( mn - m - p + 1 )
[0073] Among them, UCL is the upper limit of Hotelling T2 statistics, F θ, p, (mn-m-p+1) Is the F distribution with confidence θ, degrees of freedom p and mn-m-p+1. Among them, m is the number of sample groups, n is the number of observations in the sample group, and p is the number of quality traits.
[0074] The larger the value of T2, the greater the distance between the sub-image represented by the statistical unit and the defect-removed image, and the greater the probability that the image is a defective image. When the T2 value is greater than UCL, it is considered that the region is defective.
[0075] In order to illustrate the effectiveness of the wavelet Hotelling T2 statistical method used in the present invention, subjective evaluation and objective evaluation are used to analyze the detection performance.
[0076] Subjective evaluation
[0077] The method of the present invention and the X2 distance method are respectively used for defect detection. In order to obtain the best statistical method parameter setting, 20 defect images are selected for parameter selection. For the T2 statistical method, the confidence value is changed and the detection result is calculated; for the wavelet X2 Method, change the coefficient of standard deviation, and count the test results. It can be seen from the statistical results that when the confidence value is 0.03, the wavelet T2 method can reach the highest detection rate of 97.6%, and when the standard deviation coefficient is 1.85, the wavelet X2 recognition rate can reach up to 93.5%. In the optimal parameter setting, the theoretical detection accuracy of the T2 statistical method is higher than that of the wavelet X2 distance method. Under the optimal parameter setting, the peak is the defect position. The Hotelling T2 method can reflect the defect shape more vividly, highlighting the defect area and the non-defect area. However, the X2 method has a weak distinction between defective and non-defective areas, and there are cases where the non-defective areas are identified as defective areas in the figure.
[0078] objective comment
[0079] In order to further quantitatively analyze the performance of the defect detection method of the Hotelling T2 statistical method of the present invention, the T2 statistical method, the X2 statistical method and the threshold segmentation method are used to conduct comparative detection experiments on 20 defect-free images and 80 defective images. Different methods The detection rate and false detection rate are shown in the table.
[0080] Table 2 Comparison of three defect detection methods
[0081]
[0082] Analysis of Table 2 shows that the T2 statistical method can achieve 100% detection rate and 0% false detection rate, that is, to achieve the best detection performance, the X2 statistical method is the second, and the threshold segmentation method has the worst detection effect. In the process of product quality control on the production line, in order to ensure product quality, it is important to ensure a 100% detection rate of defective products and the lowest false detection rate.
[0083] There are a large number of hidden crack defects on the surface of solar cells. The surface brightness of this defect is extremely small, which makes traditional detection methods difficult. In addition, the brightness of the surface image is affected by the dirt on the surface of the solar cell, which leads to For surface images that do not contain defects, a higher false detection rate is generated. Different from the traditional threshold detection method, the detection method based on wavelet multivariate statistical analysis takes into account the gradual characteristics of image brightness, has higher robustness and reliability, and can achieve a lower false detection rate.
[0084] The third step: solar cell defect identification
[0085] (1) Feature extraction
[0086] Combine the defect image f(x,y) of the solar cell detected by the above process with the ICA basis function (filter) obtained by training Perform convolution to get
[0087] F n ( x , y ) = f ( x , y ) * W n * ( x - x 1 , y - y 1 ) dxdy
[0088] Among them, n is the number of basis functions.
[0089] Extract the mean value of the image after convolution μ n Sum variance σ n As the texture feature of the image:
[0090] μ n =∫∫|F n (x,y)|dxdy
[0091] σ n =∫∫(|W n (x,y)|-μ n ) 2 dxdy
[0092] (2) Support vector machine model training
[0093] In view of the unique advantages of support vector machines in solving small sample, non-linear and high-dimensional pattern recognition problems, the present invention uses support vector machines to classify defective images. In support vector machines, the kernel function must be selected first, and then the best kernel parameters must be determined through sample training. The present invention uses radial basis kernel function
[0094] K ( x , x i ) = exp { - | x - x i | 2 σ 2 } = Φ ( x i ) Φ ( x j )
[0095] The model parameters are the kernel parameter γ and the penalty factor C.
[0096] Then, select 600 defective images of 128×128 and 200 non-defective images, of which 7/8 are used for training and 1/8 are used for testing. And using the "one-to-one" multi-class classification method, based on cross-validation grid search to get the best combination of parameters C and γ. In the experiment, the parameter change range of the support vector machine is set to C~{2 -5 ~2 15 }, γ~{2 3 ~2 -15 }, the index of parameter C is incremented by step 2, and the index of parameter γ is decremented by step 2, bind (C, γ) in pairs to calculate the cross-validation accuracy, and then select the group with the highest cross-validation accuracy Parameters for training and testing. In order to verify the performance of the classifier, three eigenvectors are used for classification tests: the degree co-occurrence matrix includes energy, entropy, moment of inertia, correlation, and standard deviation; the spectral characteristics include the maximum, minimum, mean, and standard of the S(θ) curve Difference and the difference between the maximum and the mean; texture features based on ICA primitives include mean and variance. Cross-validation network search obtains the best parameter combination of gray level co-occurrence matrix, spectrum measurement feature and ICA feature. Finally, the SVM model is established based on the best parameter combination obtained by the gray level co-occurrence matrix, spectrum measurement feature and ICA feature search. The model parameters are shown in Table 3. The performance of the SVM classifier is mainly determined by the number of support vectors and the training recognition rate. It can be seen from Table 3 that although the ICA feature requires the most number of support vectors, the training recognition rate is also the highest.
[0097] Table 3 SVM classifier model parameters using different features
[0098]
[0099] (3) Support vector machine classification
[0100] The process of support vector machine classification for the defect images of solar cells to be identified is:
[0101] (A) For a given defect sample to be identified, extract its defect feature vector;
[0102] (B) Substitute the feature vector M of the sample to be identified into the model function of the linear classification support vector machine. If f(M)>τ, the type of sample to be identified can be determined, and τ is the classification threshold obtained by training. If f(M)
[0103] (C) Substitute the feature vector M of the sample to be identified into the model function of the non-linear classification support vector machine, and f max (M) is classified into the corresponding defect category.
[0104] In order to test the effect of defect recognition, 100 test phantoms of solar cell defect types are input into the classifier, and the gray-level co-occurrence matrix, spectrum measurement feature, ICA feature and the combination of the three features are used for classification experiments. From the ROC curve, it can be seen that the AUC values of the gray-level co-occurrence matrix, the spectral measurement feature, the ICA feature, and the combined feature are 0.8647, 0.8832, 0.9560, and 0.9664, respectively. That is to say, the best classification effect can be obtained when using combined features, followed by ICA feature classification, and the classification result of the gray-level co-occurrence matrix is comparable to the spectrum measurement. However, the classification effect of the combined feature and the ICA feature is almost the same. The use of the combined feature for training and testing takes much longer than the ICA feature. Therefore, the present invention only uses the ICA texture feature for classification when the real-time performance is emphasized. Using ICA texture features as the input of SVM, the total classification accuracy of 100 test samples reached 96%.
[0105] Table 4 Classification experiment results
[0106]
[0107] The above-mentioned technical innovation of the solar cell defect detection and identification method of the present invention has many advantages for the technical personnel in the same industry today, and it is indeed technologically advanced.
[0108] The present invention has the following characteristics: the image of the solar module to be inspected is reconstructed by independent components, it is possible to determine whether the module contains defects without extracting texture features, and the operation is simple; it uses multivariate wavelet texture features to detect defects in solar panels and detect local irregularities by human eyes The texture perception process is similar, which can effectively detect weak defects and improve the defect detection rate; using ICA sparse texture features to describe the roughness and directionality of the solar cell surface texture, making the classifier more robust and higher The recognition accuracy.
[0109] The above are only the preferred embodiments of the present invention, and are not intended to limit the present invention in any form. Although the present invention has been disclosed as above in preferred embodiments, it is not intended to limit the present invention. Anyone familiar with the profession Those skilled in the art, without departing from the scope of the technical solution of the present invention, can use the technical content disclosed above to make slight changes or modification into equivalent embodiments with equivalent changes, but any content that does not depart from the technical solution of the present invention is based on the present invention Any simple modifications, equivalent changes and modifications made to the above embodiments are still within the scope of the technical solutions of the present invention.