Method for drawing real-time dynamic three-dimensional power grid contamination area distribution diagram
What is Al technical title?
Al technical title is built by PatSnap Al team. It summarizes the technical point description of the patent document.
A technology for the distribution and real-time dynamics of polluted areas, which is applied in the fields of instruments, data processing applications, and calculations. Flash occurrence probability, shortened drawing cycle, easy-to-obtain effects
Active Publication Date: 2013-09-25
ELECTRIC POWER RES INST OF GUANGDONG POWER GRID
View PDF2 Cites 25 Cited by
Summary
Abstract
Description
Claims
Application Information
AI Technical Summary
This helps you quickly interpret patents by identifying the three key elements:
Problems solved by technology
Method used
Benefits of technology
Problems solved by technology
[0005] The drawing cycle is long, and the division of polluted areas in this cycle is constant, which is more conducive to guiding the design, but for the operation and maintenance of the power grid, the timeliness is not enough, and it cannot reflect the current real pollution situation
Although the automatic and semi-automatic polluted area distribution map drawing technology can shorten the drawing cycle of the polluted area map to a certain extent, it is basically still a traditional static polluted area map, and the automatic and semi-automatic polluted area map drawing technology Rely on insulator pollution monitoring equipment, manual on-site pollution degree measurement and other measurement methods. Among them, the cost of insulator pollution monitoring equipment is high, it is difficult to install on a large scale, and the measurement values are inaccurate; manual on-site pollution degree measurement requires staff to climb up It is difficult to repeat the implementation of tower cleaning insulators and laboratory measurements in a short period of time, so the automatic and semi-automatic pollution area distribution map drawing technology still cannot dynamically reflect the real-time pollution status of the area
[0006] On the other hand, the paper-based thematic map of polluted area distribution and the two-dimensional GIS-based polluted area distribution map are difficult to intuitively display the topography, landform and other information of the polluted area
Method used
Image
Click on the blue label to locate the original text in one second.
Reading with bidirectional positioning of images and text.
Examples
Embodiment Construction
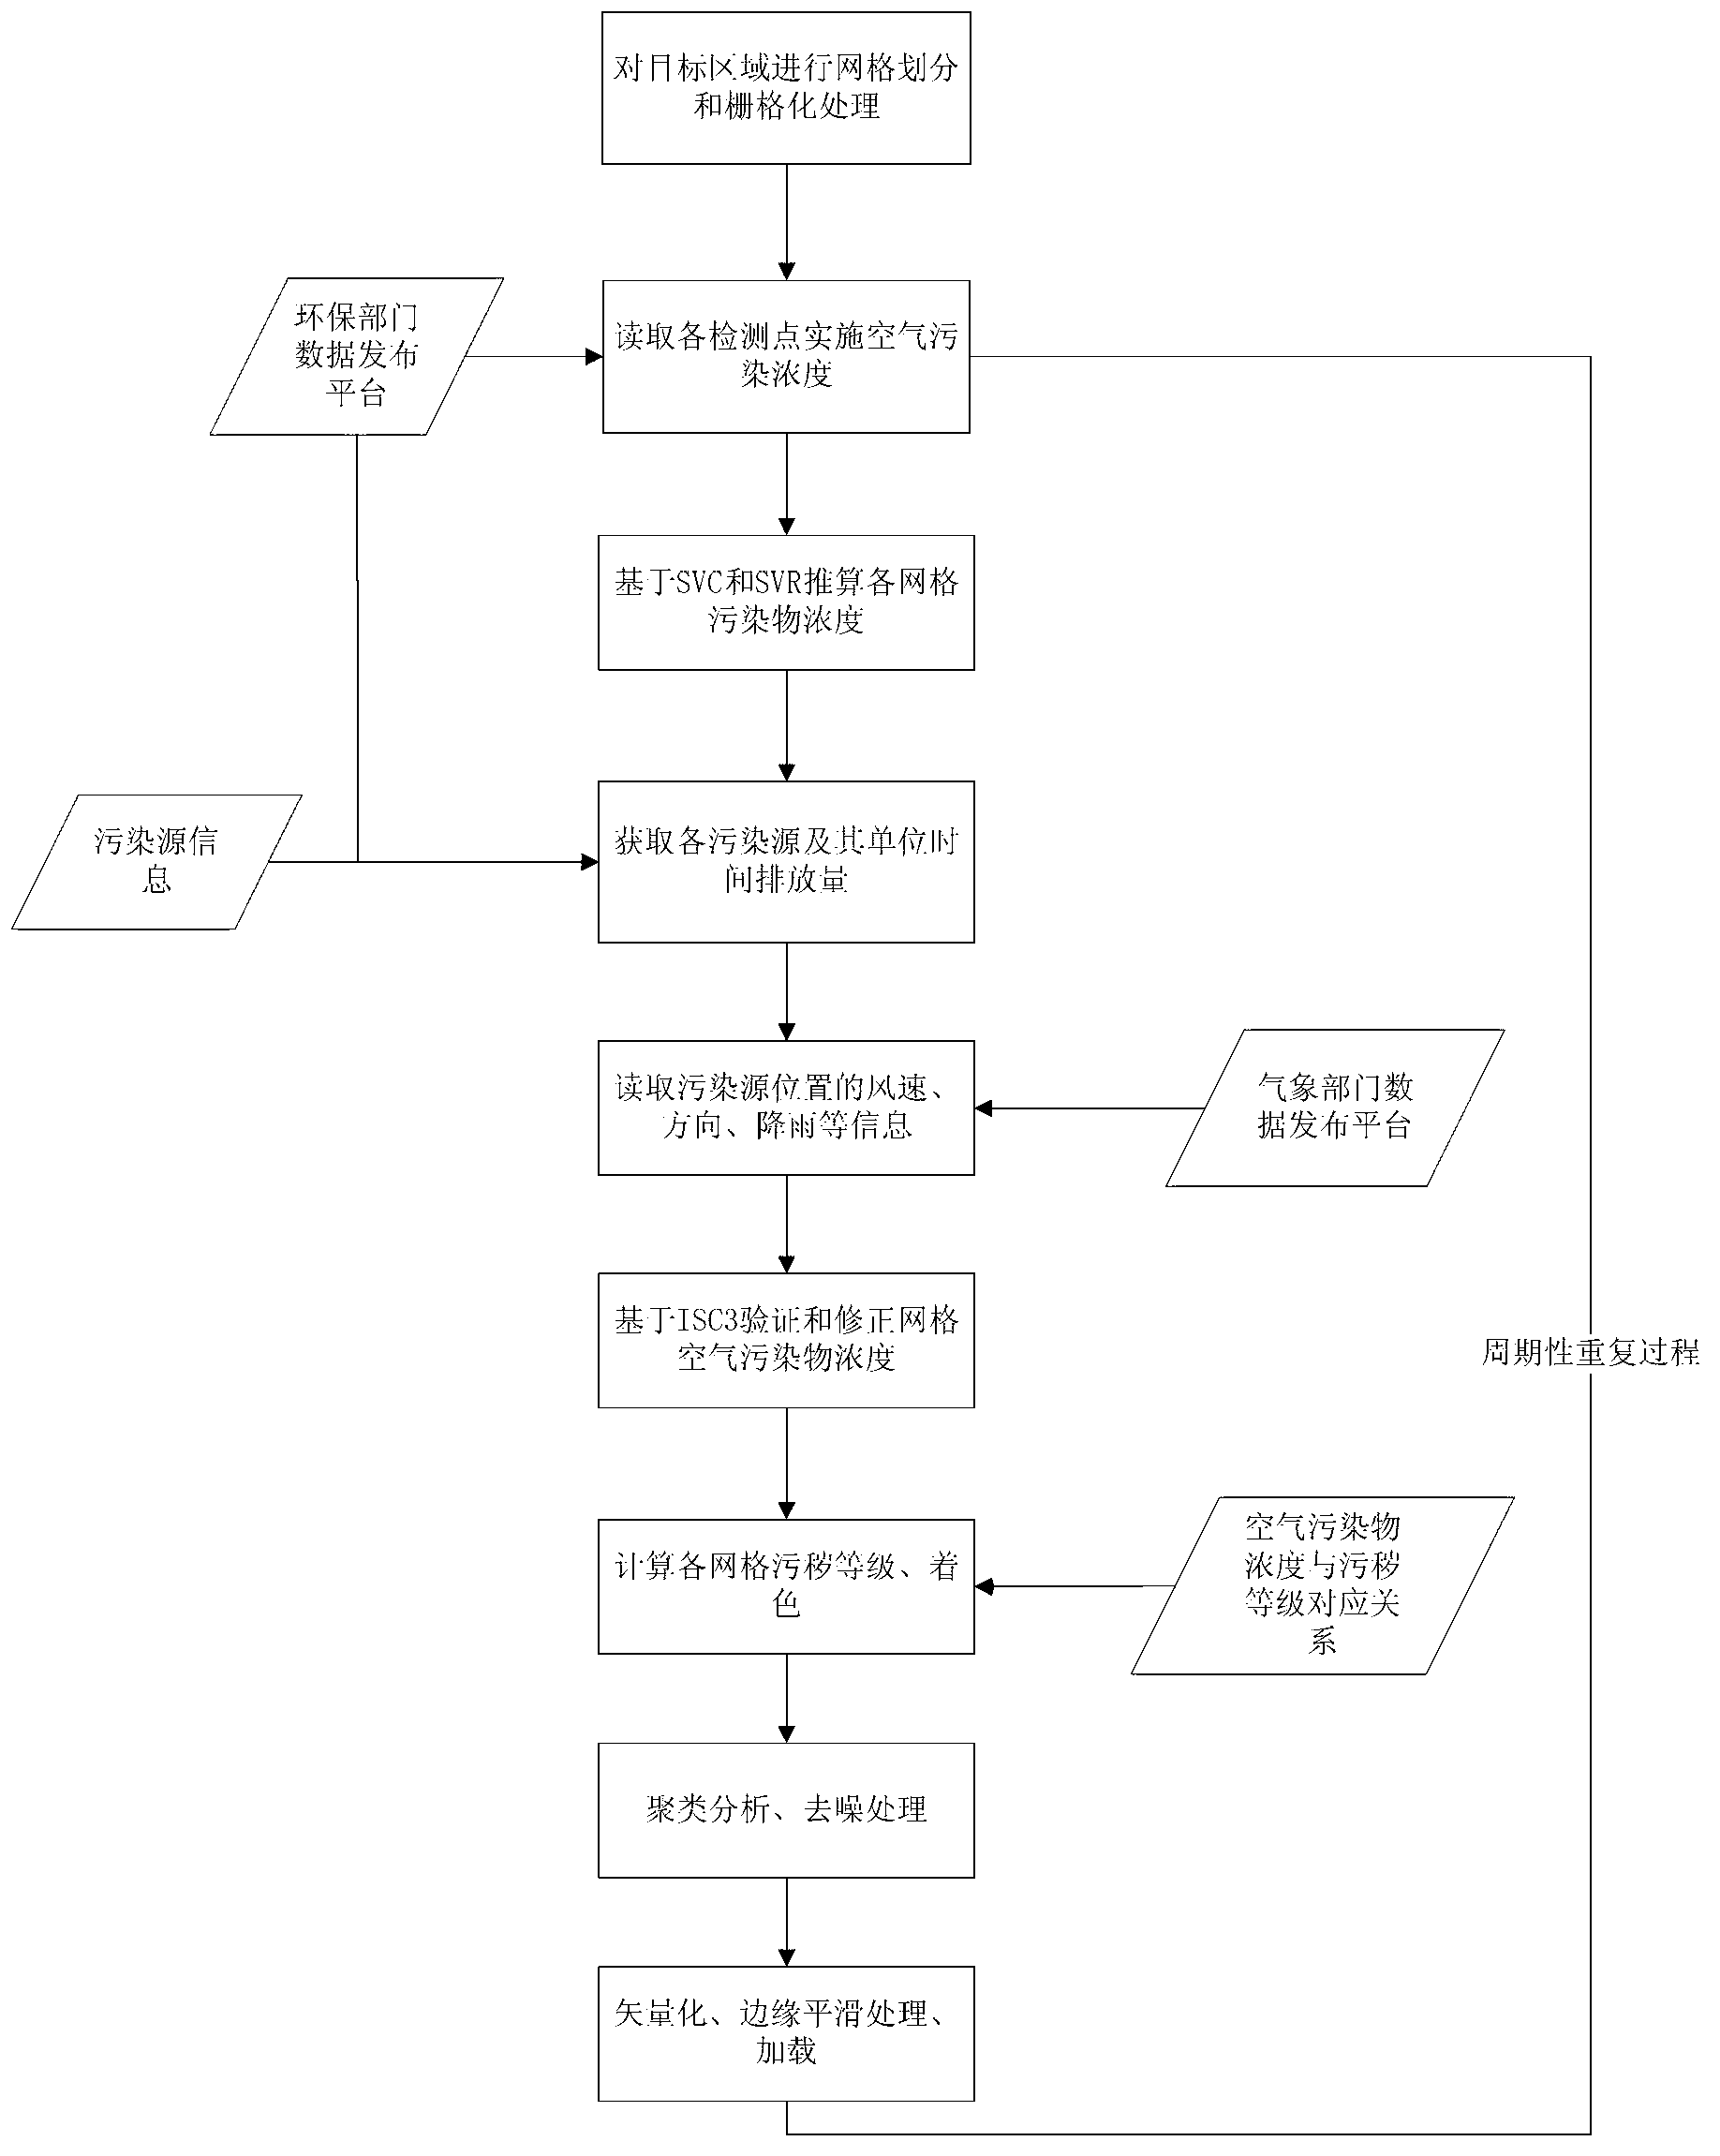
[0049] An embodiment of a method for drawing a real-time dynamic three-dimensional grid pollution area distribution map of the present invention includes the following steps:
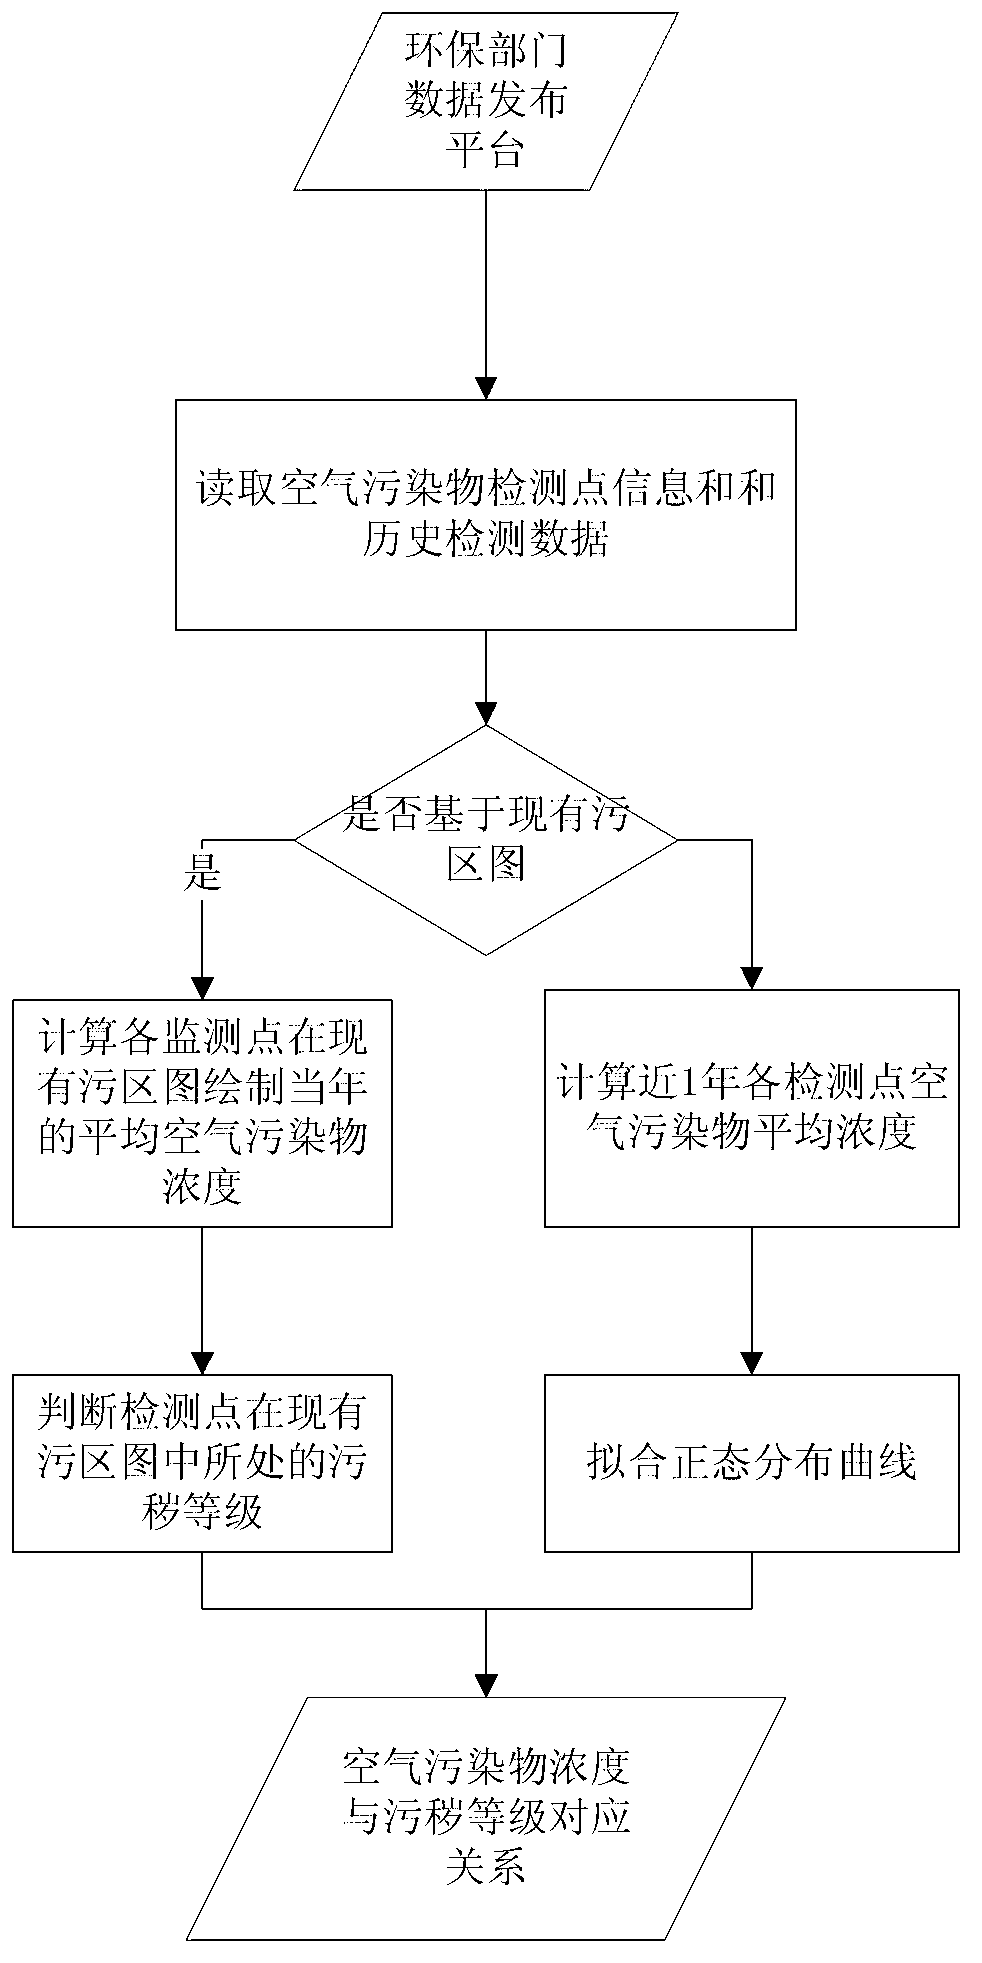
[0050] S1 establishes the corresponding relationship between air pollutant concentration and pollution level, which is divided into two situations for implementation, such as figure 1 shown;
[0051] (1) Referring to the existing distribution map of contaminated areas:
[0052] a) Select the existing polluted area distribution map covering all levels. If the polluted area distribution map of the target area cannot cover all polluted area levels, a larger-scale polluted area distribution map can be used (for example, such as the city-level polluted area distribution map If it cannot cover all pollution levels, it can be determined by using the distribution map of pollution areas at the provincial level).
[0053] b) Read the coordinate information and monitoring history data of all spatial pollutant c...
PUM
Abstract
A method for drawing a real-time dynamic three-dimensional power grid contamination area distribution diagram includes the steps of S1, establishing a corresponding relation between air pollutant concentration and the gradation for surface pollution, and S2, drawing the contamination area distribution diagram. The S2 further includes the steps of S2-1, conducting square mesh generation and rasterization processing on an object region, S2-2, reading real-time air pollutant concentration, S2-3, calculating the air pollutant concentration, S2-4, reading the position, the discharging type and the discharging amount of pollution sources, S2-5, reading the data of wind directions, wind speeds and rainfalls, S2-6, checking and amending the air pollutant concentration by the aid of the data obtained in the steps (4) and (5), S2-7, dividing the gradation for surface pollution and coloring according to the corresponding relation in the S1, S2-8, making a clustering analysis and denoising, S2-9, conducting vectorization and smoothing, and loading DOM, DEMs, power grid device information and the pollution sources to a three-dimensional GIS platform, S2-10, repeating the steps from (2) to (9) for 5-60 minutes to form the dynamic contamination area distribution diagram.
Description
technical field [0001] The invention relates to a method for drawing a map, in particular to a method for drawing a real-time dynamic three-dimensional power grid pollution area distribution map based on environmental and meteorological data. Background technique [0002] The power pollution area distribution map is a special map widely used in power transmission and transformation design and operation and maintenance in the power grid, and it is one of the important criteria for the selection of external insulation of power facilities. In the process of drawing, based on the collected information such as on-site pollution degree and pollution sources and combined with operating experience, the pollution level of the target area is divided, and finally a planar map covering the administrative division of the entire target area is drawn, and then by superimposing power grids such as transmission lines and substations The information layer is a thematic map of the distribution...
Claims
Application Information
Patent Timeline
Application Date:The date an application was filed.
Publication Date:The date a patent or application was officially published.
First Publication Date:The earliest publication date of a patent with the same application number.
Issue Date:Publication date of the patent grant document.
PCT Entry Date:The Entry date of PCT National Phase.
Estimated Expiry Date:The statutory expiry date of a patent right according to the Patent Law, and it is the longest term of protection that the patent right can achieve without the termination of the patent right due to other reasons(Term extension factor has been taken into account ).
Invalid Date:Actual expiry date is based on effective date or publication date of legal transaction data of invalid patent.
Patent Type & Authority Applications(China)
IPC IPC(8): G06Q50/06
Inventor 徐晓刚许志海毛先胤麦晓明王锐余欣李志锋江聪世周妙林佘锋凌飞
Owner ELECTRIC POWER RES INST OF GUANGDONG POWER GRID