Automatic sleep stage method based on electroencephalogram, heart rate variability and coherence between electroencephalogram and heart rate variability

A technology of heart rate variation and sleep staging, which is applied in the measurement of pulse rate/heart rate, medical science, sensors, etc. It can solve problems such as heavy workload, discomfort of subjects, and large disturbance of normal sleep, so as to improve accuracy and simplicity sex, considerable social and economic benefits

Active Publication Date: 2014-02-19
TIANJIN UNIV
2 Cites 60 Cited by

AI-Extracted Technical Summary

Problems solved by technology

It simultaneously records EEG, EOG (oculoelectric signal) and EMG (myoelectric signal), on this basis according to the R&K rule [1] , to determine the sleep state and sleep stage, but this method needs to wear at least ten electrodes, and the subjects often feel uncomfortable, which greatly interferes with normal sleep
Moreover, the method of manual interpretation of EEG waveforms is generally used, but this requires a large worklo...

Method used

According to the principle of variance maximization, PCA characterizes the row (or column) of the original data matrix with a group of linearly independent and mutually orthogonal new vectors, reaches the number of compressed variables, removes redundant information, and maximizes the preservation of effective information the goal of. The original vector group is (P1, P2, ..., P9), and the principal component vector group is recorded as (F1, F2, ..., Fm), usually m is less than 9. Then the relationship between the principal component and the original vector group is:
In sum, this method is by calculating the coherence coefficient of EEG and HRV parameter, and with extracted EEG, the frequency domain of HRV signal, nonlinear feature fusion is used as feature matrix, then utilizes PCA principal component analysis to remove redundancy information, so as to perform automatic sleep staging accurately, objectively and conveniently. The method can effectively improve the accuracy and simplicity of the automatic sleep staging system, and obtain considerable social and economic benefits. The best implementation plan is to use patent transfer, technical cooperation or product development. Due to the simple operation and strong sensitivity of this technology, products developed based on this technology can be applied to various scenarios such as sleep monitoring and sleep research.
[0030] Sleep, as a physiological state, must be reflected in mu...

Abstract

The invention discloses an automatic sleep stage method based on electroencephalogram, heart rate variability and the coherence between the electroencephalogram and the heart rate variability. The method comprises the following steps of extracting electroencephalogram signals and heart rate variability signals of a testee, extracting 9 feature vectors from the electroencephalogram signals and the heart rate variability signals, carrying out principal component analysis on the 9 feature vectors, and using a support vector machine classifier to identify features after feature extraction to carry out automatic sleep stage. The method can effectively improve the accuracy and the convenience of an automatic sleep stage system, and the method can obtain considerable social benefits and economical benefits. The optimal implementation scheme is patent transfer, technical cooperation or product development. The automatic sleep stage method is simple in operation and high in sensibility. The products based on the automatic sleep stage method can be applied to various scenes of sleep monitoring, sleep scientific researches and the like.

Application Domain

Technology Topic

PediatricsSleep Stages +9

Image

  • Automatic sleep stage method based on electroencephalogram, heart rate variability and coherence between electroencephalogram and heart rate variability
  • Automatic sleep stage method based on electroencephalogram, heart rate variability and coherence between electroencephalogram and heart rate variability
  • Automatic sleep stage method based on electroencephalogram, heart rate variability and coherence between electroencephalogram and heart rate variability

Examples

  • Experimental program(1)

Example Embodiment

[0029] In order to make the objectives, technical solutions and advantages of the present invention clearer, the embodiments of the present invention will be described in further detail below in conjunction with the accompanying drawings.
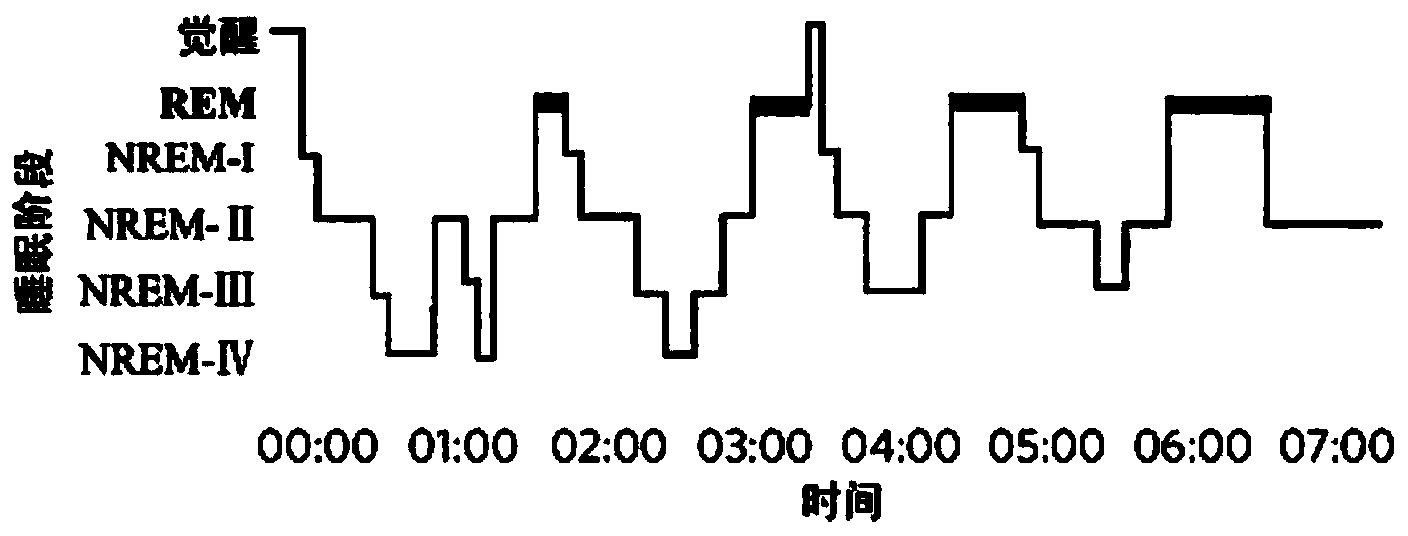
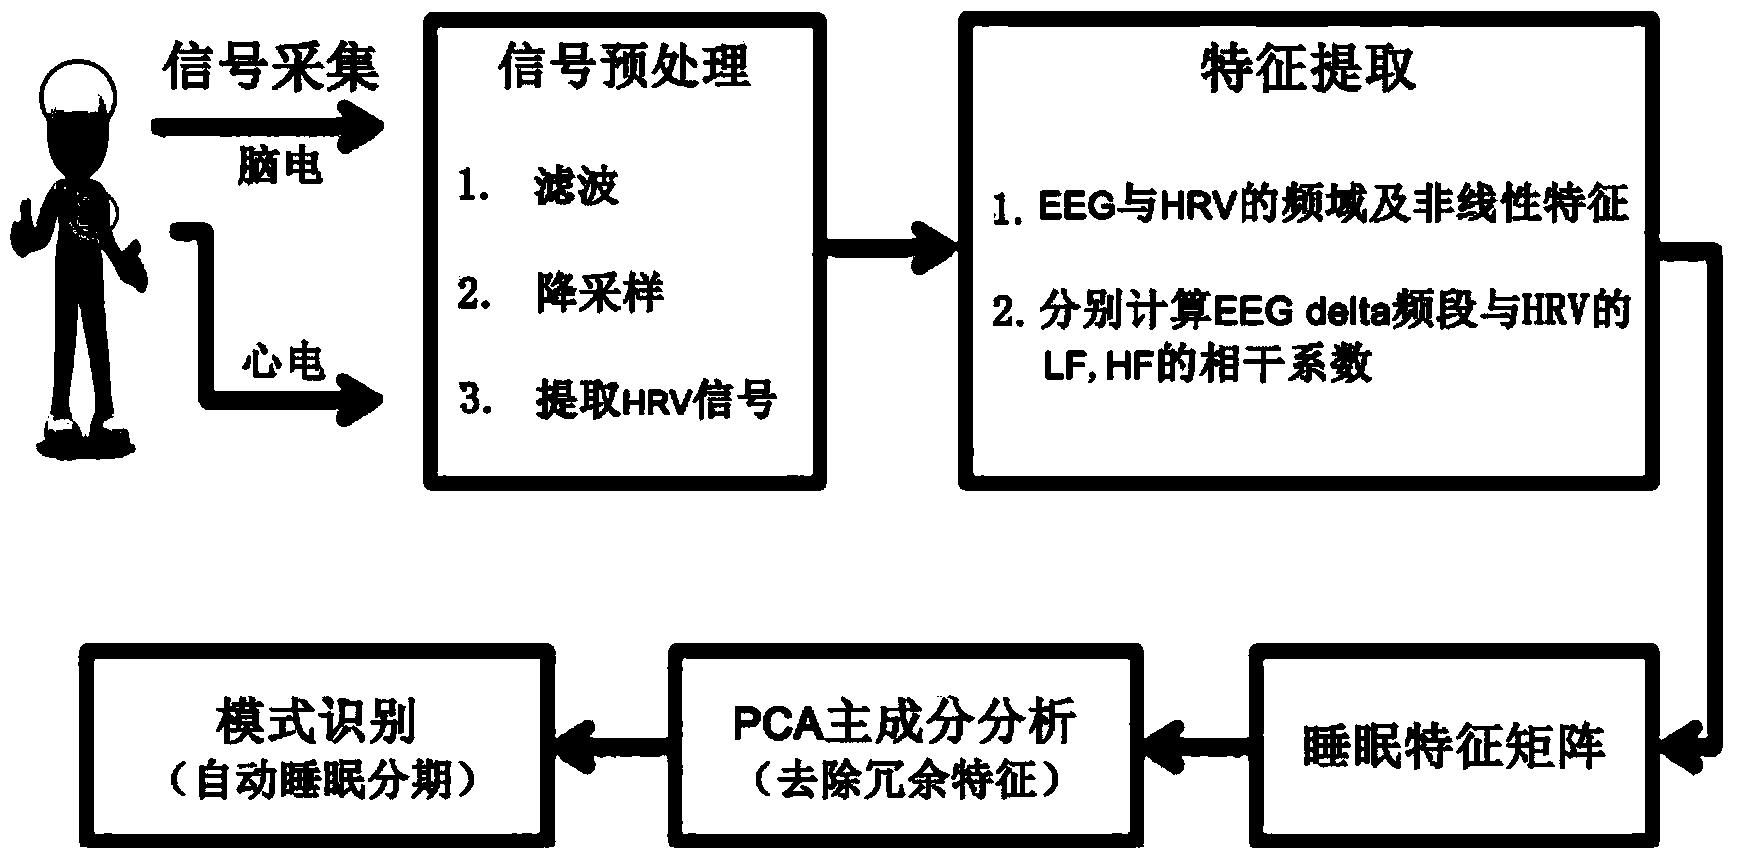
[0030] As a physiological state, sleep must be reflected in multiple parts of the body and multiple physiological processes. EEG is the central nervous system signal and the most sensitive and accurate physiological signal for sleep staging. The ECG signal is the autonomic nervous signal. The extracted heart rate variability signal (HRV) reflects the activity level of the sympathetic nervous system and parasympathetic nervous system, while the autonomic nervous system The regulation ability changes with the degree of sleep. Studies have shown that autonomic nerve activity and sleep have a common regulatory center in the subcortex. ECG signals, as the main autonomic nerve signals, are effectively fused with EEG signals, which is bound to improve the accuracy of automatic sleep staging.
[0031] 101: Extract the EEG signal and heart rate variability signal of the subject;
[0032] EEG contains a lot of physiological information, after analysis and processing, sleep can be staged. Compared with other physiological parameters, EEG reflects the most obvious characteristics of each stage of sleep, and is the current "gold standard" of sleep staging. Therefore, in recent years, research on the accuracy and objectivity of automatic sleep staging through EEG signals has attracted people's attention. The most mature. EEG usually contains 5 basic rhythms: delta wave (0.5-4Hz), theta wave (4-8Hz), aleph wave (8-13Hz), beta wave (13-30Hz), gamma wave (30-50Hz).
[0033] Heart rate variability is the small fluctuation between successive sinus heartbeat intervals, which is directly under the dual innervation of sympathetic and parasympathetic nerves in the autonomic nervous system. Heart rate variability is the most direct and effective reflection of the function of the autonomic nervous system, and the regulation ability of the autonomic nervous system changes with the degree of sleep. Studies have shown that HRV is a good indicator for automatic sleep staging. The typical spectrum of HRV can have three peaks, which are roughly located below 0.04Hz, 0.05-0.15Hz and> 0.15 Hz, respectively called very low frequency (VLF), low frequency (LF) and high frequency (HF) peaks.
[0034] In this method, because the two parameter measurement methods are mature and can more accurately and sensitively reflect each sleep stage compared with other physiological parameters, and the degree of correlation between the ECG signal in different sleep stages is different, so these two parameters are used. The effective integration of physiological parameters for automatic sleep staging has advantages in practical applications.
[0035] 102: Extract 9 feature vectors from EEG signals and heart rate variability signals;
[0036] 1) EEG feature extraction: The wavelet entropy of the EEG signal is obtained through wavelet transform, Hilbert-Huang transform and singular value decomposition on the EEG signal [2] , Hilbert-Huang entropy [3] , And the first principal component of the singular value (the maximum value in the singular spectrum) [4] , Respectively denoted as feature vector P 1 ,P 2 ,P 3.
[0037] 2) HRV feature extraction: Calculate the spectrum entropy of very low frequency (VLF), low frequency (LF) and high frequency (HF), and calculate the fractal dimension of HRV through wavelet transform [5][6] , Respectively denoted as feature vector P 4 ,P 5 ,P 6 ,P 7.
[0038] 3) Coherence coefficient between EEG signal delta frequency band and HRV parameter: Perform power spectral density analysis on EEG signal and HRV signal, and normalize it, and then use the improved coherence function to calculate the EEG signal delta frequency band and HRV signal LF, HF respectively The coherence coefficients of, respectively denoted as the feature vector P 8 ,P 9.
[0039] Coherence analysis is a real-valued function that describes the degree of correlation between two signals in the frequency domain. Frequency domain coherence is a measure of the phase consistency of two signals at different frequencies. When the phase of a certain frequency component fi of the two signals is the same,
[0040] Towards 1, it can be used to determine whether two signals have a fixed phase oscillation at a certain frequency. However, this coherence coefficient evaluation parameter has a big limitation in that it can only calculate the coherence coefficient of a certain same frequency band. In order to overcome this limitation, the present invention adopts an improved coherence evaluation parameter Coh xy (f 1 f 2 ), which is defined as:
[0041] Coh xy ( f 1 f 2 ) = | Pxy ( f 1 f 2 ) | 2 Pxx ( f 1 ) Pyy ( f 2 ) - - - ( 1 - 1 )
[0042] It represents the normalized mean value of the amplitude product of the EEG signal x at the frequency component of f1 and the heart rate variability signal y at the frequency component of f2. Its value interval is [0,1], reflecting the degree of correlation between the two signals. The closer the coherence spectrum is to 1, the more relevant the two signals are. The coherence coefficient is 1, indicating that the two signals are highly correlated, and one signal is a multiple of the other signal; the coherence coefficient is 0, indicating that the two signals are completely unrelated.
[0043] In the present invention, the steps of calculating the coherence coefficients between the delta frequency band of the EEG signal and the low frequency band (LF) and high frequency band (HF) of the HRV signal are as follows:
[0044] 1) In the sleep staging standard, the time resolution is 30s, which is consistent with it. The EEG and HRV signals of the same period of 30s are intercepted and preprocessed, including reference change, downsampling, noise removal and interference, and the preprocessed EEG signal Denoted as x, HRV signal as y.
[0045] 2) The Welch algorithm is used to calculate the power spectral density of EEG and HRV and the cross power spectral density of the two, respectively denoted as Pxx(f 1 ), Pyy(f 2 ), Pxy(f 1 ,f 2 ).
[0046] Pxx ( f 1 ) = 1 MU X i = 1 L | X n = 0 M - 1 x i ( n ) d 2 ( n ) e - j 2 π f 1 n | 2 - - - ( 1 - 2 )
[0047] Pyy ( f 2 ) = 1 MU X i = 1 L | X n = 0 M - 1 y i ( n ) d 2 ( n ) e - j 2 π f 2 n | 2 - - - ( 1 - 3 )
[0048] Pxy ( f 1 f 2 ) = 1 L X i = 1 L X i ( f 1 ) Y i ( f 2 ) - - - ( 1 - 4 )
[0049] Where U is the normalization factor, d 2 (n) is the Gaussian window function, L is the number of segments of the data, and M is the length of each segment. x t (n) is the i-th segment data of x (EEG signal), y t (n) is the i-th segment of y (HRV signal). X i ( f 1 ) = X - ∞ ∞ x i ( n ) e - j 2 π f 1 n , Y i ( f 2 ) = X - ∞ ∞ y i ( n ) e - j 2 π fn 2 , j is the imaginary unit, j = -1 .
[0050] 3) Use the improved coherence function to calculate the coherence coefficients between the delta band of the EEG signal and the HRV signal LF and HF
[0051] Coh xy ( f 1 f 2 ) = | Pxy ( f 1 f 2 ) | 2 Pxx ( f 1 ) Pyy ( f 2 ) - - - ( 1 - 5 )
[0052] Then calculate the f of the EEG signal 1 In the delta band [0.5,4], the f of the HRV signal 2 The average coherence coefficient Coh in the range of LF[0.05,0.15] xyLF , As the coherence coefficient between the delta frequency band of the EEG signal and the HRV signal LF, and then calculate f 1 In the delta band [0.5,4], f 2 The average coherence coefficient Coh in the range of HF[0.15,0.4] xyHF , As the coherence coefficient between delta band and HF.
[0053] Coh xyLF = 1 n X i = 1 n Coh xy ( f 1 f 2 ) , 0.5 ≤ f 1 ≤ 4,0.05 ≤ f 2 ≤ 0.15 - - - ( 1 - 6 )
[0054] Coh xyLF = 1 m X i = 1 m Coh xy ( f 1 f 2 ) , 0.5 ≤ f 1 ≤ 4,0.15 ≤ f 2 ≤ 0 . 4 - - - ( 1 - 7 )
[0055] Among them, n is 0.5≤f 1 ≤4,0.05≤f 2 ≤0.15 Coh xy (f 1 f 2 ) Points, m is 0.5≤f 1 ≤4,0.15≤f 2 ≤0.4 Coh xy (f 1 f 2 ) Points.
[0056] 103: Perform principal component analysis (PCA) on 9 feature vectors;
[0057] The information contained in each parameter has a certain degree of overlap and correlation. If they are directly used for pattern recognition, it will cause over-fitting of model parameters and reduce the accuracy and reliability of classification, and it will be due to excessive data volume. Large and reduce the speed of classification. Therefore, before pattern classification, the present invention first uses PCA to perform dimensionality reduction processing on the obtained feature vectors.
[0058] According to the principle of maximizing variance, PCA uses a set of linearly independent and mutually orthogonal new vectors to represent the rows (or columns) of the original data matrix to achieve the purpose of compressing the number of variables, eliminating redundant information, and maximizing the preservation of effective information. The original vector group is (P 1 , P 2 ,..., P 9 ), the principal component vector group is denoted as (F 1 , F 2 ,...,F m ), usually m is less than 9. Then the relationship between the principal component and the original vector group is:
[0059] F 1 = a 11 P 1 + a 12 P 2 + . . . + a 19 P 9 F 2 = a twenty one P 1 + a twenty two P 2 + . . . + a 29 P 9 . . . F k = a k 1 P 1 + a k 2 P 2 + . . . + a k 9 P 9 . . . Fm = a m 1 P 1 + a m 2 P 2 + . . . + a m 9 P 9 - - - ( 1 - 8 )
[0060] Where F 1 Contains the most information and has the largest variance, called the first principal component, F 2 ,..., F m Decrease in order, called the second principal component, ..., the m-th principal component. Therefore, the process of principal component analysis can be regarded as determining the weight coefficient a ik (i=1,...,m;k=1,...9) process.
[0061] In the present invention, first observe the 9 variables n times, and the obtained observation data can be represented by the following matrix
[0062] P n * 9 = P 11 P 12 . . . P 1 h . . . P 19 P twenty one P twenty two . . . P 2 h . . . P 29 . . . . . . . . . . . . . . . . . . P b 1 P b 2 . . . P bh . . . P b 9 . . . . . . . . . . . . . . . . . . P n 1 P n 2 . . . P nh . . . P n 9 - - - ( 1 - 9 )
[0063] Where P bh Is the h-th feature of the b-th observation (that is, the b-th sample).
[0064] The process of using PCA for feature dimensionality reduction is as follows:
[0065] (1) For the original data P n*9 For standardization, the elements in the matrix are subtracted from the mean of the column, and then divided by the standard deviation of the column, so that the mean of each variable is 0 and the variance is 1, and the matrix P is obtained n*9 *.
[0066] P n*9 * =[y bh ] n*9 ,B=1,2,…,n; h=1,2,…,9 (1-10)
[0067] y bh = [ P bh - P h ¯ ] / S h - - - ( 1 - 11 )
[0068] among them P h ¯ = 1 n X b = 1 n P bh , S h = 1 n - 1 X b = 1 n ( P bh - P h ¯ ) 2 .
[0069] (2) Then find the covariance matrix C 9*9 ,P n*9 * The covariance between two variables can be calculated between any two columns, so the covariance matrix is ​​obtained:
[0070] C 9 * 9 = S 1 2 cov ( 1,2 ) . . . cov ( 1,9 ) cov ( 2,1 ) S 2 2 . . . cov ( 2,9 ) . . . . . . . . . . . . cov ( 9,1 ) cov ( 9,2 ) . . . S 9 2 - - - ( 1 - 12 )
[0071] (3) For the covariance matrix C 9 * 9 Carry out eigen-root decomposition to obtain eigen-root matrix 9*9 And feature vector U 9*9.
[0072] C 9*9 =U 9*9 Λ 9*9 U 9*9 ′ (1-13)
[0073] Where the feature vector U 9*9 The coordinate axis as the principal component forms a new vector space,
[0074] Where the characteristic root λ r The size of (r=1,2,...9) represents the amount of information contained in the r-th principal component. U 9*9 'Is U 9*9 The transposed matrix.
[0075] (4) Find the original data P n*9 Projection in the new vector space, namely the principal component vector group F n*9 :
[0076] F n*9 =P n*9 U 9*9 (1-14)
[0077] (5) Find the cumulative contribution rate. The size of the characteristic root of each principal component represents the amount of information it contains. Find the cumulative contribution rate of the first k (k=1,...,9) principal components.
[0078] pre k = X i = 1 k λ i X i = 1 9 λ i - - - ( 1 - 15 )
[0079] Where λ i Is the i-th characteristic root found.
[0080] (6) Select the preset cumulative contribution rate so that the first d principal components F n*d Perform pattern recognition as new data.
[0081] For example: a total of 8 principal components are obtained. The contribution rate of the first principal component F1 is 48%, the contribution rate of F2 is 32%, the contribution rate of F3 is 15%, and the total contribution rate of F4, F5, F6, F7, F8 is 5% (8 principal components Total contribution rate is 100%). Then the cumulative contribution rate of the first three principal components (F1, F2, F3) has reached 95%, that is, the first three principal components contain 95% of the information of the eight principal components, then, select these three principal components As new data for pattern recognition, the dimension of the feature matrix is ​​reduced while ensuring the amount of information.
[0082] 105: After feature extraction, use Support Vector Machine (SVM) classifier [7] Identify the characteristics and perform automatic sleep staging.
[0083] When using support vector machine for pattern recognition, the feature parameters after removing redundant information by PCA are used as the input parameters of training support vector machine, and the sleep staging is the output. After training, the automatic sleep staging based on EEG, HRV and their coherence is obtained. Predictive model, and then automatic sleep staging.
[0084] In summary, this method calculates the coherence coefficients of EEG and HRV parameters, and merges them with the frequency domain and nonlinear features of the extracted EEG and HRV signals as a feature matrix, and then uses PCA principal component analysis to remove redundant information, thereby Automatic sleep staging is accurate, objective and simple. This method can effectively improve the accuracy and simplicity of the automatic sleep staging system, and obtain considerable social and economic benefits. The best implementation plan is to adopt patent transfer, technical cooperation or product development. Due to the simple operation and strong sensitivity of this technology, products developed based on this technology can be applied to various scenarios such as sleep monitoring and sleep scientific research.
[0085] references
[0086] [1]Rechtschaffen A,Kales A.A Manual of standardized terminology,techniques and scoring system for sleep stages of human subjects[M].Washington D C:Government Printing Office,Public Health Service,1968:3-7
[0087] [2]Feng Zhouyan. Using wavelet entropy to analyze the dynamic characteristics of rat brain electrical signals[J]. Chinese Journal of Biophysics, 2002, 18(3): 325-330.
[0088] [3] Li Xiaoli, Cui Suyuan, Sleigh J W2. Estimation of depth of anesthesia based on Hilbert yellow entropy[J]. Chinese Journal of Biomedical Engineering, 2008, 27(5): 689-694.
[0089] [4]Broomhead DS,King GP.Extracting qualitative dynamics from experimental data[J].Physica D,1986,20:217-236.
[0090] [5]Scherpers HE,Von Beek JHGM,Bassingthwaighte JB.Four methods to estimate the fractal dimension from selfaffine signals[J].EngMedBiol,1992,11(6):57.
[0091] [6]Togo F,Yamamoto Y.Decreased fractal component of human heart rate variability during non-REM sleep[J].Am J Physiol Heart Circ Physiol.2000,280:H17–H21.
[0092] [7]Bennett K P,Campbell C.Support vector machines:hype or hallelujah?[J].ACM SIGKDDExplorations Newsletter,2000,2(2):1-13.
[0093] Those skilled in the art can understand that the accompanying drawings are only schematic diagrams of a preferred embodiment, and the serial numbers of the above-mentioned embodiments of the present invention are only for description, and do not represent the advantages and disadvantages of the embodiments.
[0094] The above descriptions are only preferred embodiments of the present invention and are not intended to limit the present invention. Any modification, equivalent replacement, improvement, etc. made within the spirit and principle of the present invention shall be included in the protection of the present invention. Within range.

PUM

no PUM

Description & Claims & Application Information

We can also present the details of the Description, Claims and Application information to help users get a comprehensive understanding of the technical details of the patent, such as background art, summary of invention, brief description of drawings, description of embodiments, and other original content. On the other hand, users can also determine the specific scope of protection of the technology through the list of claims; as well as understand the changes in the life cycle of the technology with the presentation of the patent timeline. Login to view more.

Similar technology patents

Useful work simplified calculation method based on different compositions of mine field

PendingCN111008775AImprove accuracyImprove accuracy and simplicityResourcesPhysicsChemistry
Owner:CHINA PETROLEUM & CHEM CORP +1

Remote fault diagnosis system and method for concrete batching plants

ActiveCN103901878ASolve the long maintenance cycleGood economic and social benefitsElectric testing/monitoringDatabase maintenanceGeolocation
Owner:SHANTUI JANEOO MACHINERY

Classification and recommendation of technical efficacy words

Why Eureka
Try Eureka