Synchronous measuring system of concentration of silt and fluctuation velocity of water flow of low concentration muddy water
A pulsating velocity, synchronous measurement technology, applied in fluid velocity measurement, velocity/acceleration/impact measurement, measurement device, etc. Realize the effect of long-term measurement and pulse concentration measurement
- Summary
- Abstract
- Description
- Claims
- Application Information
AI Technical Summary
Problems solved by technology
Method used
Image
Examples
Embodiment 1
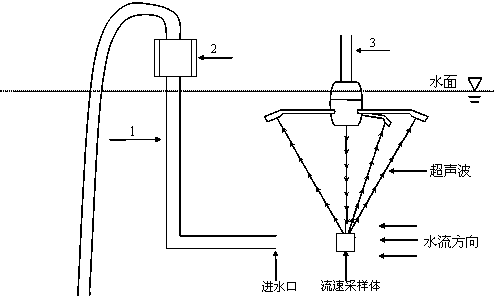
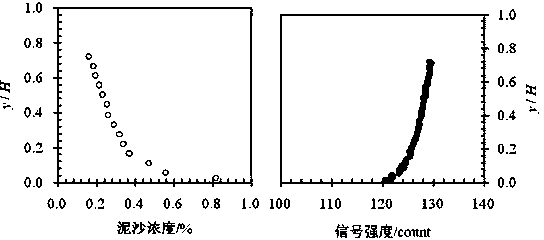
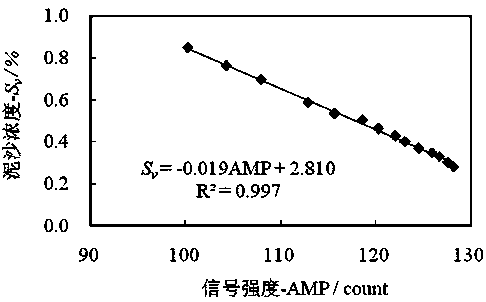
[0033] The study of low-concentration muddy water is often carried out in a laboratory tank with a length of 12 m, a width of 0.42 m, and a height of 0.7 m. A constant and uniform flow of muddy water with a water depth of 15 cm and a stable concentration is formed in the tank. The concentration of sediment in the water depth direction is different, and the accurate concentration of sediment at different water depths can be determined by using the sediment sampling device. When the Acoustic Doppler Flow Meter 3 is working, the signal intensity in the water depth direction is also different. The correlation analysis between the sediment concentration and the signal intensity is carried out. The corresponding relationship between the two is as follows: figure 2 shown. From this, the functional relationship between the signal strength and the sediment concentration is determined, such as image 3 shown.
[0034] The correlation between the sediment concentration and the signal ...
Embodiment 2
[0036] The water flow conditions and the average concentration of sediment in the laboratory tank were changed to form a constant and uniform muddy water flow with a water depth of 12 cm and a stable concentration in the tank. Similarly, the concentration of sediment in the water depth direction is different, and the accurate sediment concentration value can be determined by the sediment sampling device. When the Acoustic Doppler Current Meter 3 works, the signal strength in the water depth direction is also different. The experimental results show that the corresponding relationship between the two is as follows: Figure 4 shown. From this, the functional relationship between the signal intensity and the sediment concentration can be determined, such as Figure 5 shown.
[0037] The correlation between the signal intensity and the sediment concentration reaches 0.987. The relationship between the signal intensity and the sediment concentration can be used to calculate the s...
Embodiment 3
[0039]When the Acoustic Doppler Velocimeter 3 works in muddy water, the scattering of the acoustic signal by the sediment concentration will weaken the signal strength, and if the sediment concentration is too high, it may even cause the Acoustic Doppler Velocimeter 3 to fail to work normally in muddy water. like Image 6 As shown, the working condition of the acoustic Doppler flow meter 3 was verified when the concentration of sediments with particle sizes of 0.089mm, 0.119mm, 0.234mm, 0.425mm, and 0.75mm was changed from small to large. During the test, fix the probe of the Doppler current meter underwater, keep the distance between the transmitting probe and the bed surface unchanged, gradually increase the sediment concentration, and observe the distance between the probe and the bed surface measured by the acoustic Doppler current meter 3 value.
[0040] When the sediment volume ratio concentration is less than about 0.014, the measurement result is stable, and when the ...
PUM
 Abstract
Description
Claims
Application Information
 - R&D
- Intellectual Property
- Life Sciences
- Materials
- Tech Scout
- Unparalleled Data Quality
- Higher Quality Content
- 60% Fewer Hallucinations
Browse by: Latest US Patents, China's latest patents, Technical Efficacy Thesaurus, Application Domain, Technology Topic, Popular Technical Reports.
© 2025 PatSnap. All rights reserved.Legal|Privacy policy|Modern Slavery Act Transparency Statement|Sitemap|About US| Contact US: help@patsnap.com


