Fault Vector Analysis and Fault Diagnosis Method Based on Main Wiring Diagram Mapping in Station

A technology of vector analysis and main wiring diagram, applied in special data processing applications, instruments, electrical digital data processing, etc., can solve the problem that fault data cannot be displayed uniformly and intuitively.

Active Publication Date: 2017-01-04
STATE GRID CORP OF CHINA +2
View PDF2 Cites 0 Cited by
  • Summary
  • Abstract
  • Description
  • Claims
  • Application Information

AI Technical Summary

Problems solved by technology

[0003] However, the fault data of each interval cannot be displayed uniformly and intuitively on the station map. With the existing power fault vector analysis and fault diagnosis module, it is difficult for the dispatcher to accurately identify and quickly locate the fault by calculating the fault current vector sum of the relevant area at the time of the fault.

Method used


Image

  • Fault Vector Analysis and Fault Diagnosis Method Based on Main Wiring Diagram Mapping in Station
  • Fault Vector Analysis and Fault Diagnosis Method Based on Main Wiring Diagram Mapping in Station
  • Fault Vector Analysis and Fault Diagnosis Method Based on Main Wiring Diagram Mapping in Station

Examples


Embodiment Construction

[0048] The present invention is described in detail below in conjunction with accompanying drawing:

[0049] The fault vector analysis and fault diagnosis method based on the mapping of the main wiring diagram in the station includes the following steps:

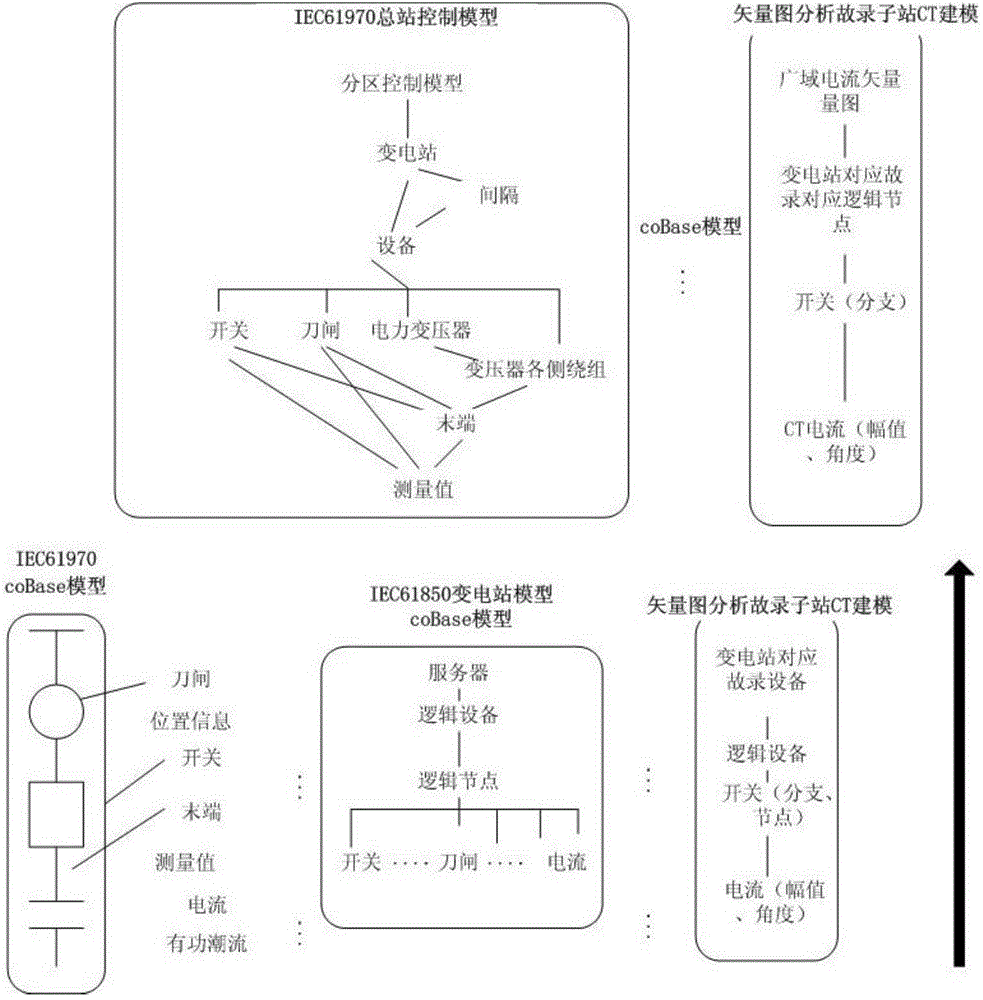
[0050] Step 1: Build model information of all CT current transformers in the station based on CT modeling on the coBase platform;

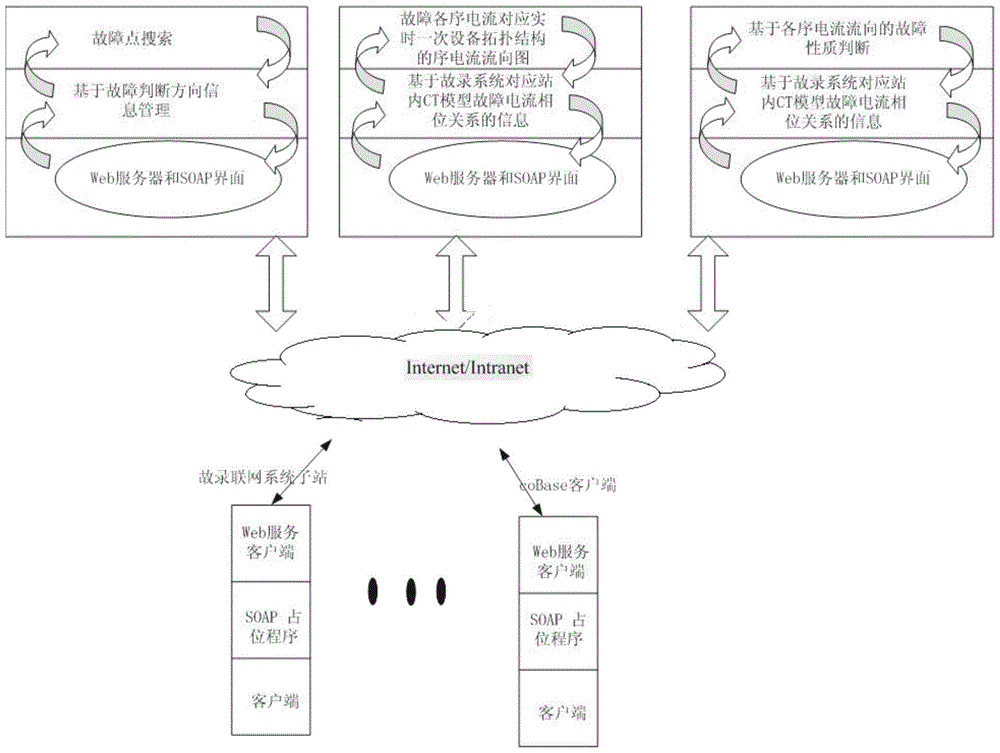
[0051] Step 2: Establish a fault vector analysis and fault diagnosis platform based on CT modeling and real-time intra-station map mapping, integrate the basic data platform of the substation and the fault recording network system through the data interface, and distribute the data in the relational database of the entire network. Use directory services to access these databases based on a hierarchical tree structure, and provide real-time integrated data from multiple sources to the functional fault vector analysis and fault diagnosis platform;

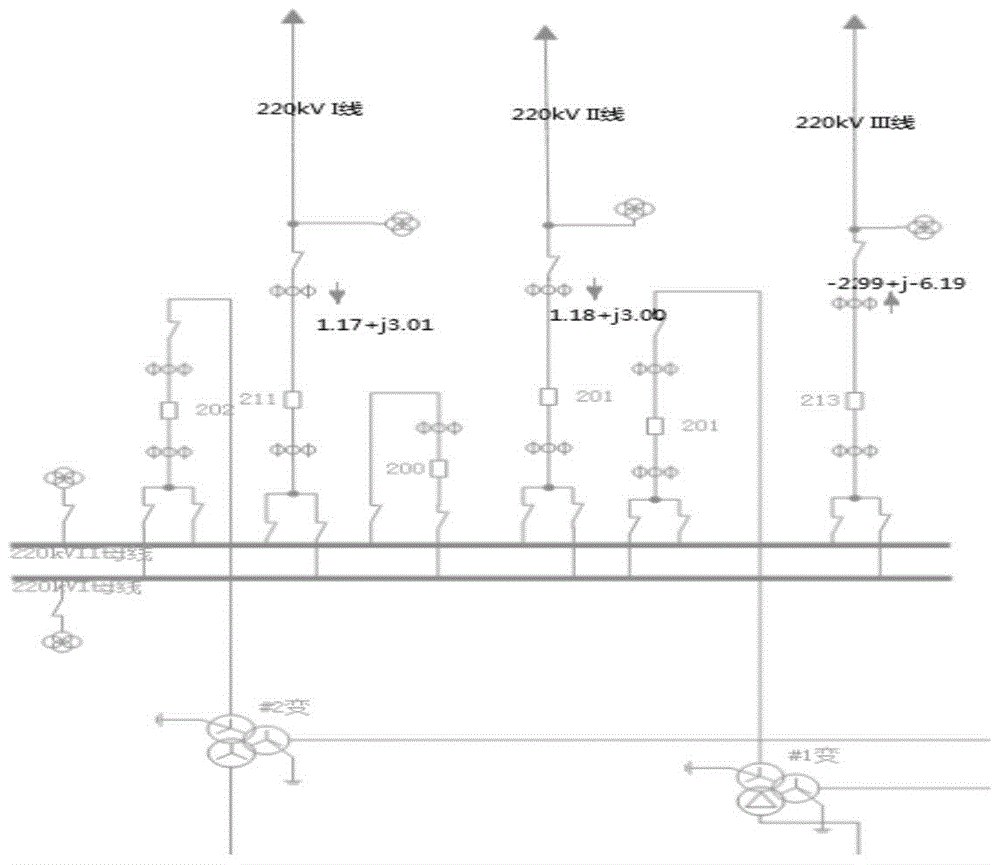
[0052] Step 3: Fault quantity vector analysis, ...


PUM


Abstract

The invention discloses a fault vector analysis and fault diagnosis method based on mapping of an instation main wiring diagram. Modeling is carried out according to an IEC61970, and therefore characteristic quantity information can be extracted in a unified mode for setting up all instation CTs, wherein the characteristic quantity information includes model information such as corresponding installation positions and transformation ratios; meanwhile, the CTs correspond to instation fault recorder channels, specific physical quantities such as flow directions and magnitudes of currents corresponding to instation equipment are mapped to a visual current vector diagram interface based on nodes and branch circuits through an intermediate quantity, namely, CT modeling, a fault current flow direction diagram based on various sequence networks can be obtained through a filtering algorithm, accordingly a series of analyses of quick locking of the current flow directions, fault location and fault nature judgment after faults can be achieved and a visual and effective analysis platform is provided.

Description

technical field [0001] The invention relates to the field of grid fault vector analysis and fault diagnosis, in particular to a fault vector analysis and fault diagnosis method based on mapping of main wiring diagrams in a station. Background technique [0002] As the scale of the power grid continues to expand and the connection between the power grid continues to strengthen, the probability of power grid failures and partial failures leading to expanded coverage continues to increase. In order to achieve rapid identification and accurate positioning of faults, the coverage of the fault recorder networking system continues to increase. When the power grid fails, the relevant fault recording information can be uploaded to the dispatch center in time. [0003] However, the fault data of each interval cannot be displayed uniformly and intuitively on the station map. With the existing power fault vector analysis and fault diagnosis module, it is difficult for the dispatcher to ...

Claims


Application Information

Patent Timeline
Patent Type & Authority Patents(China)
IPC IPC(8): G06F17/50G06Q50/06
Inventor 唐毅李磊李乃永朱倩茹黄德斌王安宁王昕林霞王群张英彬李强
Owner STATE GRID CORP OF CHINA
Why Eureka
Try Eureka