

Method for measuring blood flow velocity by utilization of radiography microbubbles
A blood flow velocity and microbubble technology, applied in blood flow measurement devices, image analysis, image enhancement, etc., can solve the problems of cumbersome and repetitive manual measurement methods, and achieve the effects of high repeatability and simple measurement methods.
- Summary
- Abstract
- Description
- Claims
- Application Information
AI Technical Summary
Problems solved by technology
Method used
Image

Examples
Embodiment 1
[0050] Example 1: Tracking Velocimetry of a Single Microbubble
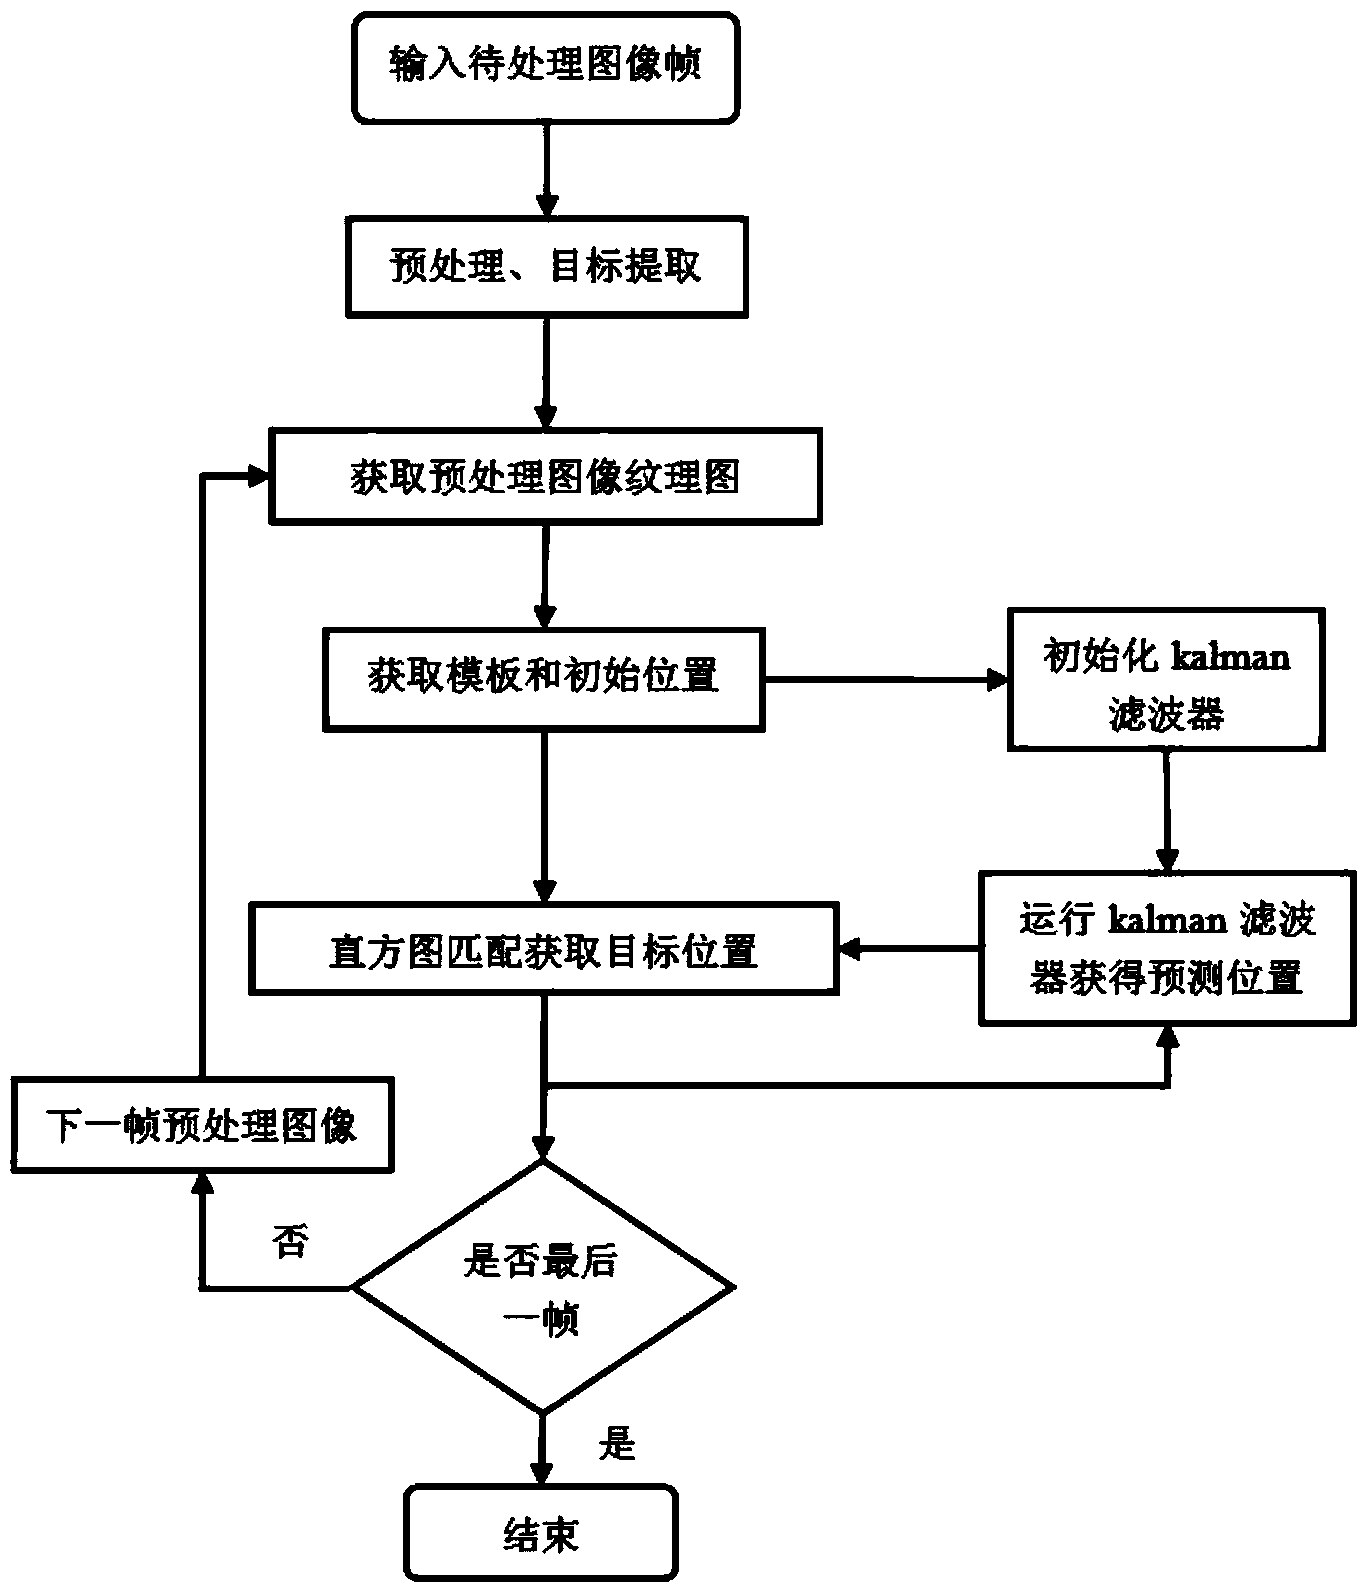
[0051] By tracking individual ultrasound microbubbles, the blood flow velocity of simulated vessels and perihepatic vessels in vitro were measured, respectively. In the experiment, ultrasound contrast-enhanced microbubbles were injected into simulated blood vessels in vitro and blood vessels near the liver, and video images of microbubble movement were recorded. Through the algorithm proposed by the invention, the moving microbubble is detected, tracked and measured.
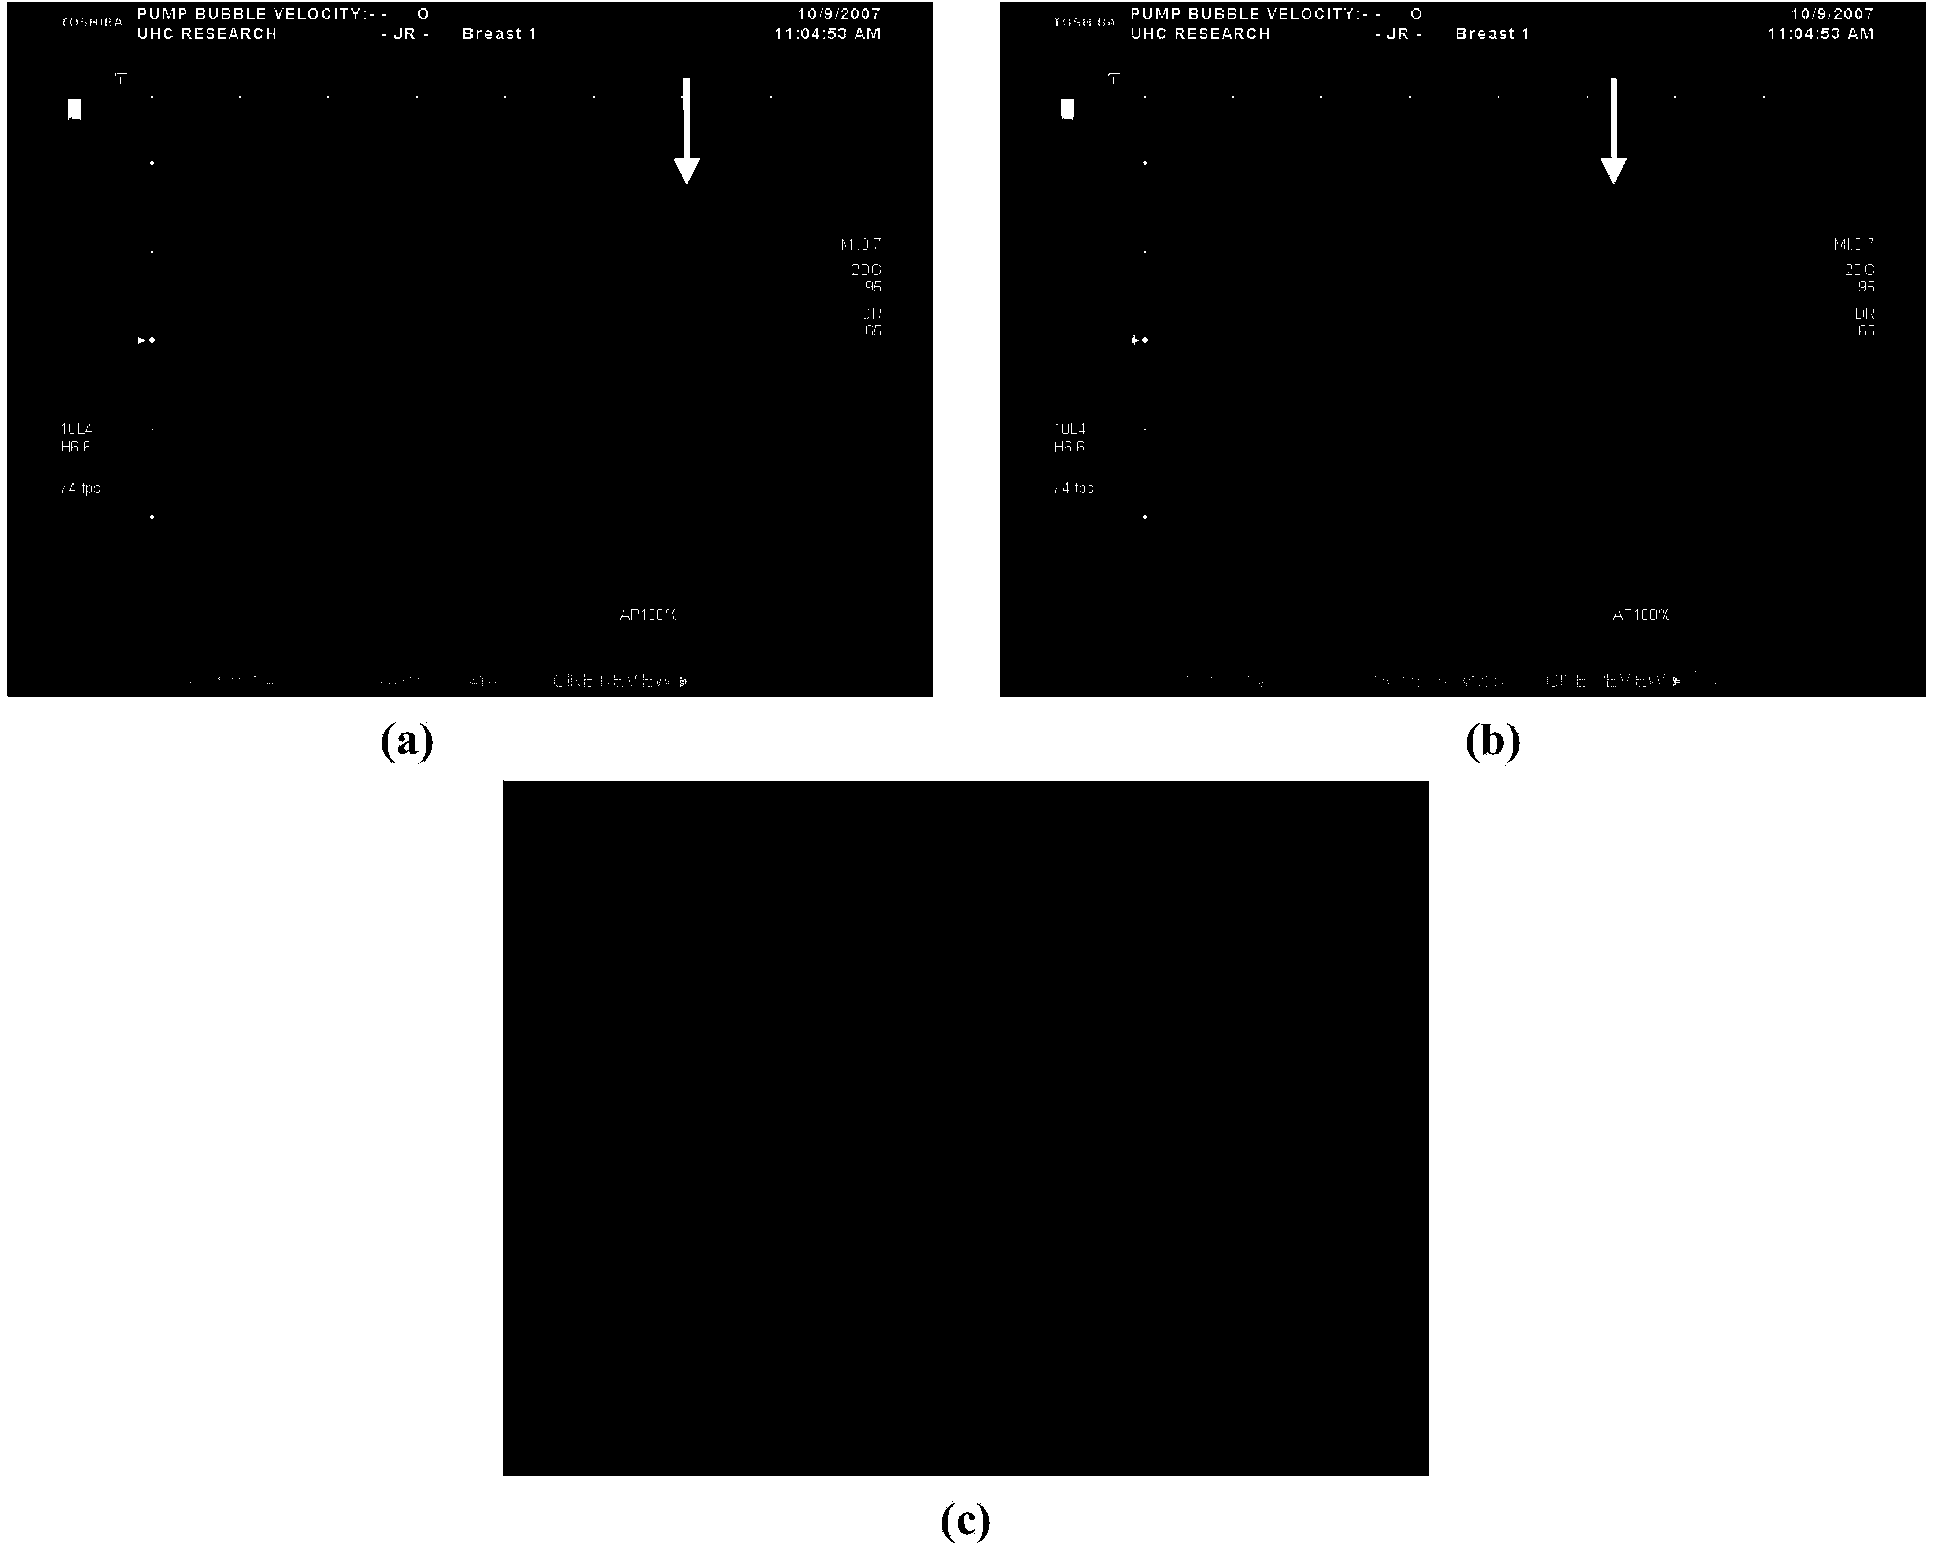
[0052] figure 2 (a)(b) are two adjacent frames of images containing contrast microbubbles in the in vitro simulated blood vessel video, and the arrow points to the position of the target microbubble; figure 2 (c) is the image after target segmentation by anisotropic diffusion filter and improved inter-frame difference algorithm.
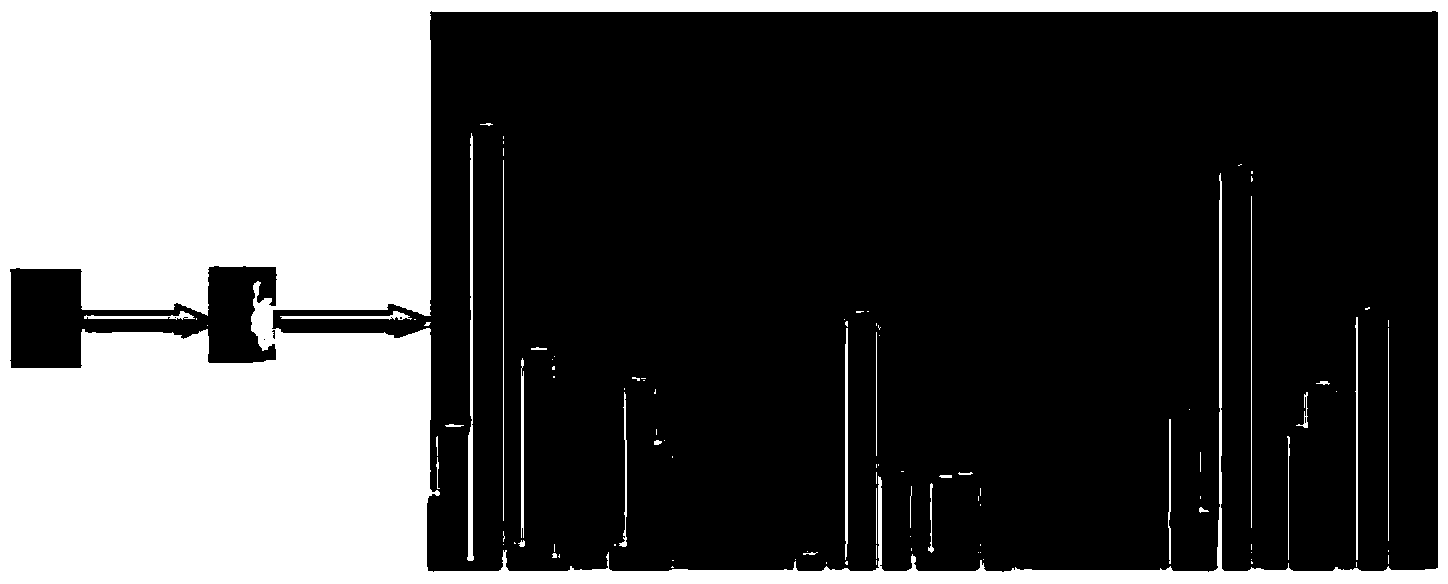
[0053] extract figure 2 The moving target template in (c), calculate the LBP texture characteristic histogram of...
Embodiment 2
[0056] Embodiment 2: Tracking Velocimetry of Multiple Microbubbles
[0057] The blood flow velocity in the rabbit ear blood vessel was measured by respectively tracking two contrast microbubbles in the rabbit ear blood vessel. For the tracking speed measurement of multiple microbubbles, the implementation method is the same as that in Embodiment 1. Two target microbubble templates are respectively extracted through preprocessing and moving target segmentation algorithms, and their LBP texture histograms are respectively calculated for tracking and matching. The obtained velocity values and motion trajectories of the two microbubbles in each frame are as follows: Image 6 As shown, the comparison of the measurement results and the error analysis are as follows Figure 7 shown. It can be seen that the tracking of the two microbubbles does not interfere with each other, and the measurement error is also about 4%.
PUM
 Abstract
Description
Claims
Application Information