Gyroscope fault diagnosis method based on EMD (Empirical Mode Decomposition) and entropy weight
A fault diagnosis and gyroscope technology, applied in the direction of instruments, measuring devices, etc., can solve problems such as weak adaptability of single signal fault detection, insufficient monitoring of gyroscope operation, limitations of practicability and effectiveness, etc., to improve fault diagnosis Ability, improved adaptability, and wide-ranging effects
- Summary
- Abstract
- Description
- Claims
- Application Information
AI Technical Summary
Problems solved by technology
Method used
Image
Examples
specific Embodiment approach 1
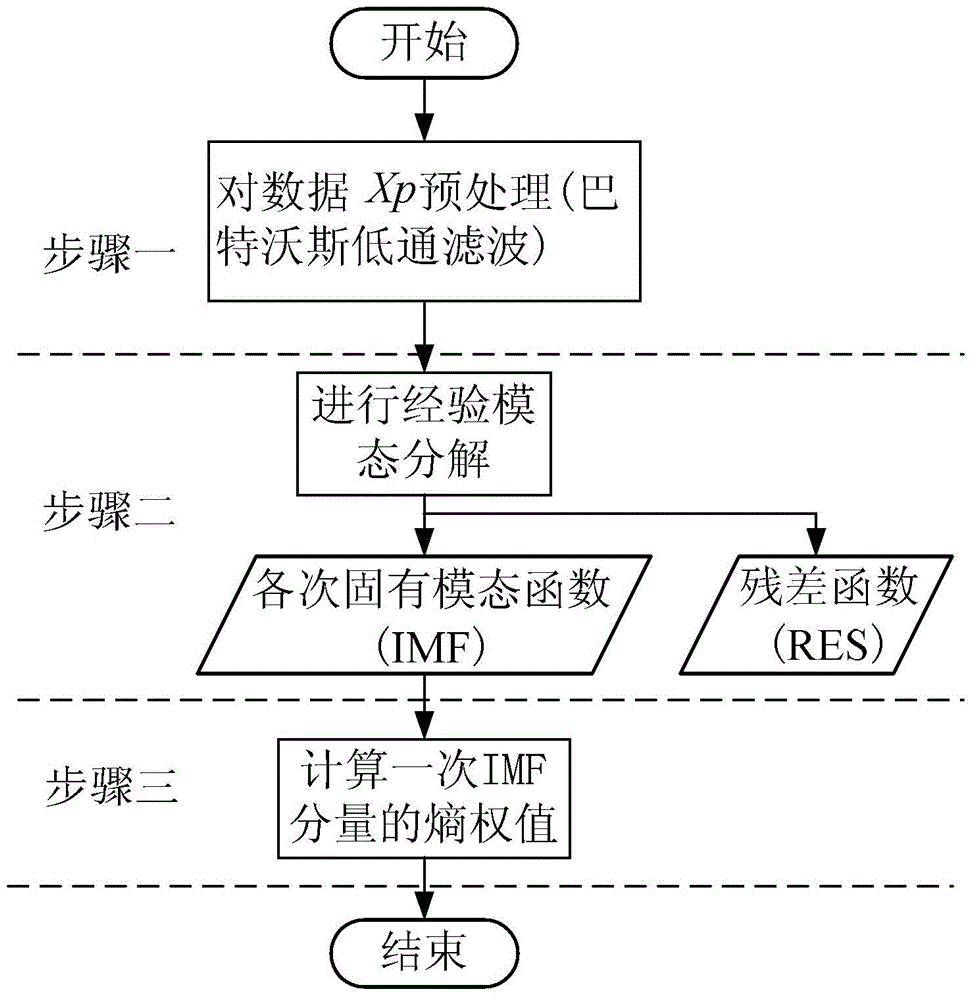
[0029] Specific embodiment one: the gyroscope fault diagnosis method based on EMD and entropy weight described in the present embodiment is characterized in that described method is realized according to the following steps:
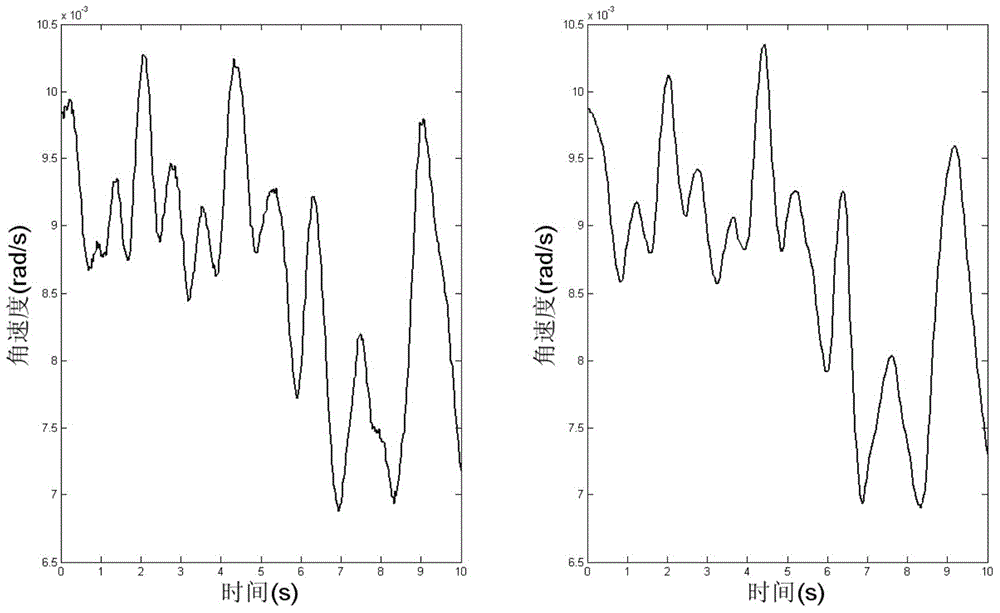
[0030] Step 1: Output data X for the original gyroscope angular velocity p Select 10s in the form of a sliding window, filter and preprocess the data based on the Butterworth low-pass filter, and use it as a signal for fault diagnosis, denoted as X;
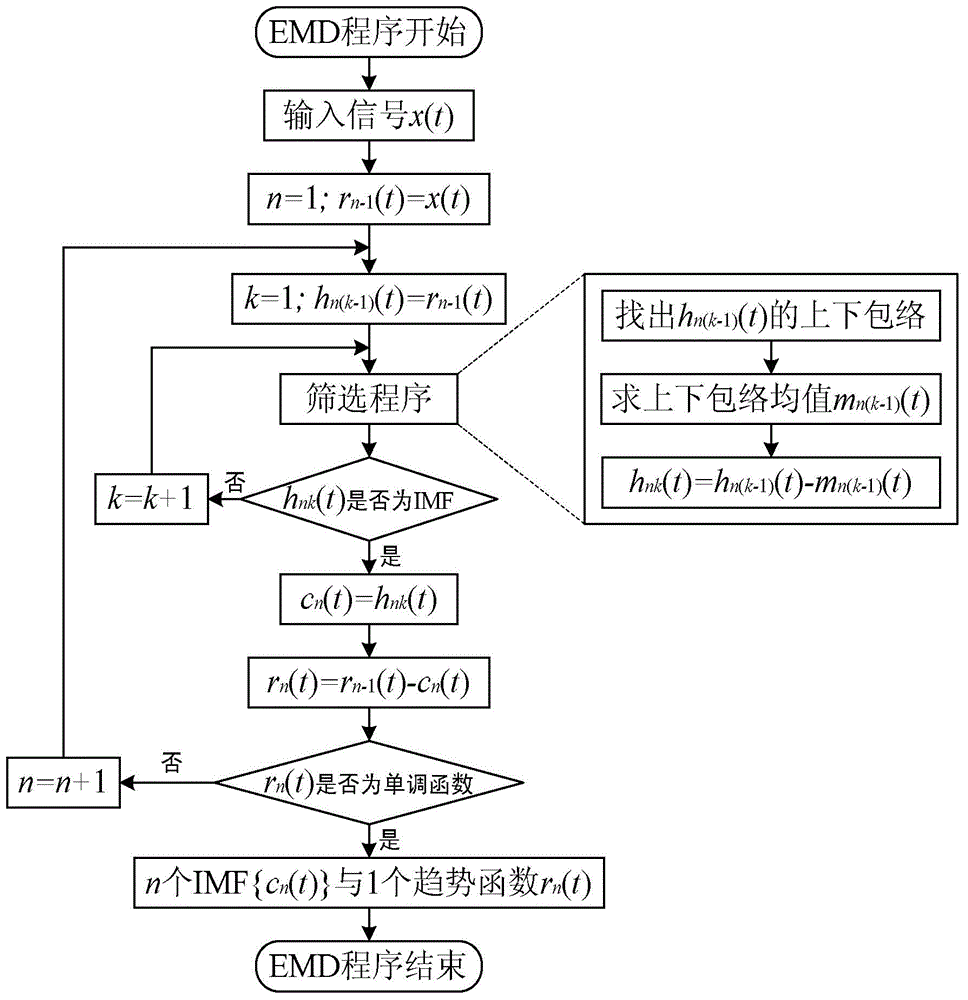
[0031] Step 2: Use the EMD method to decompose the fault diagnosis signal X obtained in Step 1 to obtain each IMF component and residual component RES;
[0032] Step 3: Select the primary IMF component obtained in step 2 as the feature quantity for entropy weight calculation, calculate the energy entropy of the selected primary IMF component by the energy entropy formula, and then obtain the change value of entropy weight, and calculate the value according to the entropy weight change threshold Gyroscope f...
specific Embodiment approach 2
[0061] Specific implementation mode two: the difference between this implementation mode and specific implementation mode one is: the specific process of step one is:
[0062] Step one one, convert the performance index of the low-pass digital filter into the performance index of the corresponding analog low-pass filter according to the bilinear transformation rule; wherein, the performance index includes the passband cut-off frequency w p , stop band cut-off frequency w s , the maximum attenuation α of the passband p Minimum attenuation α with stopband s ;
[0063] Step one and two, use the Butterworth low-pass filter approximation method to calculate the performance index of the obtained analog low-pass filter to obtain the filter order, and obtain the simulation through Table 1, the Butterworth low-pass filter system function list The system function of the low-pass filter, using the system function of the analog low-pass filter as a sample for designing a digital filter...
specific Embodiment approach 3
[0070] Specific implementation mode three: the difference between this implementation mode and specific implementation mode one or two is: the sample described in step one or two is as follows:
[0071] Butterworth low-pass filter system function In the formula, b(s) is the numerator polynomial, a(s) is the denominator polynomial, specifically expressed as: a(s)=s N +a N-1 the s N-1 +…+a 2 the s 2 +a 1 s+1(a 0 =a N =1), s represents a complex variable, N represents the order of the Butterworth low-pass filter, a N ,a N-1 ,a N-2 ,...,a 2 ,a 1 ,a 0 Represents the coefficients of the denominator polynomial. Other steps are the same as those in the first to third specific embodiments.
PUM
 Abstract
Description
Claims
Application Information
 - R&D
- Intellectual Property
- Life Sciences
- Materials
- Tech Scout
- Unparalleled Data Quality
- Higher Quality Content
- 60% Fewer Hallucinations
Browse by: Latest US Patents, China's latest patents, Technical Efficacy Thesaurus, Application Domain, Technology Topic, Popular Technical Reports.
© 2025 PatSnap. All rights reserved.Legal|Privacy policy|Modern Slavery Act Transparency Statement|Sitemap|About US| Contact US: help@patsnap.com


