Eureka AIR delivers breakthrough ideas for toughest innovation challenges, trusted by R&D personnel around the world.

Temperature variation sensing and index calculating method of textiles

A test method and index calculation technology, applied in the direction of calculation, special data processing applications, instruments, etc., can solve the problems of unscientific and reasonable test methods and indexes of cold and warm feeling, loss of comparability, and difficulty in quantification, and achieve the scientific rigor of test methods, Control random errors and simple quantification of indicators

Inactive Publication Date: 2015-01-28
DONGHUA UNIV +1
View PDF7 Cites 15 Cited by
  • Summary
  • Abstract
  • Description
  • Claims
  • Application Information

AI Technical Summary

Problems solved by technology

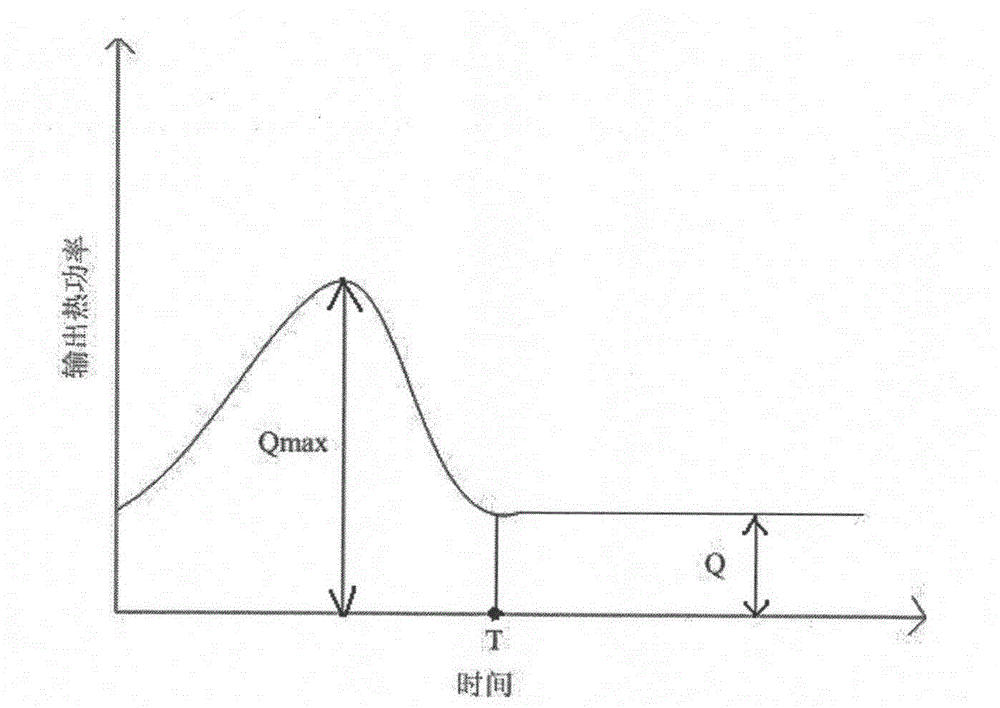
[0011] The technical problem to be solved by the present invention is to provide a textile cooling and warming test and index calculation method for evaluating the cooling and warming characteristics of planar or curved fiber aggregates, which solves the following problems: the subjective evaluation of textiles’ cooling and warming is difficult to quantify , Large random error; the existing test methods and indicators of coldness and warmth are not scientific and reasonable, because neither the human body nor the instrument hardware can quickly output thermal power indefinitely for a sample with a strong sense of coldness; it cannot reflect the coldness that is crucial to comfort The length of sensing time; when the difference in steady-state heat conduction Q is large, the maximum transient heat flow Q max also loses comparability

Method used


Image

  • Temperature variation sensing and index calculating method of textiles
  • Temperature variation sensing and index calculating method of textiles
  • Temperature variation sensing and index calculating method of textiles

Examples


Embodiment 1

[0074] 1. Sample information

[0075] Goose down quilt, process parameters: core material 90% goose down, core material weight 239.13g / m 2 ;ingredient: 100% cotton.

[0076] 2. Thermal power curve test of sample heat transfer

[0077]The instrument used is shown in the invention patent 201210587792.8, and 6 sets of heating elements are evenly distributed on the central test hot plate. The test method of thermal power curve is as follows:

[0078] (1) Sample balance: 2 samples to be tested and 1 identical preheated sample are suspended in a standard constant temperature and humidity room with a temperature of 20°C and a relative humidity of 65% for 24 hours to balance the temperature and humidity inside and outside the sample; The average index of the two samples is used as the characteristic index of the batch of samples; about 15 minutes before the test, put the balanced sample to be tested into a plastic bag and seal it, then move it into the test room, and the moving sam...

Embodiment 2

[0092] 1. Sample information

[0093] Duck down quilt, process parameters: core material 90% duck down, core material weight 58.7g / m 2 ;ingredient: 100% cotton.

[0094] 2. Thermal power curve test of sample heat transfer

[0095] Apparatus and test method used are the same as embodiment 1, and the heat power curve that records a sample is as follows Figure 4 As shown, the thermal power curve of another sample is the same as Figure 4 similar.

[0096] 3. Calculation of coldness and warmth index

[0097] The calculation method of the coldness and warmth index is the same as that in Example 1, and each sample and its average coldness and warmth index are shown in Table 1.

[0098] 4. Test results of cold and warm feeling

[0099] The test indicators of the two samples to be tested are averaged to obtain the cold and warm characteristic indicators of the eiderdown quilt after equilibrium treatment at a temperature of 20°C and a relative humidity of 65%, as shown in the la...

Embodiment 3

[0103] 1. Sample information

[0104] Old quilts, process parameters: core material 100% cotton, core material weight 600g / m 2 ;ingredient: 100% cotton.

[0105] 2. Thermal power curve test of sample heat transfer

[0106] Apparatus or test method used are the same as embodiment 1, and the heat power curve that records a sample is as follows Figure 7 As shown, the thermal power curve of another sample to be tested is the same as Figure 7 similar.

[0107] 3. Calculation of coldness and warmth index

[0108] The calculation method of the coldness and warmth index is the same as that in Example 1, and each sample and its average coldness and warmth index are shown in Table 2.

[0109] 4. Test results of cold and warm feeling

[0110] Average the test indexes of the two samples to obtain the cold and warm characteristic index of the old cotton quilt after balanced treatment at a temperature of 20°C and a relative humidity of 65%, as shown in the last row of Table 2.

[0...


PUM


Abstract

The invention relates to a temperature variation sensing and index calculating method of textiles. The method comprises the steps of testing a to-be-tested test sample in a required temperature and humidity environment after balancing; preheating a preheating test sample covered with an instrument hot plate, replacing the preheated test sample by utilizing the to-be-tested test sample, starting the test and recording a thermal power curve; defining a cold sensing time T as a peak of an initial section of the thermal power curve, i.e. a period of cold feeling time; defining the total heat loss W1 in the cold feeling time as the total heat loss of a unit area of the test sample in the cold feeling time T; defining the pure cold feeling heat loss W2 as the heat transferred from the human body to the textile due to the temperature difference at the beginning of the contact between the textile and the skin of a human body, wherein the pure cold feeling heat loss W2 is calculated in a way of subtracting the heat transferred by a unit area of test sample under the steady-state heat transfer condition within the period of time T from the total heat loss in the cold feeling time. The method is used for evaluating the temperature variation characteristic of a planar or curved fiber aggregation.

Description

technical field [0001] The invention relates to a method for testing the coldness and warmth of textiles and an index calculation method, belonging to the field of textile detection. Background technique [0002] The thermal properties of textiles are crucial to textile comfort. The feeling of cold and warm contact is an important part of the thermal performance of products, and it is also an important index for evaluating the thermal comfort of textiles and their uses. [0003] The so-called warm and cold feeling or thermal comfort of textiles refers to the judgment of cold or warm formed in the human brain by the temperature stimulation of the human skin after contact with the skin. The average body surface temperature is generally 33°C, and the temperature of textiles in winter and autumn is often lower than that of the skin. Heat will flow rapidly from the high-temperature body surface to the low-temperature textiles at the beginning of contact, until the temperature of...

Claims


Application Information

Patent Timeline
Patent Type & Authority Applications(China)
IPC IPC(8): G01N25/20G06F19/00
Inventor 王府梅王茜章军华齐迪迪
Owner DONGHUA UNIV
Why Eureka
Eureka Blog
Learn More