
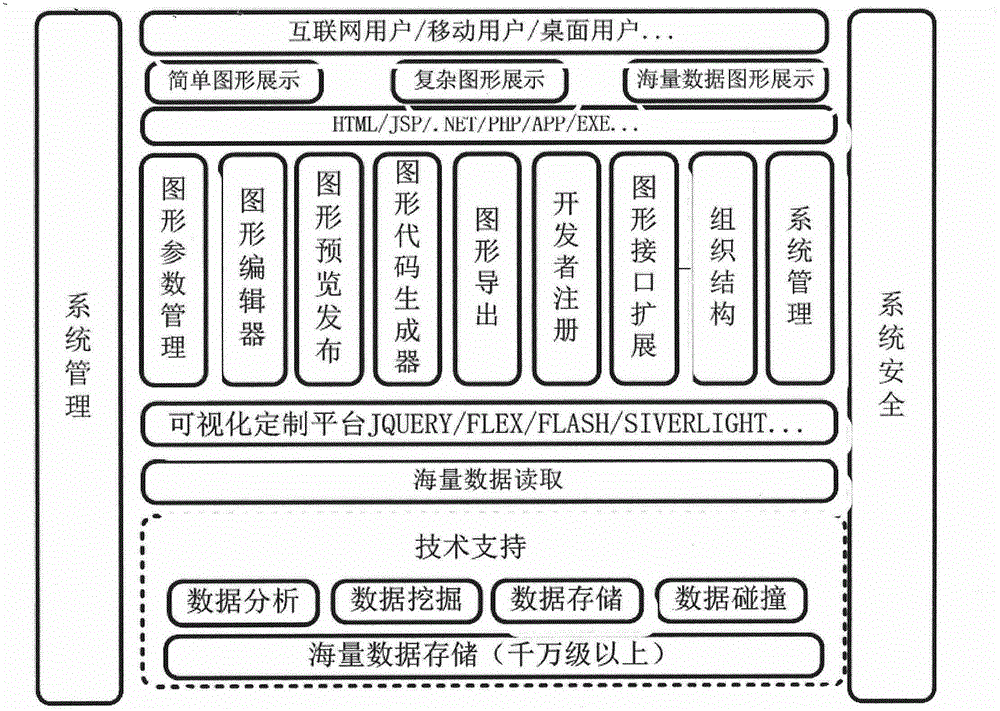
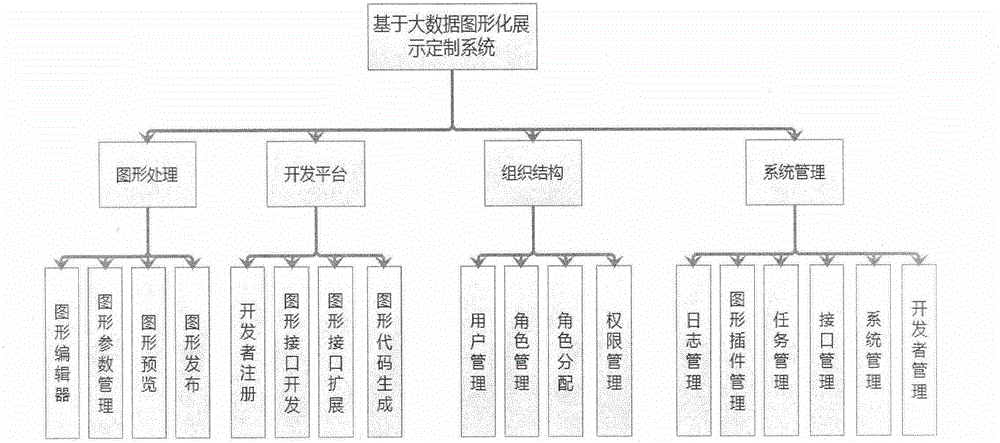
Big-data-based graphic presentation customizing system

A graphical display and custom system technology, applied in the field of electrical digital data processing, can solve the problems of troublesome deployment, large amount of data, slow display efficiency, etc.

Inactive Publication Date: 2015-04-29
BEIJING CHENRUN FENGQING INFORMATION TECH
View PDF2 Cites 15 Cited by
  • Summary
  • Abstract
  • Description
  • Claims
  • Application Information

AI Technical Summary

Problems solved by technology

[0005] 1. It is a commercial plug-in, which is expensive;
[0006] 2. Deployment is troublesome, and developers cannot get started quickly;
[0007] 3. Users cannot perform reasonable operations on the displayed results, and the graphic effect is not satisfactory;
[0008] 4. The data analysis and mining results based on large data sets have a large amount of data, so the display efficiency is slow and the display results are not intuitive;
[0009] 5. Because it is a foreign plug-in, it is impossible to customize and expand the graphical display solution. With the continuous development of big data analysis and mining technology, the traditional data display technology can no longer meet the needs of big data. No matter from the display In terms of style, loading performance, or display diversification, traditional data display is helpless in the face of big data.

Method used


Image

  • Big-data-based graphic presentation customizing system
  • Big-data-based graphic presentation customizing system
  • Big-data-based graphic presentation customizing system

Examples


Embodiment 1

[0097] Such as Figure 6-8 As shown, the simple graphic display is mainly based on 2D graphic display effects, mainly including various display effects currently popular on the Internet, including the simplest histogram, pie chart, line graph, area graph, etc.

[0098] Such as Figure 9-12 As shown, the complex graphic display is mainly based on complex 2D graphics and 3D display effects, mainly including: heat map, bubble map, stock map, star chasing map, instrument map, cloud map, etc.

[0099] Big data graphic display is to analyze and mine the data on the basis of large data sets to obtain the results, and display the results in the form of graphics. The analysis results of big data often also contain a large amount of result data. In order to display these result data in the form of graphics, there are high requirements for data processing speed, reading speed, and graphics drawing efficiency. At present, The more popular big data graphics display effects include: nebul...

Embodiment 2

[0101] Implementation steps: By analyzing the social networking site data (Sina Weibo), get the association relationship between microbloggers in the social data, use the graphical display customization system to draw the association relationship graph, the drawing steps are as follows Figure 20 shown.

[0102] Step 1: By calling the association relationship analysis and extraction algorithm, store all the association relationship analysis results in the relational database. The database storage format is as follows:

[0103] entity one entity two entity relationship Lawyer Yuan Yulai Columnist collaborator Mortal Shawshank Wei Zhuang gossip free conscience snow clear couple Zhang San Li Si friend Wang Wu Zhao Liu colleague ... ... ...

[0104] Step 2: Developer registration, register as a developer of the big data graphical display customization system, obtain the 1icense and developer code of the system, i...


PUM


Abstract

The invention discloses a big-data-based graphic presentation customizing system (BCSS) and relates to the field of electronic and digital data processing. The system comprises four modules namely a graphic processing module, a development module, an organization structure module and a management system module. On the premise of mass data, graphic presentation research serves as the core, custom flexible configuration serves as a goal, the most advanced UI presentation scheme at the present is adopted, and a comprehensive graphic presentation system is compatible with mainstream UI presentation technologies such as Flex, Flash, HTML5, Siverlight and Jquery.

Description

technical field [0001] The present invention relates to the field of electrical digital data processing, in particular to a big data-based graphical display customization system (BCSS), which takes massive data as the premise, takes graphical display research as the core, and aims at customizing and flexible configuration. The cutting-edge UI display solution is also a comprehensive graphic display system compatible with mainstream UI display technologies such as Flex, Flash, HTML5, Siverlight, and Jquery. Background technique [0002] With the continuous development of science and technology, the popularity of the Internet, the prevalence of social networking sites, and the continuous improvement of office automation, more and more data information is constantly affecting our life, study, and work. Big data information has penetrated into the In every corner of our society, his influence has begun to change our habits in a subtle way. [0003] The so-called data visualizat...

Claims


Application Information

Patent Timeline
IPC IPC(8): G06F9/44
Inventor 庞艳民
Owner BEIJING CHENRUN FENGQING INFORMATION TECH
Learn More