Financial time series similarity query method based on K-chart expression

A financial time series and query method technology, applied in the field of financial time series data analysis and mining, can solve the problems of reduced query efficiency, low data scale scalability, low index overhead, etc., and achieves high quantitative accuracy, query efficiency, flexibility The effect of efficient query processing and low space overhead

Inactive Publication Date: 2015-04-29
ZHEJIANG UNIV
View PDF3 Cites 16 Cited by
  • Summary
  • Abstract
  • Description
  • Claims
  • Application Information

AI Technical Summary

Problems solved by technology

Such methods include segmented aggregation approximation, segmented linear approximation, symbolic aggregation approximation, singular value decomposition, principal component analysis, etc. The first three methods need to segment the original time series first, and then process each sub-segment separately (Segmented aggregation approximation is to calculate the average value of each segment, segmented linear approximation is to perform line segment fitting on each segment, and symbolic aggregation approximation is to discretize the average value of each segment into symbols based on segmental aggregation approximation), because The extracted features are relatively simple, which makes it less capable of expressing time series fluctuation patterns
Singular value decomposition and principal component analysis are implemented by performing a unified characteristic matrix decomposition on all time series. The typical defects of these two types of methods are high computational complexity, and the decomposition process can only be completed in memory, and the scalability of data scale is very low.
[0005] Most of the indexing methods used in the industry so far are tree-based spatial indexes. B-trees were first used to index one-dimensional data and are the basis of many hierarchical index structures; R-tree series, such as R*-tree, R + -Trees, etc., use the minimum bounding rectangle to organize data, but the minimum bounding rectangle will cover a large amount of space without data, resulting in a large number of "false hits" in the query results, thereby reducing query efficiency; A-tree uses a vector approximation file to store the minimum The upper and lower boundaries of the bounding rectangle and virtual bounding rectangle, thus ensuring low indexing overhead and high query completeness
Due to the high-dimensional or ultra-high-dimensional characteristics of the time series in industrial production, even if the dimensionality reduction process is performed within the acceptable range of precision loss, it may still have a very high dimensionality. Therefore, the tree-based index method is prone to "dimensionality". "disaster" problem

Method used


Image

  • Financial time series similarity query method based on K-chart expression
  • Financial time series similarity query method based on K-chart expression
  • Financial time series similarity query method based on K-chart expression

Examples


Embodiment Construction

[0032] The present invention will be described in further detail below in conjunction with the accompanying drawings.

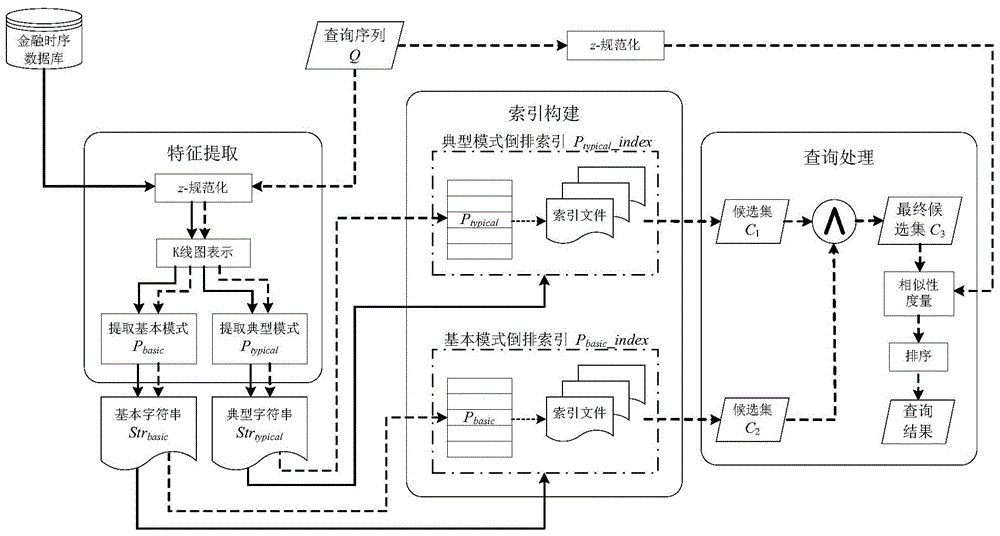
[0033] Such as figure 1As shown, the present invention is based on the financial time series similarity query method represented by the K-line diagram, comprising the following steps:

[0034] (1) feature extraction, specifically including the following sub-steps:

[0035] (1.1) Read each time series T={t in the financial time series database sequentially 1 ,t 2 ,...,t i ,...,t n};

[0036] (1.2) Calculate the average value m and standard deviation σ of all sampling points in the time series T, and perform z-normalization processing on T according to the formula (1), and obtain the normalized time series T'={t' 1 ,t' 2 ,...,t' i ,...,t' n};

[0037] t ′ i = t i - m σ ...


PUM


Abstract

The invention discloses a financial time series similarity query method based on K-chart expression. The method comprises the following steps of feature extraction, index construction and query processing. The method comprises the following concrete steps of firstly, extracting basic mode and classic mode features for a financial time series based on K-chart expression, and respectively translating the basic mode and classic mode features into a basic string and a classic string; secondly, respectively constructing reverse indexes on the basic string and the classic string; for each query sequence, after the basic mode and classic mode features are extracted through the same way, respectively querying the two constructed reverse indexes to acquire two candidate sets, and then carrying out intersection operation to obtain a final candidate set; obtaining a final query result through follow-up processing. The financial time series similarity query method based on K-chart expression can effectively realize nearest neighbor query, has higher measurement precision and query efficiency, has favorable extensibility for time series length, nearest neighbor query scale and data set scale, and can play a significant role in the widened electronic finance trade market.

Description

technical field [0001] The invention relates to the fields of database, data mining, information retrieval and the like, and in particular relates to analysis and mining of financial time series data. Background technique [0002] Time series widely exist in people's daily life and industrial production, such as real-time transaction data of funds or stocks, daily sales data in the retail market, sensor monitoring data in the process industry, astronomical observation data, aerospace radar, satellite monitoring data, real-time Weather temperature and air quality index, etc. [0003] Time series similarity query, also known as time series sample retrieval, has a wide range of application requirements in industry and finance. For example, in the real-time trading of the stock market, traders want to query the k historical sequences most similar to the current stock trend form from the massive historical stock data as a reference to obtain valuable knowledge and inspiration. ...

Claims


Application Information

Patent Timeline
Patent Type & Authority Applications(China)
IPC IPC(8): G06F17/30
CPCG06F16/901
Inventor 蔡青林陈岭孙建伶陈蕾英
Owner ZHEJIANG UNIV
Why Eureka
Try Eureka