
Three-dimensional visualization method and system for real-time meteorological networking radar data

A technology for networked radar and real-time weather, applied in image data processing, 3D modeling, instruments, etc., can solve the problems of integration of networked radar echo information and unsatisfactory data processing speed of larger-scale networked radars. Achieve the effect of improving efficiency and reducing data scale

Active Publication Date: 2016-06-15
华云信息技术工程有限公司
View PDF3 Cites 18 Cited by
  • Summary
  • Abstract
  • Description
  • Claims
  • Application Information

AI Technical Summary

Problems solved by technology

[0005] (2) At present, most of the data processing and 3D visualization research on meteorological radar data do not integrate the radar echo information of the network, and then perform 3D visualization of it from the overall spatial distribution, but use volume rendering (ray projection Algorithm) or Surface Rendering (Moving Cube Algorithm MC) algorithm to draw grid point data converted from weather radar data echo intensity information
Zhang Zhiqiang, Liu Liping, Wang Hongyan, 2010); Meng Zhaolin (Construction of geospatial 3D cloud technology based on weather radar detection data) Constructing isosurfaces from single-station weather radar data (moving cube algorithm MC) and volume rendering to explore 3D cloud technology , the processing speed of these two algorithms for larger-scale networked radar data is not satisfactory

Method used


Image

  • Three-dimensional visualization method and system for real-time meteorological networking radar data
  • Three-dimensional visualization method and system for real-time meteorological networking radar data

Examples


Embodiment 1

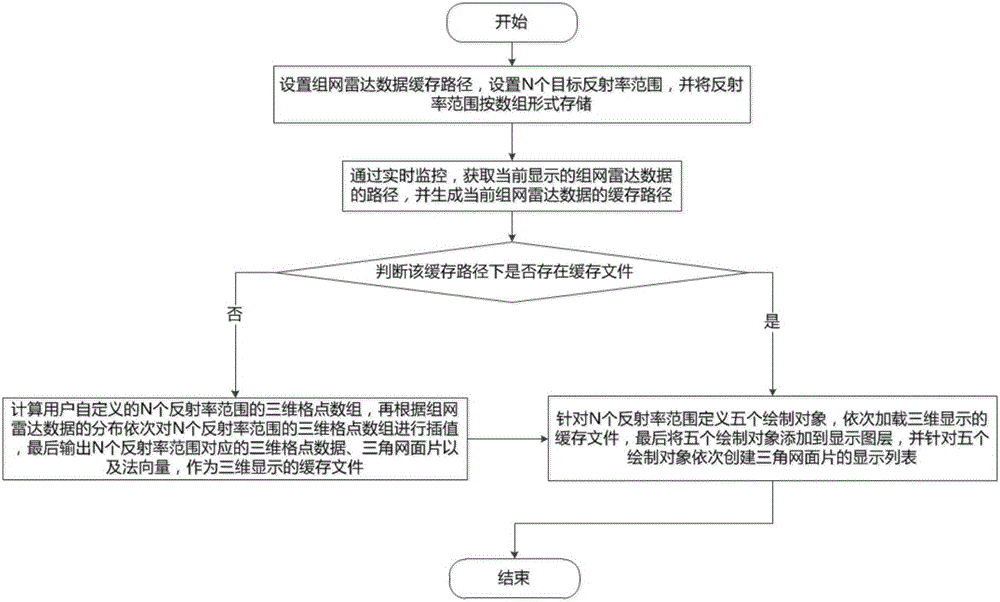
[0082] Embodiment 1, real-time monitoring networking radar data, comprises the following steps:

[0083] 1. Set the path of the networked radar data, which is the path generated in real time by the networked radar data, for example: ..\RADA\mosaic; the purpose of setting the cache path is to only process the data once; set the user-defined reflectivity Range, take N equal to 5, the range of reflectivity is [20,25], [30,35], [40,45], [45,50], [50,55];

[0084] 2. The path of network radar data monitoring generates network data in real time. For example, the network radar data generated each time is composed of 18 files, which respectively represent 18-layer data. The naming of network data includes the generation time and layer number. For example: ..\RADA\mosaic\X8006\LONLAT\201511\11\MOC_X8006_20151111000000_MCAP_00.bin, only after the 18 data arrives, the subsequent processing can be carried out;

[0085] 3. Read the networked radar data, obtain the reflectivity of each layer...

Embodiment 2

[0087] Example 2: View historical networking radar data

[0088] 1. Set the path of the networked radar data, which is the path generated in real time by the networked radar data, for example: ..\RADA\mosaic; the purpose of setting the cache path is to only process the data once; set the user-defined reflectivity Range, for example, the range of reflectance is [20,25], [30,35], [40,45], [45,50], [50,55];

[0089] 2. By specifying a certain moment in history, find out whether there is cached data corresponding to the corresponding range at the time, if not, obtain the time data source according to the path and time of the networking radar data, and then enter step 3 and subsequent processes in Embodiment 1; If it exists, follow step 4 in Example 1.


PUM


Abstract

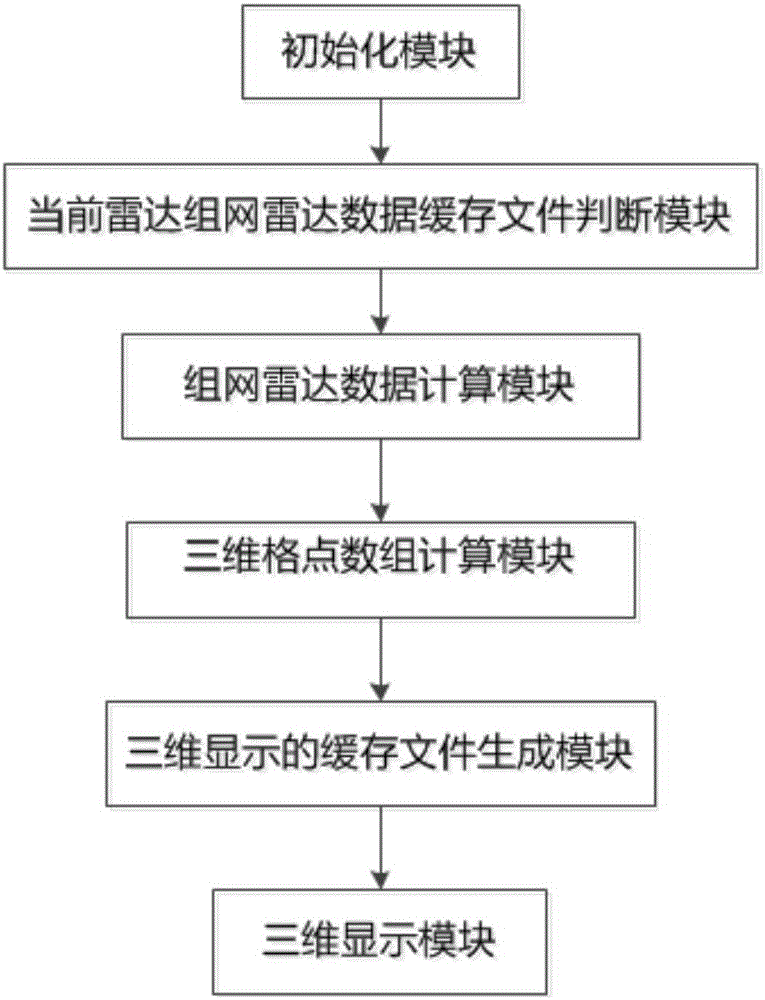
The invention relates to a three-dimensional visualization method for real-time meteorological networking radar data, and the method comprises the steps: initial setting, data processing and displaying. A data source employed by the method is networking radar data, and the method achieves the larger-range real-time monitoring of the development and change of radar reflectivity. Moreover, the method carries out targeted visualized monitoring according to the customized reflectivity range of a user. In addition, through the dividing and integration of the networking radar reflectivity, the method reduces the data size, and greatly improves the data process and three-dimensional plotting efficiency. The invention does not employ a conventional volume rendering and surface rendering algorithm for data processing, directly obtains the target processing data source according to the customized reflectivity range of the user, then carries out interpolation and triangularization according to the distribution of networking radar data, and forms the current form of the networking radar data quickly and visually.

Description

technical field [0001] The invention relates to the field of radar data processing, in particular to a three-dimensional visualization method and system for real-time meteorological networking radar data. Background technique [0002] Meteorological radar data is the basic data source in the new generation of weather radar business. The networked radar data is composed of multiple single-station radar volume scan data. It has the characteristics of large data scale and can be comprehensive, multi-scale and large-scale Expresses upper-altitude atmospheric changes. The present invention preprocesses the real-time monitoring networked radar data, establishes the spatial distribution relationship of combined reflectivity, and then performs three-dimensional visual expression on it, aiming to provide a more intuitive visualization method for small and medium-scale short-term weather forecasts, Thus comprehensively and integrally reflecting the evolution and development of the ra...

Claims


Application Information

Patent Timeline
IPC IPC(8): G06T17/30
CPCG06T17/30G06T2207/30192
Inventor 龚杰冯晶谢道奇王勇华赵前军白林强彭姗姗
Owner 华云信息技术工程有限公司
Learn More