Method for determining hydrocracking tail oil property by near-infrared spectroscopy
A technology of hydrocracking tail oil and near-infrared spectroscopy, which is applied in the field of near-infrared spectroscopy analysis, can solve problems such as lag, long conventional analysis time, and large fluctuations in properties of hydrocracking tail oil, and achieve the effect of easy maintenance
- Summary
- Abstract
- Description
- Claims
- Application Information
AI Technical Summary
Problems solved by technology
Method used
Image
Examples
example 1
[0042] (1) Establish library sample near-infrared spectrum matrix and database
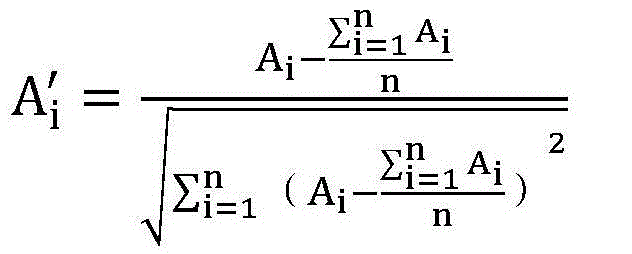
[0043] 150 hydrocracking tail oil samples were taken, and the composition of each sample was determined by GC-MS method, including normal paraffins, isoparaffins, aromatics and naphthenes. Then measure its near-infrared spectrum, perform first-order differential processing on the near-infrared spectrum, and then carry out vector normalization processing according to formula ⑤.
[0044] Take 5500cm -1 ~6500cm -1 The absorbance of the above-mentioned first-order differential processing and vector normalization processing in the interval constitutes the near-infrared spectrum matrix of the hydrocracking tail oil storage sample, and the spectral data in the near-infrared spectral matrix is related to the corresponding sample properties, and the near-infrared spectral database of the storage sample is established .
[0045] (2) Predict the properties of the samples to be tested
[0046] Perform p...
example 2
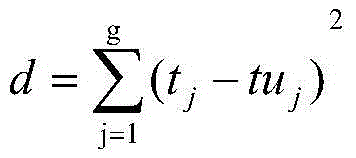
[0053] Take 6 hydrocracking tail oil samples to be tested, measure their near-infrared spectra according to the method in Example 1, calculate the Euclidean distance from the spectral data and the scores of the library samples, and then predict the properties of the 6 nearest library samples The properties of the sample to be tested, the comparison between the predicted n-alkane and isoparaffin content and the measured value obtained by the GC-MS standard method (SH / T 0606-2005) is shown in Table 3, and the predicted naphthene and aromatic content are compared with those obtained by using The comparison of the measured values obtained by the GC-MS standard method is shown in Table 4. The comparison between the predicted density and the measured value obtained by the standard density (SH / T0604-2000) measurement method is shown in Table 5.
[0054] table 3
[0055]
[0056] Table 4
[0057]
[0058] table 5
[0059]
PUM
 Abstract
Description
Claims
Application Information
 - R&D
- Intellectual Property
- Life Sciences
- Materials
- Tech Scout
- Unparalleled Data Quality
- Higher Quality Content
- 60% Fewer Hallucinations
Browse by: Latest US Patents, China's latest patents, Technical Efficacy Thesaurus, Application Domain, Technology Topic, Popular Technical Reports.
© 2025 PatSnap. All rights reserved.Legal|Privacy policy|Modern Slavery Act Transparency Statement|Sitemap|About US| Contact US: help@patsnap.com


