Automatic selecting method for well testing data interpretation of oil-water well

An automatic selection, oil-water well technology, applied in the direction of wellbore/well components, earthwork drilling, measurement, etc., can solve the problems of multiple solutions and low accuracy of parameters, so as to improve the accuracy of parameters and solve the problem of multiple solutions of parameters Effect

Active Publication Date: 2016-12-07
BC P INC CHINA NAT PETROLEUM CORP +1
View PDF7 Cites 6 Cited by
  • Summary
  • Abstract
  • Description
  • Claims
  • Application Information

AI Technical Summary

Problems solved by technology

[0004] The technical problem to be solved by the present invention is to provide an automatic selection method for the interpretation of oil and water well test data, and to solve the problems of multiple solutions and low accuracy of parameters that only use modern well test analysis methods

Method used


Image

  • Automatic selecting method for well testing data interpretation of oil-water well
  • Automatic selecting method for well testing data interpretation of oil-water well
  • Automatic selecting method for well testing data interpretation of oil-water well

Examples


Embodiment 1

[0017] The perforated section of Well Nanpu 1-3 is 2745.6-2802.6m, with a thickness of 38.2m, which is interpreted as oil and water in the same layer by logging. On December 19, 2005, oil testing was carried out by using tubing conveyed negative pressure perforation + formation testing + hydraulic pump drainage (production) for oil testing. The well was opened for 66 minutes once, the well was shut down for recovery for 1781 minutes, and the well was opened for the second time. Drainage 60h.

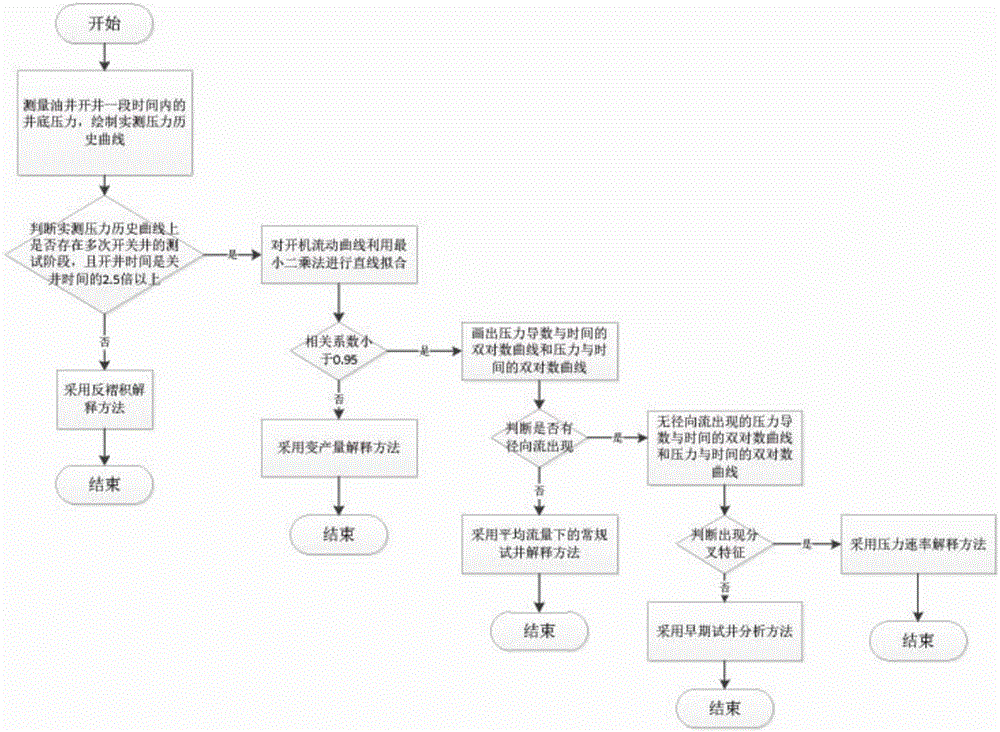
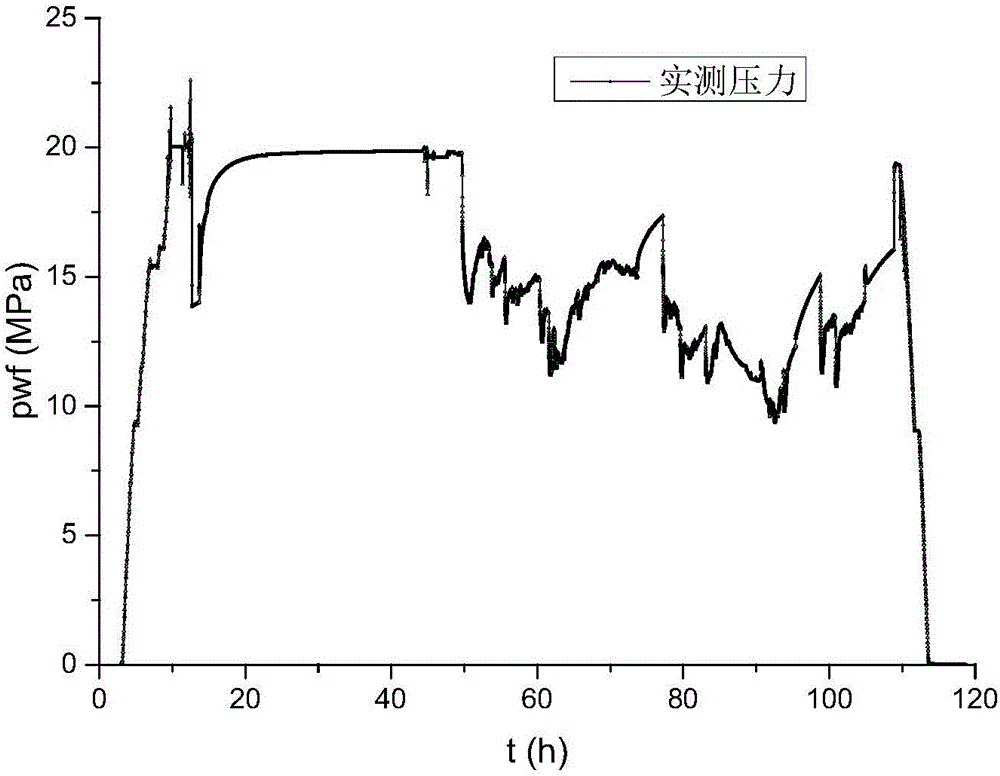
[0018] Step 1: Measure the bottomhole pressure value within the recovery time (1781min) of the shut-in pressure after the oil well has been in production for a period of time (66min), obtain the relationship between the bottomhole pressure and time, and draw the measured pressure history curve, see figure 2 .

[0019] Step 2: Judging whether there are multiple test phases of opening and closing wells on the measured pressure history curve, and the well opening time is more than 2.5 tim...

Embodiment 2

[0023] The test interval of C2-1 layer in well Jian12-54x is 2024.80-2026.80m, with a thickness of 2m, and the logging interpretation is that oil and water are in the same layer. From March 9th to March 19th, 2013, MFE was used as the test process. The test process included one opening, one closing, and two swabbing. One time the well was opened for 90 minutes, and the well was shut down for 1497 minutes.

[0024] Step 1: Measure the bottomhole pressure value within the recovery time (1497min) of the shut-in pressure after the oil well has been in production for a period of time (90min), obtain the relationship between the bottomhole pressure and time, and draw the measured pressure history curve, see Figure 5 .

[0025] Step 2: Judging whether there are multiple test phases of opening and closing wells on the measured pressure history curve, and the well opening time is more than 2.5 times the well closing time. Depend on Figure 5 It can be seen from the test process that...


PUM


Abstract

The invention discloses an automatic selecting method for well testing data interpretation of an oil-water well. The automatic selecting method comprises the following five steps that firstly, a measured pressure historical curve is measured; secondly, whether multiple times of on-off well testing stages exist or not and the well on time is 2.5 times or above the well off time or not are judged, if yes, a deconvolution method is adopted, and if not, the third step is carried out; thirdly, a well on flowing curve is subjected to straight line fitting, the fourth step is carried out if a correlation coefficient is larger than 0.95, and otherwise, a variable yield method is selected; fourthly, a double logarithmic curve is drawn, a conventional method is selected if radial flow appears, and the fifth step is carried out if no radial flow appears; fifthly, when no radial flow appears on the double logarithmic curve, an early-stage well testing analyzing method is adopted if a fork feature appears, and a pressure speed interpretation method is adopted if no fork feature appears. A powerful guarantee is provided for solving the parameter multi-solution problem and improving parameter precision.

Description

technical field [0001] The invention relates to a method for interpreting oil-water well test data, in particular to an automatic selection method for oil-water well test data interpretation. Background technique [0002] The well testing technology of oil and gas wells is an important means for understanding oil and gas reservoirs, evaluating oil and gas reservoirs, monitoring production dynamics and evaluating completion effects. Well test analysis obtains formation dynamic and static parameters by analyzing bottom hole pressure changes, such as formation permeability, skin coefficient, wellbore storage coefficient, pressure boundary, formation pressure, etc., to provide scientific basis for the formulation and adjustment of oil and gas field development plans. [0003] At present, the main means of well test interpretation is the modern well test analysis method using well test curve fitting. The modern well test analysis method is used to interpret the well test data. F...

Claims


Application Information

Patent Timeline
Patent Type & Authority Applications(China)
IPC IPC(8): E21B49/00E21B47/00
CPCE21B47/00E21B49/00
Inventor 李琳琳韩斌刘述忍史原鹏李拥军吴刚程小东卢昊冯广业朱宝峰杨先辉李洪俊徐凤兰赵刚方正
Owner BC P INC CHINA NAT PETROLEUM CORP
Why Eureka
Try Eureka