Visual bus big data analysis system

A data analysis system and public transportation technology, applied in structured data retrieval, relational database, database model, etc., can solve problems such as poor system data quality, inaccurate visualization of public transportation data, and imperfect visualization system

Inactive Publication Date: 2017-06-13
BEIJING YAXIN LANTAO TECH CO LTD
View PDF8 Cites 28 Cited by
  • Summary
  • Abstract
  • Description
  • Claims
  • Application Information

AI Technical Summary

Problems solved by technology

[0003] However, due to the lack of an accurate and visualized data analysis system in the bus passenger transport system, the data quality of the existing system is poor
For example, problems such as inaccurate bus arrival time, too many people in the bus during peak hours, repeated bus line settings, and unreasonable bus stop settings often occur
However, when these problems occur, the current bus passenger transport system cannot detect and feedback the problems in a timely manner, which will miss the best time and way to solve traffic problems, which will easily lead to the failure of the passenger transport system to operate normally and even lead to traffic paralysis in the entire city
[0004] The traditional methods of obtaining bus travel data usually rely on on-the-spot investigations. However, in today's era of big data, urban traffic big data intelligent application systems have emerged. The analysis system cannot solve the problems of bus congestion, route adjustment and unreasonable station setting
At the same time, there are hundreds or thousands of bus stops in a city, and an effective bus visualization analysis system is also a problem that cannot be ignored, but the current imperfect visualization system cannot meet the needs
[0005] Aiming at various drawbacks caused by inaccurate public transport data and poor visualization effect, the present invention proposes a visualized public transport big data analysis system

Method used


Image

  • Visual bus big data analysis system
  • Visual bus big data analysis system
  • Visual bus big data analysis system

Examples


Embodiment Construction

[0028] The features of the present invention and other related features will be further described in detail below in conjunction with the accompanying drawings.

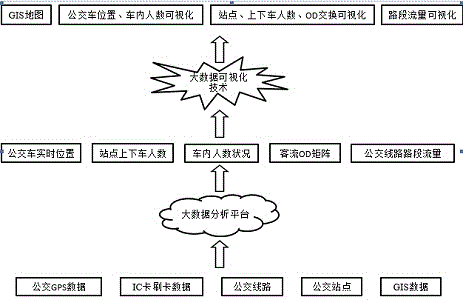
[0029] Such as figure 1 As shown, the present invention provides a visual public transport big data analysis system. The public transport big data adopted mainly includes vehicle GPS data, IC card swiping data, bus route and station data, and the results of analysis and visualization include bus real-time position, The number of people getting on and off at the station, the number of people in the car, the OD matrix of passenger flow and the traffic flow of bus lines. It mainly includes the following steps: 1) Extraction of bus big data, which includes vehicle GPS data, IC card swiping data, bus line and station data; 2) Determination of bus movement trajectory, using bus line, bus station and GPS data , depicting the movement state of the bus; 3) Public transport system data analysis, including the number of people...


PUM


Abstract

The invention discloses a visual bus big data analysis system and belongs to the field of traffic big data application. The visual bus big data analysis system is characterized in that vehicle GPS data and IC card swiping data collected by bus GPS devices and card swiping devices and data related to bus lines and bus stops are transmitted to a big data analysis platform in real time, technologies such as cloud computing, big data analysis, internet and visualization are fully utilized to visualize real-time bus positions and in-bus passenger number states, and the system sends out warning information if buses deviate in position or passenger numbers in the buses exceed a specific threshold value; the numbers of passengers who get on or off the buses at the bus stops, passenger flow OD matrixes among bus stops and bus line link traffic flows are displayed through visual interfaces according to a great number of data analysis results. The visual bus big data analysis system is capable of showing real-time bus operation states and passenger flow states among the bus stops and of every bus line precisely.

Description

technical field [0001] The invention relates to a public transportation data analysis and visualization method, in particular to a visualized public transportation big data analysis system, which belongs to the application field of traffic big data. Background technique [0002] Bus passenger transport is an indispensable and important part of a city. With the continuous development of the city and the continuous increase of floating population, bus passenger transport serves the public, and the role of intensification is becoming more and more obvious. As the window of a city, public transport is taking on more and more heavy tasks, and the improvement of the public transport passenger transport system is imminent. Especially for big cities, the planning of bus lines, bus stops and bus scheduling must be reasonable and effective. [0003] However, because the bus passenger transport system has not formed an accurate and visualized data analysis system, the data quality of ...

Claims


Application Information

Patent Timeline
Patent Type & Authority Applications(China)
IPC IPC(8): G06F17/30G06Q50/30
CPCG06F16/287G06Q50/30
Inventor 王天然沙云飞丁浣宋力方岩岩李晨放
Owner BEIJING YAXIN LANTAO TECH CO LTD
Why Eureka
Try Eureka