Power grid abnormality quick detection method based on random matrix spectral radius method

A random matrix and detection method technology, which is applied in the direction of detecting faults according to conductor types, complex mathematical operations, instruments, etc., can solve problems such as weak signals, achieve accurate resolution, improve the level of abnormal analysis and processing of power grids, and have high sensitivity

Inactive Publication Date: 2017-09-05
SHANGHAI MUNICIPAL ELECTRIC POWER CO +2
View PDF8 Cites 22 Cited by
  • Summary
  • Abstract
  • Description
  • Claims
  • Application Information

AI Technical Summary

Problems solved by technology

The real-time data collected by the PMU and the global monitoring can greatly promote the detection of grid fault anomalies in terms of time and sensitivity, but its current application in frequency anomaly monitoring is only focused on low-frequency load shedding control
On the other hand, many small anomalies that are difficult to distinguish by traditional det

Method used


Image

  • Power grid abnormality quick detection method based on random matrix spectral radius method
  • Power grid abnormality quick detection method based on random matrix spectral radius method
  • Power grid abnormality quick detection method based on random matrix spectral radius method

Examples


Embodiment

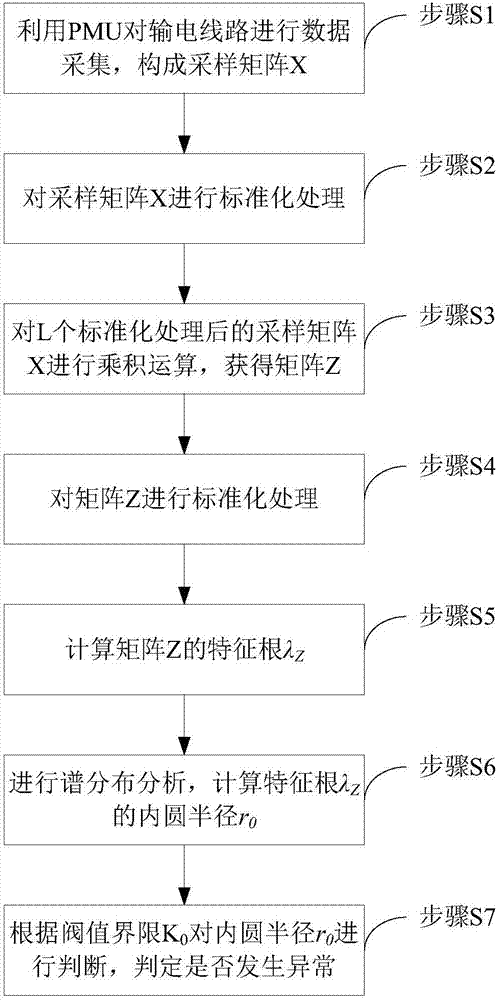
[0094] Example: Investigate the sampling data of 57 PMUs in a power grid in a certain place under the wide-area measurement system. The power grid is an independent low-voltage distribution network, and all PMUs are configured at the 110V voltage level. Through the selection of points in the early stage, the configuration ensures a considerable system. Under this system, PMU devices are installed in the low-voltage distribution network to complete the system frequency sampling.

[0095] On a certain day in March 2015, two frequency disturbances occurred in this power grid. Analyze the PMU sampling data of each frequency disturbance, and construct a large-dimensional matrix as follows:

[0096] 1. For each PMU node, take continuous 20-second frequency sampling data (T=200), then 57 PMU nodes form an original matrix of 57*200.

[0097] 2. Since the row-to-column ratio of the large-dimensional matrix should be between [0,1] and should not be too small, the data of 0-10 seconds o...

example 1

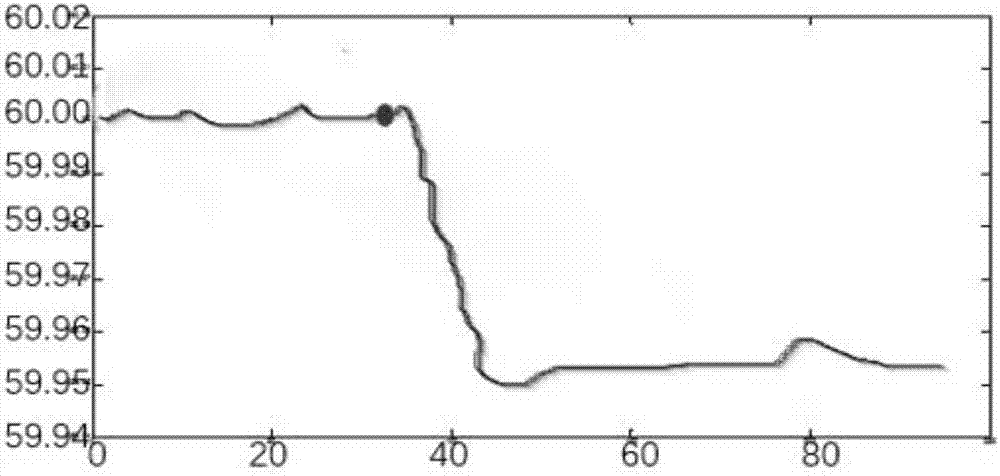
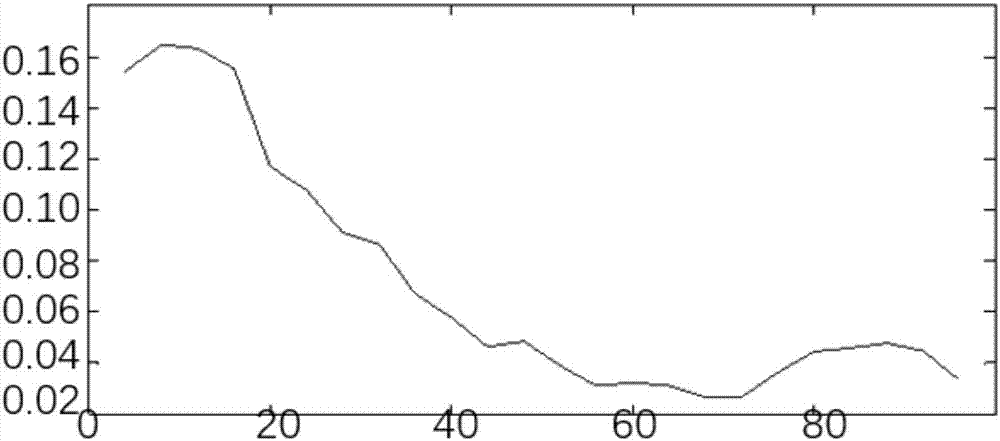
[0100] Example 1: Frequency first perturbation. figure 2 is the time-domain diagram of the first perturbation of the frequency, where the abscissa is the number of sampling points, the unit is unit, and the ordinate is the frequency, the unit is Hertz. The frequency mutation lasts for about 10 seconds, corresponding to about the 800th-900th point, and these 100 points are in figure 2 displayed in . image 3 is the change curve of the inner diameter of each sliding window ring, where the abscissa is the number of sampling points in unit, and the ordinate is the size of the inner diameter. It can be seen that the inner diameter drops sharply when the abnormality occurs, and continues to be at the lowest point at the abnormal moment. Figure 4 The characteristic root donut diagram of the spectral distribution under the selected sliding window shows the characteristic root distribution of each sliding window large-dimensional matrix before and after the anomaly and across the ...

example 2

[0101] Example 2: The frequency is perturbed for the second time. Similar to Example 1, Figure 5 is the time-domain diagram of the second perturbation of the frequency, where the abscissa is the number of sampling points, the unit is unit, and the ordinate is the frequency, the unit is Hertz. The frequency mutation lasts for about 10 seconds, corresponding to about the 800th-900th point, and these 100 points are in Figure 5 displayed in . Image 6 It is the change curve of the inner diameter of each sliding window ring. It can be seen that the inner diameter drops sharply from the beginning of the abnormality, and continues to be at the lowest point at the abnormal moment. Figure 7 is the characteristic root donut diagram of the spectral distribution under the selected sliding window, where the abscissa is the number of sampling points in unit, and the ordinate is the size of the inner diameter. In this example, Δf=59.98Hz-59.95Hz=0.03Hz, the sensitivity is increased by ...


PUM


Abstract

The invention discloses a power grid abnormality quick detection method based on a random matrix spectral radius method, and the detection method comprises the steps: carrying out the data collection of a power transmission line through a PMU, constructing sampling matrixes X, carrying out the standardization processing of the sampling matrixes X, carrying out the multiplying operation of L sampling matrixes X after standardization processing, obtaining a matrix Z, carrying out the standardization processing of the matrix Z, calculating the characteristic root of the matrix Z, carrying out the spectral distribution analysis, calculating the inner circle radius of the characteristic root, carrying out the judgment of the inner circle radius according to a threshold value boundary, and judging whether there is an abnormality or not. According to the invention, the method achieves the real-time quick global processing of data collected by the PMU, can accurately distinguish an abnormal weak signal, is high in sensitivity, enables the detection time to be remarkably ahead of the abnormality occurrence time, and can greatly improve the abnormality analysis and processing level of a power grid.

Description

technical field [0001] The invention relates to the technical field of grid anomaly detection, in particular to a fast grid anomaly detection method based on a random matrix spectral radius method. Background technique [0002] During the long-term operation of the power grid, it is inevitable that it will enter an abnormal state due to internal or external interference, making it difficult to ensure its safe and high-quality operation. Therefore, timely and fast detection of grid anomalies, and even judgments before grid anomalies occur, can buy sufficient time for subsequent grid feedback control, which is the development direction of grid anomaly detection. [0003] At present, the processing of power grid frequency anomalies is focused on the control after the anomaly, but there is a lack of relevant research on the detection and prediction of the anomaly itself. This processing method is based on individual detection. By modeling the components and loads of the power s...

Claims


Application Information

Patent Timeline
IPC IPC(8): G01R31/08G06F17/16G06Q50/06
CPCG01R31/086G06F17/16G06Q50/06Y02E40/70Y02E60/00Y04S10/00Y04S10/22
Inventor 陈洪涛刘亚东盛戈皞江秀臣杜洋
Owner SHANGHAI MUNICIPAL ELECTRIC POWER CO
Why Eureka
Try Eureka