Collaborative optimization method for test stimulation and test point based on response aliasing measurement

A test excitation and collaborative optimization technology, applied in special data processing applications, instruments, electrical digital data processing, etc., can solve the problems of blurred boundaries and low early fault detection, achieve high reliability, improve early fault detection rate, improve The effect of early simulation detection rate

Active Publication Date: 2017-09-05
HARBIN INST OF TECH
View PDF4 Cites 8 Cited by
  • Summary
  • Abstract
  • Description
  • Claims
  • Application Information

AI Technical Summary

Problems solved by technology

[0004] The purpose of the present invention is to solve the problem that in the existing analog circuit, due to the existence of device tolerance, the boundary between the fault state and the normal st...

Method used


Image

  • Collaborative optimization method for test stimulation and test point based on response aliasing measurement
  • Collaborative optimization method for test stimulation and test point based on response aliasing measurement
  • Collaborative optimization method for test stimulation and test point based on response aliasing measurement

Examples


specific Embodiment approach 1

[0027] Embodiment 1: A method for collaborative optimization of test incentives and measurement points based on response aliasing metrics includes the following steps:

[0028] Step 1: Step 1: Obtain the characteristic information of M times of normal operation of N measuring points of the circuit and M times of characteristic information of the fault state caused by the faulty component H in the full frequency band, that is, obtain M normal samples and M fault samples ;

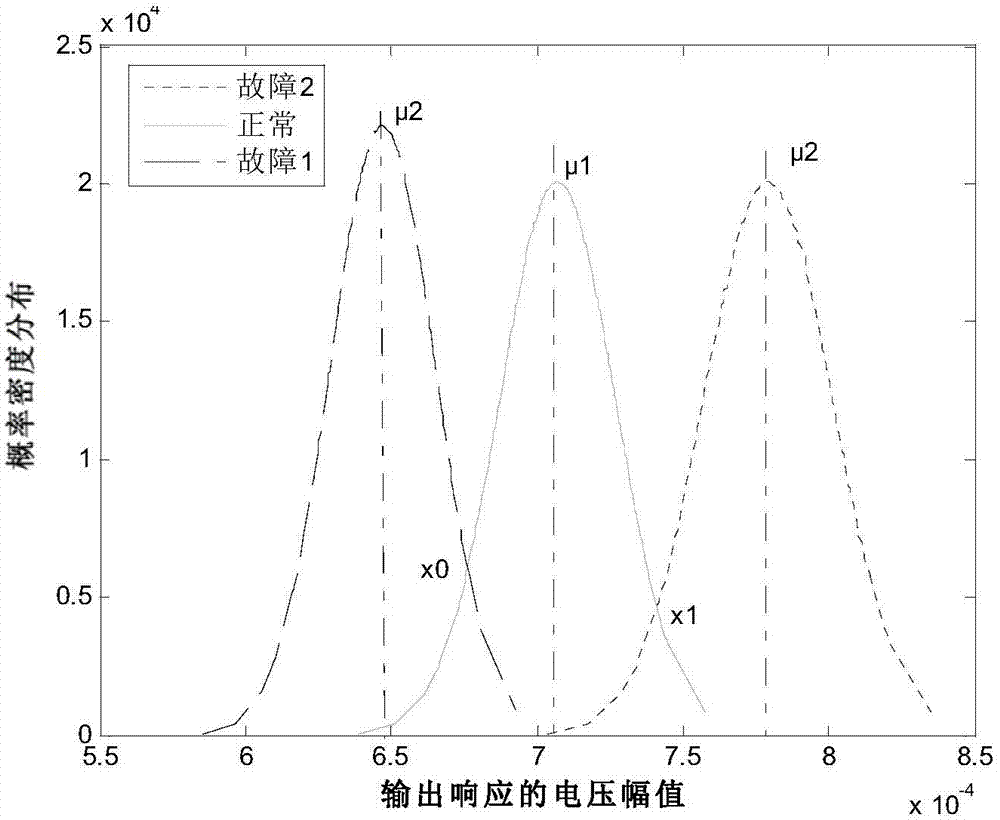
[0029] Step 2: Obtain the normal distribution curves corresponding to M normal samples and M fault samples in the full frequency band according to the characteristic information, and the mean value μ of the normal distribution curves of normal samples 2 and standard deviation σ 2 , the mean μ of the normal distribution curve of failure samples 1 and standard deviation σ 1 ;

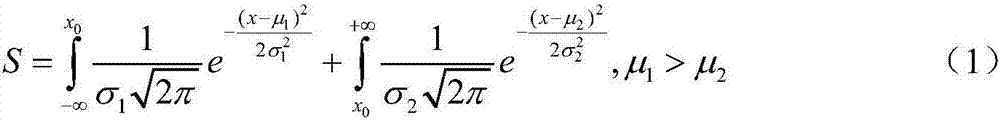
[0030] Step 3: Using the aliasing metric function to calculate the response aliasing between normal samples and fault samples in t...

specific Embodiment approach 2

[0032] Embodiment 2: The difference between this embodiment and Embodiment 1 is that the characteristic information in the step 1 is the voltage value of each measuring point.

[0033] Other steps and parameters are the same as those in Embodiment 1.

specific Embodiment approach 3

[0034] Specific embodiment three: the difference between this embodiment and specific embodiment one or two is that: in the step two, the normal distribution curves corresponding to M normal samples and M fault samples under the full frequency band are obtained according to the characteristic information, and the normal distribution curves corresponding to the normal The specific process of the mean and standard deviation of the state distribution is:

[0035] According to the voltage values ​​of M normal samples and M fault samples, the normal distribution curve corresponding to M normal samples and M fault samples is obtained by using the normfit function (normal distribution curve fitting function) in the Matlab mathematical toolbox. The abscissa of the obtained normal distribution curve is the voltage value of the sample, and the ordinate is the probability density distribution of the sample voltage value. According to the normal distribution curves corresponding to M norm...


PUM


Abstract

The invention discloses a collaborative optimization method for test stimulation and test points based on response aliasing measurement, and aims to solve the problems that device fault states and normal states have fuzzy boundaries and the early-stage fault detection rate is relatively low because of existence of device tolerance of a conventional simulation circuit. The method comprises the following steps: I, acquiring characteristic information of N testing points of a circuit in M times of normal operation and M times of fault states of a fault element H within a whole frequency band range, namely acquiring M normal samples and M fault samples; II, acquiring normal distribution curves of the M normal samples and the M fault samples, and a mean value and a standard difference of normal distribution in the whole frequency band; III, calculating response aliasing properties of the normal samples and the fault samples of the whole frequency band; and IV, selecting test stimulation and test points which enable a response aliasing measurement function to meet a minimum value. The collaborative optimization method is applied to the field of circuit fault detection.

Description

technical field [0001] The invention relates to a collaborative optimization method of test excitation and measurement point based on response aliasing measurement. Background technique [0002] With the development of national defense science and technology in our country, electronic systems are widely used in missile control, communication, target detection, identification of friend or foe and other fields. Sex determines the performance of weapons and equipment. For the board-level electronic system in weapon equipment, one of the important factors affecting its reliability is the early failure caused by the parameter drift of the key components in the circuit, and the key components mainly include two types: one is high-sensitivity components , that is, the parameter deviation of this type of device has a greater impact on the circuit output response; the second type is a high degradation rate component. Although this type of device has little impact on the circuit outp...

Claims


Application Information

Patent Timeline
IPC IPC(8): G06F19/00
CPCG16Z99/00
Inventor 俞洋姜月明王鹤潼李志盛
Owner HARBIN INST OF TECH
Why Eureka
Try Eureka