

Method and system for assessing fluid responsiveness using multimodal data
A liquid reaction, liquid technology, applied in the medical field, can solve problems such as low signal-to-noise ratio and inaccurate liquid reactivity
- Summary
- Abstract
- Description
- Claims
- Application Information
AI Technical Summary
Problems solved by technology
Method used
Image

Examples
Embodiment Construction
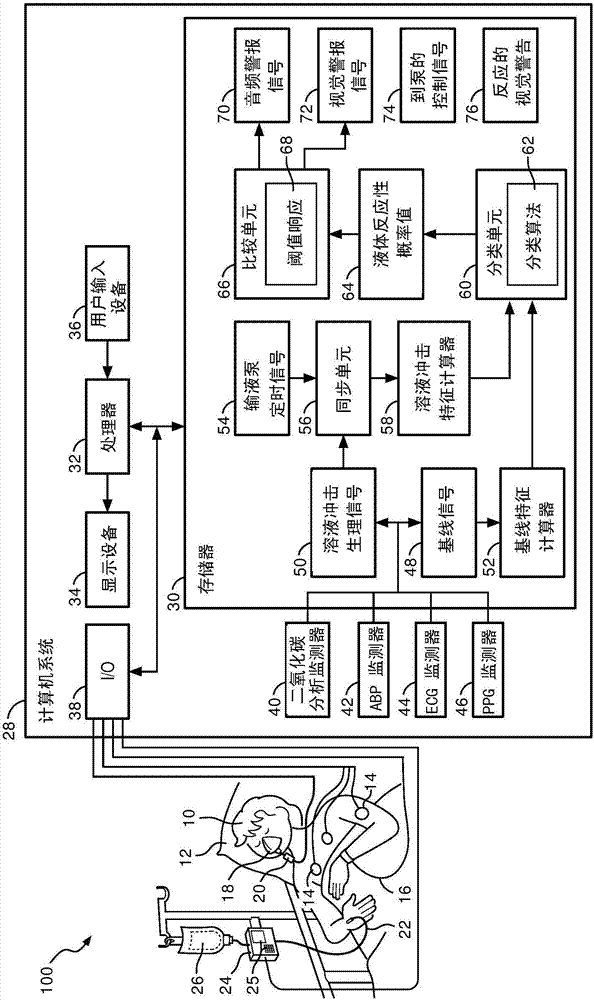
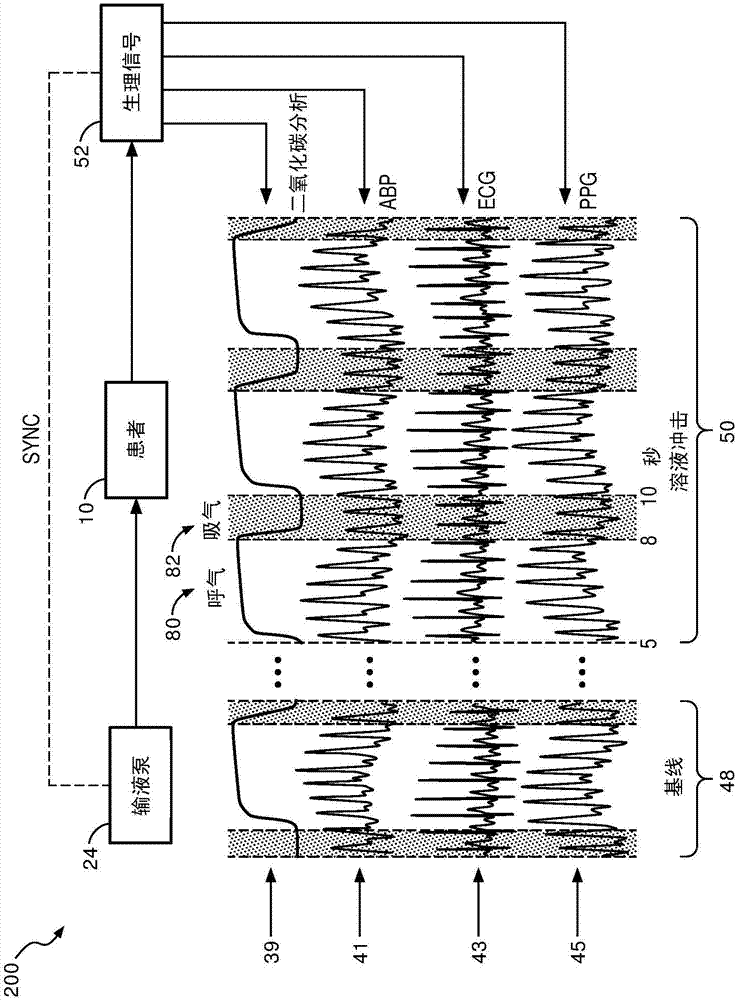
[0018] refer to figure 1 , depicts a fluid responsiveness assessment system 100 illustrating a patient 10 shown lying on a bed 12, such as is typical in a hospital, emergency room, intensive care unit (ICU), cardiac care unit (CCU), etc. situation. Depending on the patient's condition, it is also contemplated that the patient 10 may be ambulatory, in a wheelchair, in a chair, etc. FIG. The patient is monitored by a variety of medical monitoring equipment including, in the illustrated embodiment, an electrocardiogram (ECG) instrument with ECG electrodes 14, a blood pressure monitor 16 (which may be, for example, completely non-invasive), sphygmomanometer or minimally invasive arterial line), plethysmograph (PPG) 18 and capnography 20. The illustrated blood pressure monitor 16 is wrist-based; however, blood pressure monitors positioned on the upper arm or elsewhere on the patient 10 are also contemplated. If an arterial line is used to measure blood pressure, it may optionall...
PUM
 Abstract
Description
Claims
Application Information