Air pollution tracing and trend prediction method with visual big data

A technology for air pollution and forecasting methods, applied in the field of big data, can solve the problems of lack, high cost of construction and maintenance, labor costs, and the lag of government pollution monitoring and control.

Inactive Publication Date: 2017-11-10
河北百斛环保科技有限公司
View PDF2 Cites 17 Cited by
  • Summary
  • Abstract
  • Description
  • Claims
  • Application Information

AI Technical Summary

Problems solved by technology

[0008] The existing environmental monitoring station under the Ministry of Environmental Protection has the advantage of relatively accurate post-measurement, but the detection is mainly based on laboratory equipment, which is limited by the high cost of construction and maintenance, and the labor cost of regular sampling by special personnel. The number of official monitoring stations is relatively small. Fewer (average less than 10 per province at the end of 2015)
[0011] At present, the number of official monitoring stations is small, the density is low, and the degree of practicality and linkage informationization is low. The government's pollution monitoring and control is lagging and lacks predictability. Elaborate basis

Method used


Image

  • Air pollution tracing and trend prediction method with visual big data
  • Air pollution tracing and trend prediction method with visual big data
  • Air pollution tracing and trend prediction method with visual big data

Examples


Embodiment Construction

[0039] In order to make the content of the present invention clearer and easier to understand, the content of the present invention will be described in detail below in conjunction with specific embodiments and accompanying drawings.

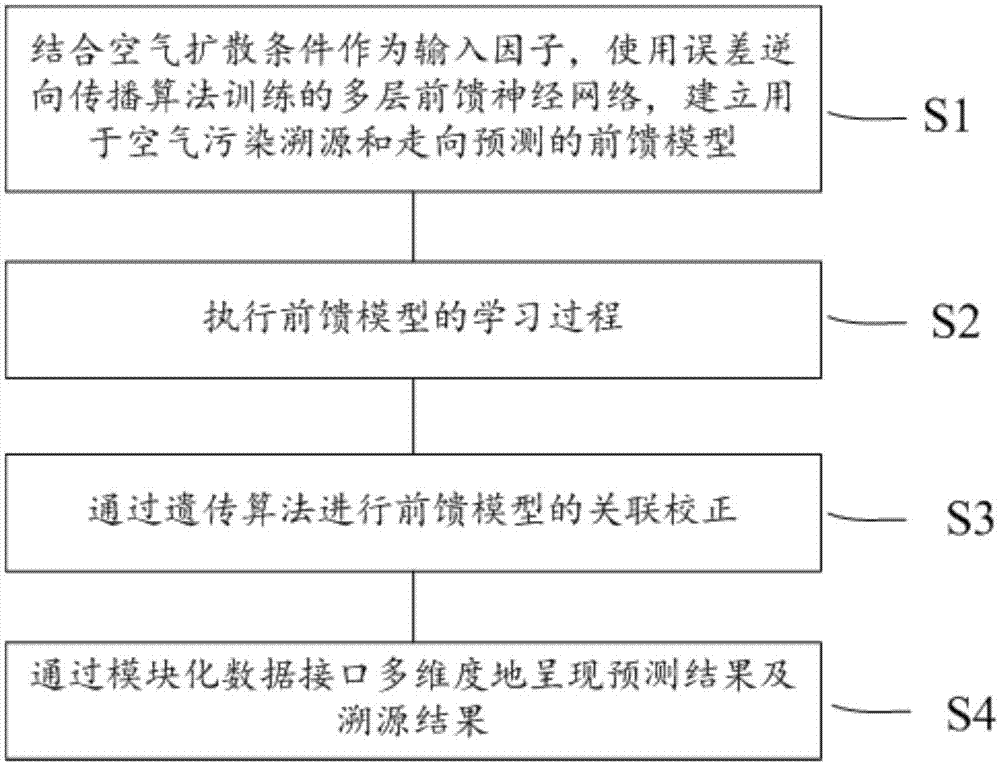
[0040] figure 1 It schematically shows a flow chart of a method for air pollution source tracing and direction prediction based on big data visualization according to a preferred embodiment of the present invention.

[0041] Such as figure 1 As shown, according to the preferred embodiment of the present invention, the air pollution traceability and direction prediction method of big data visualization include:

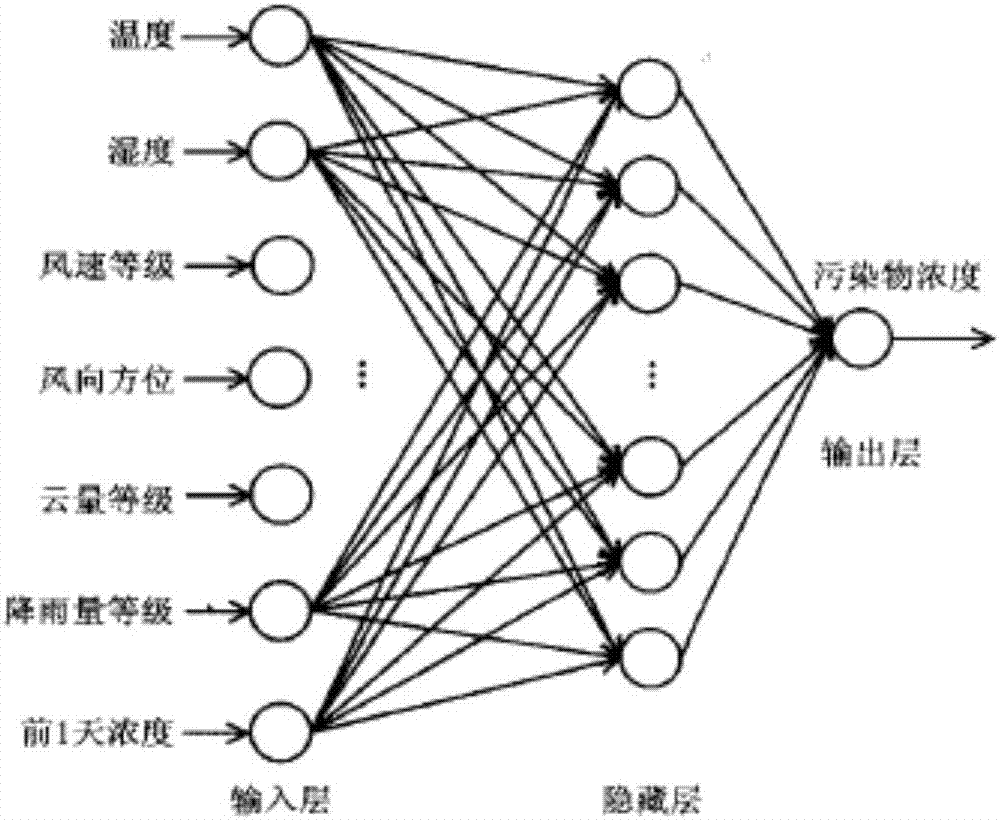
[0042] The first step S1: Combining air diffusion conditions as input factors, using the multi-layer feedforward neural network trained by the error backpropagation algorithm, to establish a feedforward model for air pollution source tracing and direction prediction;

[0043] For example, input factors include wind speed, wind force, w...


PUM


Abstract

The invention provides an air pollution tracing and trend prediction method with visual big data. The method comprises the following steps: using air diffusion conditions as input factors, and establishing a feedforward model for air pollution tracing and trend prediction by using a multilayer feedforward neural network trained by an error back propagation algorithm; and executing a learning process of the feedforward model, wherein historical air pollution data are used as the input training factors of the feedforward model, and gradually adjusting the weight and the threshold of the feedforward model of the network via the error back propagation by using the steepest descent method of an error performance function, so that the output errors of the feedforward model of the network are reduced continuously.

Description

technical field [0001] The present invention relates to the fields of big data, machine learning, computer simulation, environmental protection, and computer interactive systems. More specifically, the present invention relates to a big data visualization method for traceability and direction prediction of air pollution. Background technique [0002] In recent years, there have been many large-scale haze outbreaks in China. The physical components of the haze are mainly PM2.5, PM10, etc., and the chemical components are mainly carbon, sulfate, lead, arsenic, cadmium, copper, etc. For this kind of smog, the human respiratory system cannot effectively defend, which seriously endangers health. [0003] For the determination of pollutants, there are three methods in the industry: [0004] 1. Gravimetric method: the principle is to extract a quantitative volume of air at a constant speed, so that PM2.5 and PM10 in the ambient air are trapped on a filter membrane of known quality...

Claims


Application Information

Patent Timeline
Patent Type & Authority Applications(China)
IPC IPC(8): G06Q10/04G06N3/08
CPCG06N3/084G06Q10/04
Inventor 郑智民卢志勇
Owner 河北百斛环保科技有限公司
Why Eureka
Try Eureka