Low-cycle fatigue data analysis method based on matlab programming
A low-cycle fatigue and data analysis technology, used in electrical digital data processing, special data processing applications, instruments, etc., can solve the problem that the fitting curve value cannot be directly exported, the image cannot be edited twice, and the processing process variable value is not intuitive. and other problems, to achieve the effect of intuitive data processing results, convenient program debugging, and improved data processing efficiency
- Summary
- Abstract
- Description
- Claims
- Application Information
AI Technical Summary
Problems solved by technology
Method used
Image
Examples
specific Embodiment approach 1
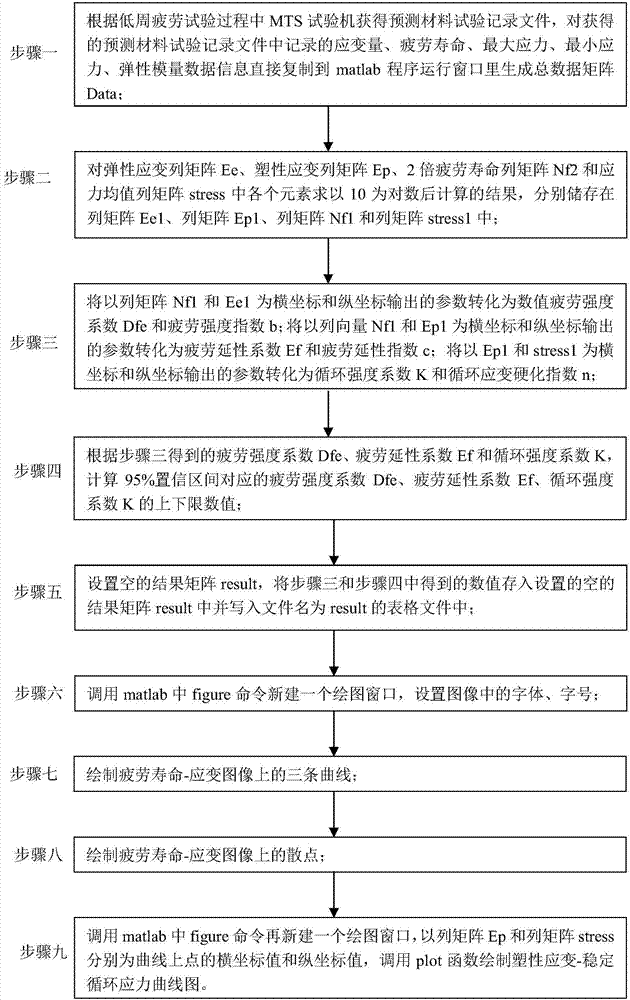
[0028] Specific implementation mode one: combine figure 1 Describe this embodiment, the specific process of a kind of low cycle fatigue data analysis method based on matlab programming of this embodiment is:
[0029] Step 1. Obtain the predicted material test record file according to the MTS testing machine during the low cycle fatigue test, and record the strain, fatigue life, maximum stress, minimum stress, and elastic modulus data information in the obtained predicted material test record file in this When the program is executed, it is directly copied to the matlab program running window to generate the total data matrix Data;
[0030] The total strain is the first column Et of the total data matrix Data; the fatigue life is the second column Nf of the total data matrix Data; the maximum stress is the third column max_stress of the total data matrix Data; the minimum stress is the fourth column of the total data matrix Data Column min_stress; the elastic modulus is the fi...
specific Embodiment approach 2
[0045] Specific embodiment two: the difference between this embodiment and specific embodiment one is: the column matrix Ee1 in the step 2 is the column matrix after seeking the logarithm with base 10 for each element in the elastic strain column matrix Ee; column matrix Ep1 is the column matrix after calculating the logarithm to the base 10 for each element in the plastic strain column matrix Ep; column matrix Nf1 is the column after calculating the logarithm to the base 10 for each element in the 2 times fatigue life column matrix Nf2 matrix; the column matrix stress1 is the column matrix obtained by calculating the logarithm to the base 10 for each element in the stress mean column matrix stress.
[0046] Other steps and parameters are the same as those in Embodiment 1.
specific Embodiment approach 3
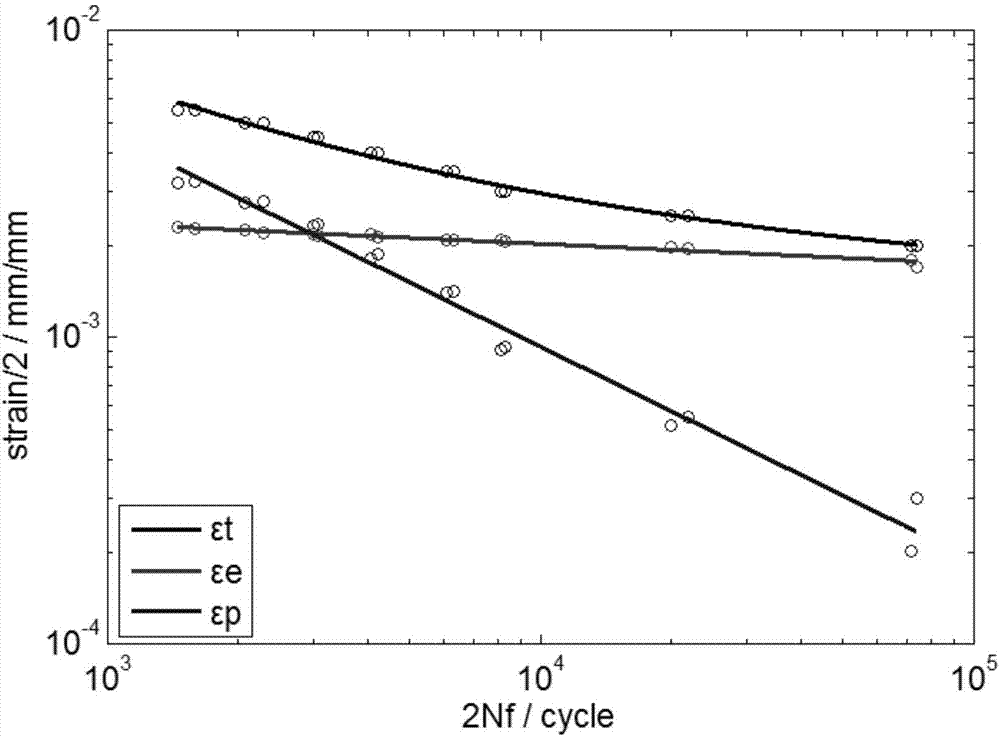
[0047] Specific embodiment three: the difference between this embodiment and specific embodiment one or two is: in the step seven, draw three curves on the fatigue life-strain image; the specific process is:
[0048] According to the maximum value and minimum value of the double fatigue life column matrix Nf2, respectively determine the abscissa value of each point on the three curves in the image, in which fatigue life-elastic strain curve, fatigue life-plastic strain curve, fatigue life-total strain curve The ordinate values of each point above are Dfe*(Nf2) b , Ef*(Nf2) c , Dfe*(Nf2) b +Ef*(Nf2) c ;Call the plot function to draw, and set the color, linearity, and line width of the curve;
[0049] Dfe is the fatigue strength coefficient, Ef is the fatigue ductility coefficient, Nf2 is the double fatigue life column matrix, b is the fatigue strength index, c is the fatigue ductility index, and * is the multiplication sign.
[0050] Other steps and parameters are the sam...
PUM
 Abstract
Description
Claims
Application Information
 - R&D
- Intellectual Property
- Life Sciences
- Materials
- Tech Scout
- Unparalleled Data Quality
- Higher Quality Content
- 60% Fewer Hallucinations
Browse by: Latest US Patents, China's latest patents, Technical Efficacy Thesaurus, Application Domain, Technology Topic, Popular Technical Reports.
© 2025 PatSnap. All rights reserved.Legal|Privacy policy|Modern Slavery Act Transparency Statement|Sitemap|About US| Contact US: help@patsnap.com


