Gaussian multi-peak fitting-based spectrum analysis algorithm

An analytical algorithm and hybrid spectrum technology, applied in the measurement of color/spectral characteristics, complex mathematical operations, etc., can solve the problems of inconvenient analysis and processing, large amount of data, etc., to achieve the effect of maintaining effective information, clear physical meaning, and simplifying the data matrix

Active Publication Date: 2017-12-12
YANTAI INST OF COASTAL ZONE RES CHINESE ACAD OF SCI
View PDF4 Cites 12 Cited by
  • Summary
  • Abstract
  • Description
  • Claims
  • Application Information

AI Technical Summary

Problems solved by technology

The actual spectral data collected is discrete point data, and the dat

Method used


Image

  • Gaussian multi-peak fitting-based spectrum analysis algorithm
  • Gaussian multi-peak fitting-based spectrum analysis algorithm
  • Gaussian multi-peak fitting-based spectrum analysis algorithm

Examples


Embodiment 1

[0029] Taking the fitting function as an example with only one Gaussian function and peak position b at 195 nm of chloride ion, the present invention will be further described.

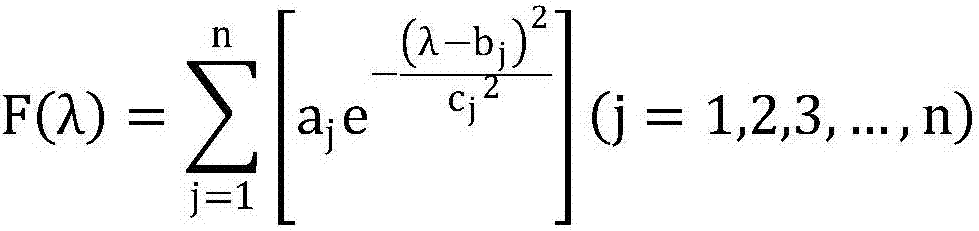
[0030] (1) Determine the absorption fitting function as:

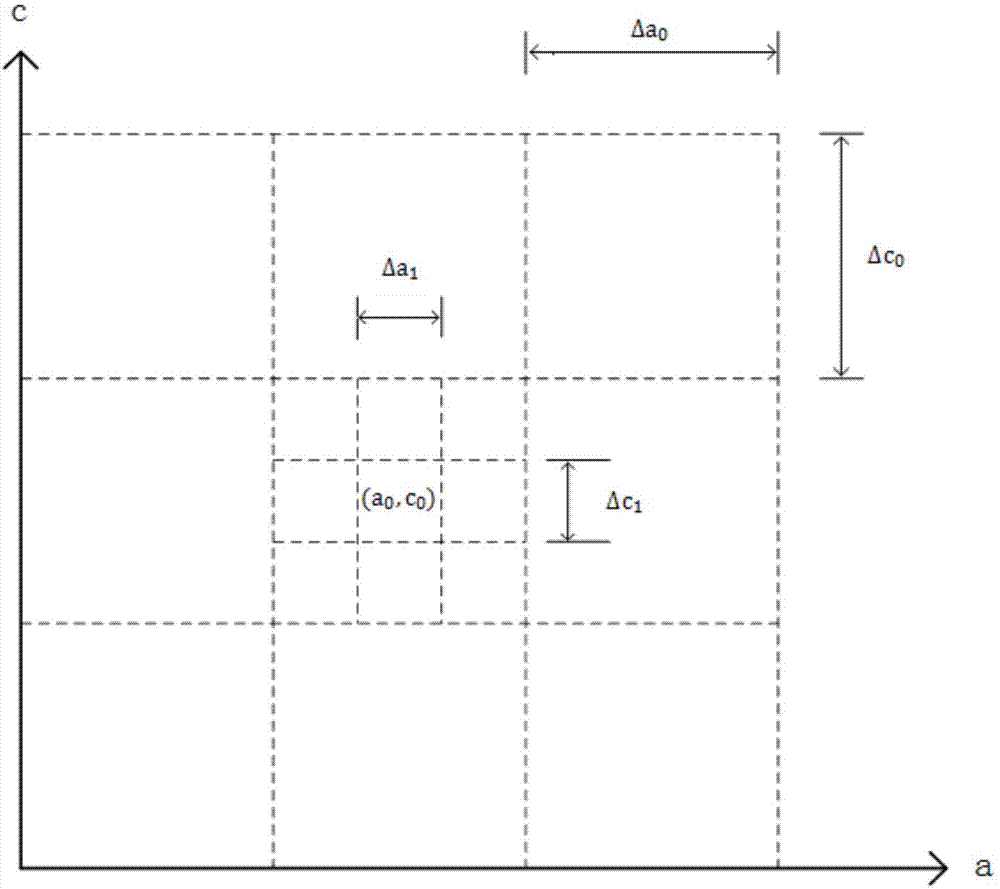
[0031] In the formula, λ is the wavelength in the spectral data. At this time, there are only two fitting parameters a and c; the two fitting parameters correspond to the two-dimensional space, w=2, and a corresponds to the horizontal axis in the two-dimensional coordinate system , c corresponds to the vertical axis, such as figure 1 shown;

[0032] (2) Mathematical modeling of fitting error:

[0033]

[0034] In the formula, Q is the fitting error, y i Indicates the ordinate value of the spectral data point, is the fitting function value;

[0035] (3) Set the iteration initial value to (a 0 ,c 0 ), and the iteration step size is Δa 0 ,Δc 0 ;

[0036] (4) Divide this two-dimensional space; with the current iteration step size Δ...

Embodiment 2

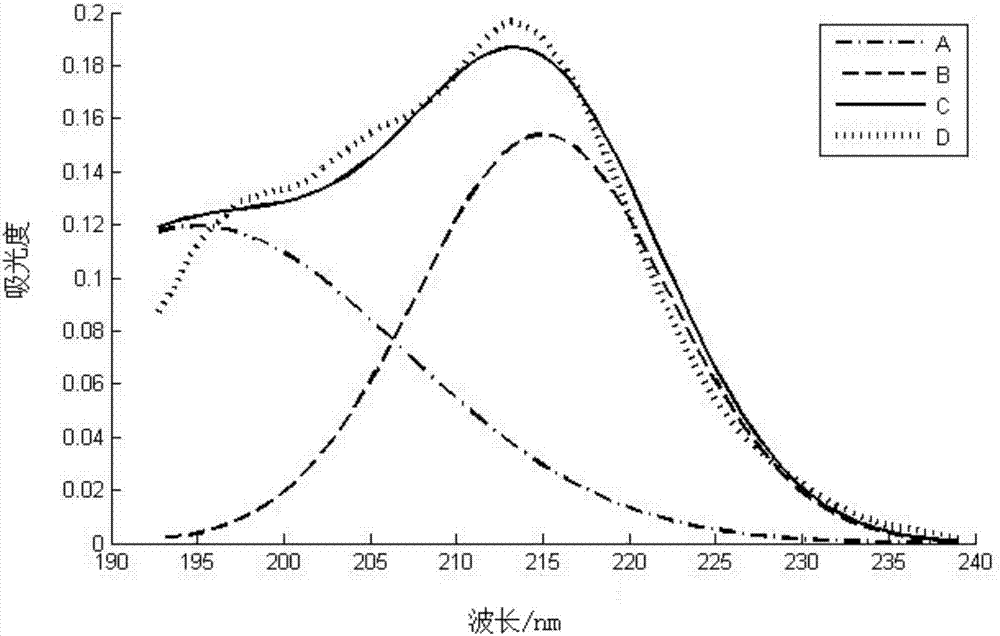
[0043] Chloride ions and bromide ions are high in seawater and are representative. Now take the spectral analysis of seawater chloride ions and bromide ions as an example. The known peak position b 1 and b 2 Respectively corresponding to the absorption peak positions 195nm and 215nm of chlorine ion and bromide ion, the present invention is further described, and the seawater quality absorption spectrum fitting algorithm comprises the following steps:

[0044] (1) Export and intercept the seawater quality spectral data to be fitted, such as figure 2 Middle spectral data D curve. Seawater quality spectral data contains mixed spectra of chloride ions and bromide ions.

[0045] (2) Determine the absorption fitting function

[0046] Two Gaussian peaks are required for the spectral measurement of chloride ion and bromide ion, then the absorption fitting function is:

[0047]

[0048] (3) Peak position b 1 , b 2 After determining according to the actual physical meaning, only...


PUM


Abstract

The invention discloses a Gaussian multi-peak fitting-based spectrum analysis algorithm. The Gaussian multi-peak fitting-based spectrum analysis algorithm comprises the following steps: determining an absorption fitting function containing an undetermined Gaussian feature parameter, performing mathematical modeling on fitting error, determining center coordinate and iteration step of an iteration initial value, continuously performing iteration, performing comparison and changing the iteration step length until the optimal fitting error is obtained, and reversely deducing the center coordinate value, namely the to-be-determined feature parameter, of the corresponding division unit by the optimal fitting error, and determining the absorption fitting function so as to decompose the mixed spectrum into a plurality of sub-peaks. The Gaussian multi-peak fitting-based spectrum analysis algorithm has the following advantages: a Gaussian function curve and a spectroscopic data curve have high affinity and can express parameters, such as peak shape, peak height and peak position in the spectrogram, with clear physical significance; and the mixed absorption spectrum curve is decomposed into a plurality of Gaussian function curves, the effective information of the original spectrum data can be remained, the original spectrum data is unified into a small amount of uniquely determined Gaussian feature parameters, and the aims of simplifying the spectrum data and researching the refined structure are fulfilled.

Description

technical field [0001] The invention relates to the field of multivariate nonlinear curve fitting, in particular to a spectrum analysis algorithm based on Gaussian multi-peak fitting, which can be applied to the Gaussian multi-peak fitting analysis of sea water quality absorption spectrum. Background technique [0002] With the continuous development of human society, the continuous progress of scientific research; our research on the ocean is also deepening. In the process of marine research, the research and detection of seawater components are very important. [0003] Spectroscopic water quality measurement has the advantages of fast speed, high precision, time-saving and high efficiency, etc., but a large amount of spectral data will be generated during the measurement process. In the process of seawater quality absorption spectrum analysis, the spectral data curve must be processed. The actual collected spectral data is discrete point data, and the data volume is very ...

Claims


Application Information

Patent Timeline
IPC IPC(8): G01N21/31G06F17/17
Inventor 冯巍巍王焕卿
Owner YANTAI INST OF COASTAL ZONE RES CHINESE ACAD OF SCI
Why Eureka
Try Eureka