Frequency chosen of singular-spectrum analysis-based magnetic resonance sounding signal extraction method
A technology of signal extraction and frequency selection, which is applied in magnetic resonance measurement, measurement using nuclear magnetic resonance image system, measurement of magnetic variables, etc., can solve problems such as MRS signal extraction, and achieve the effect of effective extraction
- Summary
- Abstract
- Description
- Claims
- Application Information
AI Technical Summary
Problems solved by technology
Method used
Image
Examples
Embodiment 1
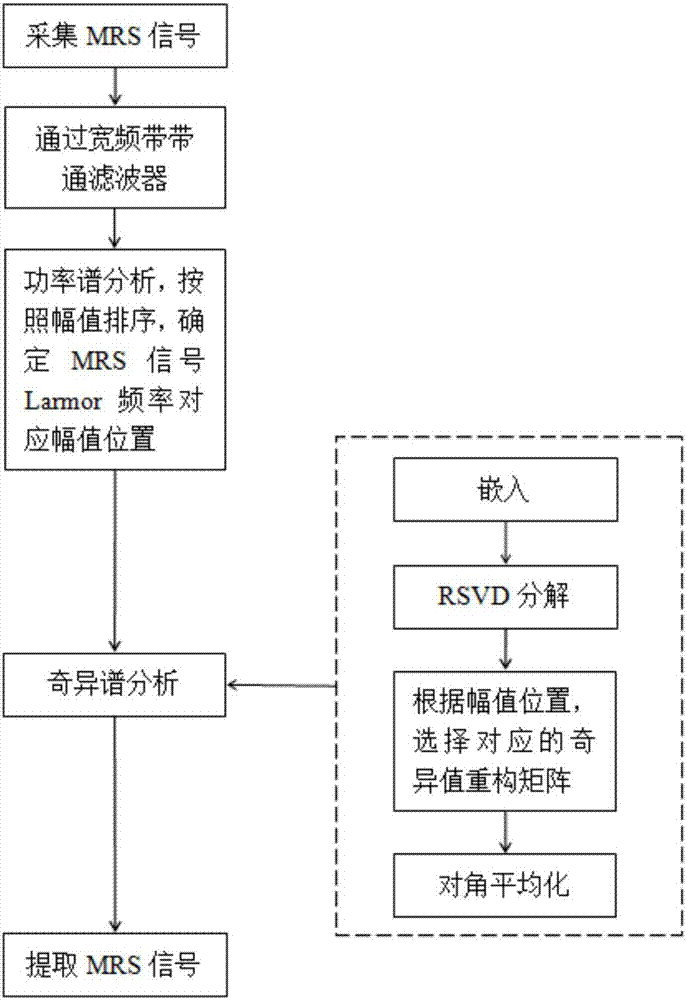
[0110] This embodiment is a simulation experiment of the method of the present invention carried out under the MATLAB 2015a programming environment. The simulation algorithm of the magnetic resonance sounding signal extraction method based on frequency-selective singular spectrum analysis, refer to figure 1 , including the following steps:
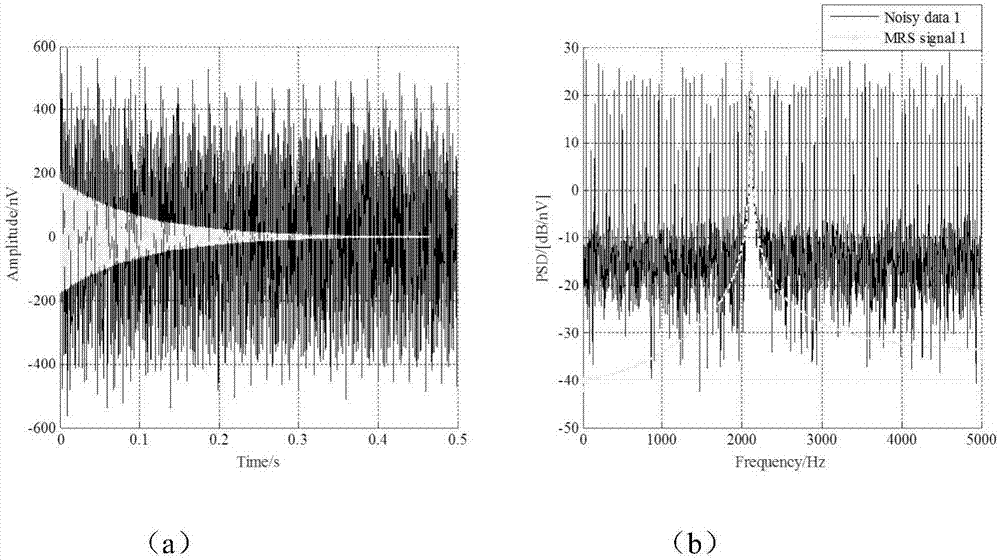
[0111] Step (1): Construct a Larmor frequency of 2114Hz and an amplitude e 0 is 180nV, the relaxation time T 2 * 0.1s, a pure MRS signal with a phase of 1.03, the signal sampling rate is 10kHz, the signal length is 500ms, and the number of data points is 5000, such as image 3 (a) and image 3 (b) shown. On the basis of this signal, 16 groups of noise-containing signals are simulated, and each group of signals is added with 100 power frequency interferences with an amplitude of 100nV, random phase, and an integer multiple of 50Hz between 0Hz and 5000Hz; the amplitude is 100nV, continuous Spike noise with a duration of 10ms and random...
Embodiment 2
[0120] In this embodiment, the MRS signals collected in Shaoguo Town, Changchun City (the Larmor frequency is about 2332.5 Hz) are used as the processing object of the method of the present invention. Such as figure 1 As shown, the magnetic resonance sounding signal extraction method based on frequency-selective singular spectrum analysis includes the following steps:
[0121] Step (1): Collect a set of observed MRS signals X using the nuclear magnetic resonance sounding (MRS) water detector 1 (t) (for a row vector), such as Figure 8 (a) and Figure 8 As shown in (b), the sampling rate is 25kHz, the number of data points is 12476, and the signal-to-noise ratio is calculated as SNR=-7.1453dB;
[0122] Step (2): The MRS signal X will be observed 1 (t) After such Figure 9 In the bandpass filter shown, the bandpass filter used is a Chebyshev filter, the left boundary of the passband is 2100Hz, the right boundary of the passband is 2500Hz, the left boundary of the stopband i...
PUM
 Abstract
Description
Claims
Application Information
 - R&D
- Intellectual Property
- Life Sciences
- Materials
- Tech Scout
- Unparalleled Data Quality
- Higher Quality Content
- 60% Fewer Hallucinations
Browse by: Latest US Patents, China's latest patents, Technical Efficacy Thesaurus, Application Domain, Technology Topic, Popular Technical Reports.
© 2025 PatSnap. All rights reserved.Legal|Privacy policy|Modern Slavery Act Transparency Statement|Sitemap|About US| Contact US: help@patsnap.com


