Fluorescent quantitative PCR detection kit and method for predicting sepsis infection
A detection kit and fluorescence quantitative technology, applied in the field of biomedicine, can solve problems such as difficult diagnosis of sepsis, and achieve good clinical application prospects
- Summary
- Abstract
- Description
- Claims
- Application Information
AI Technical Summary
Problems solved by technology
Method used
Image
Examples
Embodiment 1
[0028] Step S1 Use the QIAamp Fast DNAStool Mini Kit (51604) kit to extract the stool genome sample
[0029] Weigh 200 mg of fresh or frozen (stored at -80°C) stool sample in a 2 mL centrifuge tube and place it on ice, add 1 mL of InhibitEx Buffer, and shake for 1 min. The above suspension was heated in a metal bath at 70° C. for 5 minutes, and centrifuged at 8000 rpm for 1 minute at room temperature to obtain a supernatant. Add 15uL proteinase K to the bottom of a new 1.5mL centrifuge tube, add 200μL supernatant; add 200μL Buffer AL, shake for 15s; heat in a metal bath at 70°C for 10min, and centrifuge briefly to remove the liquid along the inner edge of the tube cap. Add 200 μL of ethanol (concentration: 96% to 100%) into the above centrifuge tube, shake for 15 seconds and centrifuge for a short time. Carefully add the above mixture into the QIAamp spin column, put the spin column into a 2mL collection tube, close the cap of the centrifuge tube, centrifuge at 8000rpm for 1m...
Embodiment 2
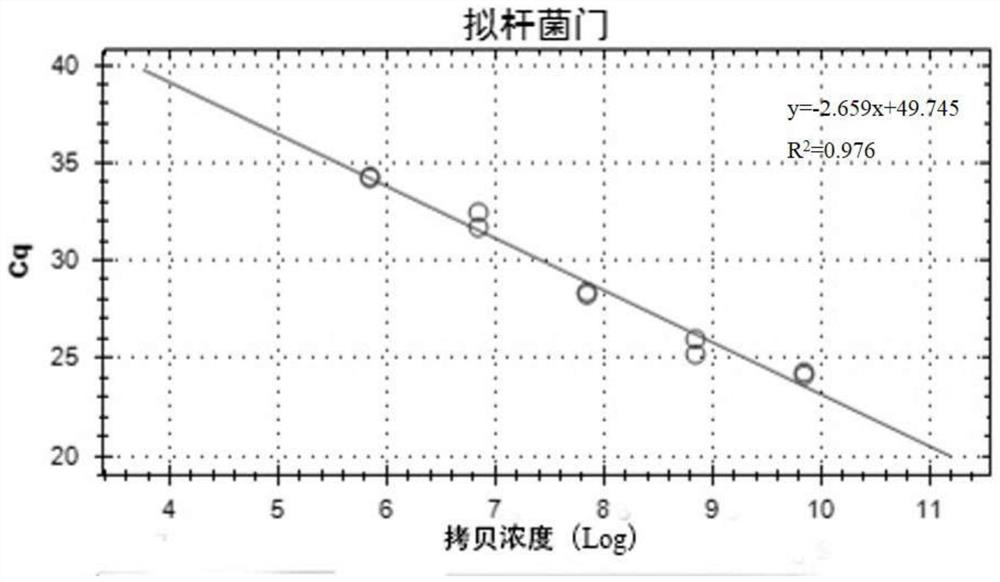
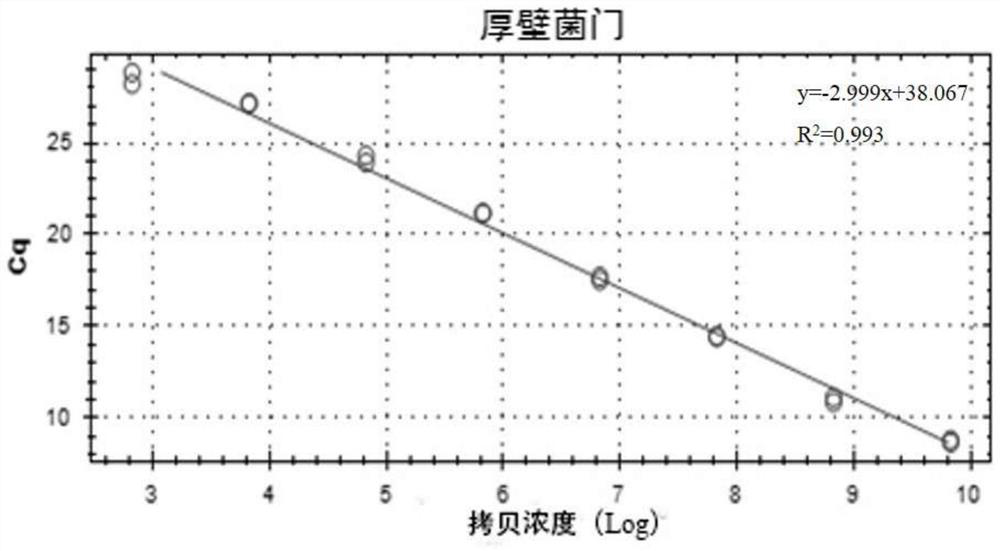
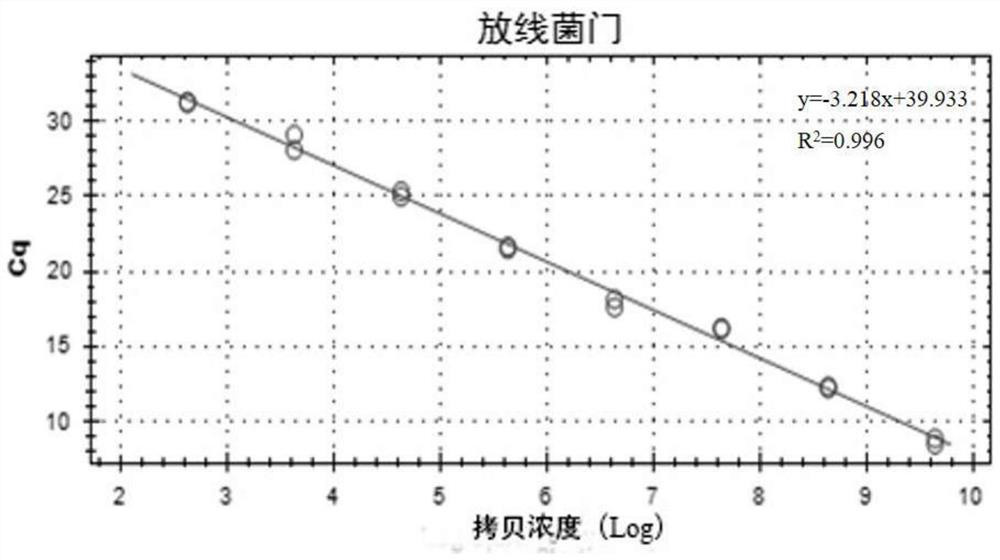
[0047] Quantitative analysis of the level of intestinal flora was carried out on the stool samples of patients diagnosed with sepsis and normal controls, and the experimental procedures and conditions were the same as those in Example 1. The plasmid stock solution of each gate (that is, the pure plasmid stock solution sample obtained by TA cloning) was equally diluted with distilled water, and the dilution factor was 10, and a total of 8 concentration gradients were diluted, respectively starting from 10 -1 diluted to 10 -8 , as the standard curve points in the respective gate qPCR, the results of the standard curve are shown in Figure 1. The qPCR reaction was performed using the Bio-Rad CFX Connect instrument, and the cycle conditions are shown in Table 2 above. The output of the sample to be tested is the final concentration of the target product of each gate, and then the logarithm (log10) is taken to obtain the relative abundance. Compare the obtained flora structure wit...
PUM
 Abstract
Description
Claims
Application Information
 - R&D
- Intellectual Property
- Life Sciences
- Materials
- Tech Scout
- Unparalleled Data Quality
- Higher Quality Content
- 60% Fewer Hallucinations
Browse by: Latest US Patents, China's latest patents, Technical Efficacy Thesaurus, Application Domain, Technology Topic, Popular Technical Reports.
© 2025 PatSnap. All rights reserved.Legal|Privacy policy|Modern Slavery Act Transparency Statement|Sitemap|About US| Contact US: help@patsnap.com


