Rotor winding image detection method fusing region distribution characteristics and edge scale angle information
A technology of regional distribution and image detection, which is applied in image analysis, image data processing, instruments, etc., can solve the problems of similarity value fluctuations, long calculation time of standard templates, etc., achieve high accuracy, improve detection accuracy, and work efficiency high effect
- Summary
- Abstract
- Description
- Claims
- Application Information
AI Technical Summary
Problems solved by technology
Method used
Image
Examples
Embodiment 1
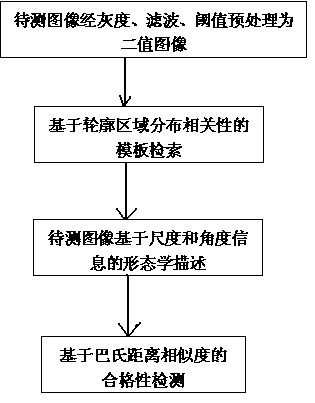
[0038] A rotor winding image detection method that integrates regional distribution characteristics and edge scale angle information, as shown in Figure 1, specifically includes the following steps:
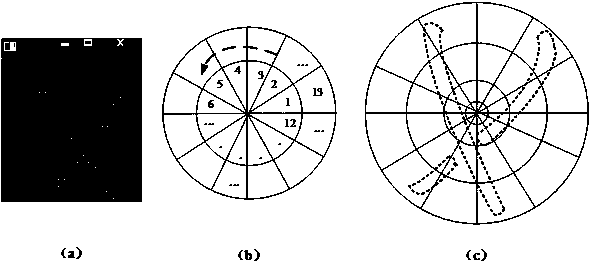
[0039] S1: Perform grayscale preprocessing on the image to be tested, that is, convert the color image into a grayscale image, and then enter the filtering preprocessing operation, that is, use the median filter method to denoise the grayscale image of the image to be tested, and finally perform threshold preprocessing. The processing operation adopts the iterative method to adaptively calculate the threshold value, and performs binarization operation on the filtered gray image with this threshold value, so as to complete the image preprocessing of the winding area, and the image to be tested becomes a binary image, such as figure 2 (a) and figure 2 (b), figure 2 (a) is the preprocessing image of the image to be tested in the present invention. The winding area in the image ...
Embodiment 2
[0045] The difference between this embodiment and Embodiment 1 is that the S2 includes the following steps:
[0046] S21: Calculate the similarity of the spatial distribution characteristics of the contour of the winding area between the image to be tested and the template;
[0047] S22: Relevance search is performed on the template image based on the regional distribution characteristics;
[0048]The template retrieval algorithm based on the distribution characteristics of the contour area needs to perform correlation retrieval on the template image based on the distribution characteristics of the region first, and the distribution correlation between two images (template and image to be tested) can be calculated by the following formula
[0049]
[0050] in: h k (J) is the number of contour sampling points distributed in the J block area, and N is the number of area blocks divided by the distribution descriptor;
[0051] S23: Select the origin, divide and mark the ima...
Embodiment 3
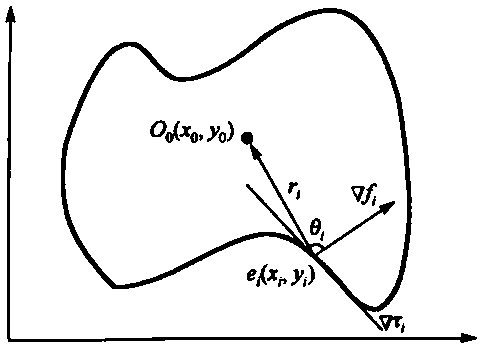
[0055] The difference between this embodiment and the above embodiment is that: the morphological description of the scale and angle information of the contour in S3 is as follows, for any point e on the edge of the contour i (x i ,y i ) and contour centroid O 0 (x 0 ,y 0 ) form the vector r i , the polar radius is defined as It is the scale information, any point e on the edge of the contour i (x i ,y i ) at the angle size can be defined as a vector gradient with the point The included angle θ i , which is the angle information, θ i Calculated as follows
[0056]
[0057] It can be seen that the angle θ i The calculation does not rely on absolute coordinates, but in the vector r i as the relative coordinates of the datum. In this way, the information statistics of the scale and angle based on the centroid are established, and the figure 2 Take the figure (c) as an example, the histogram statistics of the angle and scale of the edge points of the winding...
PUM
 Abstract
Description
Claims
Application Information
 - R&D
- Intellectual Property
- Life Sciences
- Materials
- Tech Scout
- Unparalleled Data Quality
- Higher Quality Content
- 60% Fewer Hallucinations
Browse by: Latest US Patents, China's latest patents, Technical Efficacy Thesaurus, Application Domain, Technology Topic, Popular Technical Reports.
© 2025 PatSnap. All rights reserved.Legal|Privacy policy|Modern Slavery Act Transparency Statement|Sitemap|About US| Contact US: help@patsnap.com


