A method and a product for building programmed transaction logic based on graphics
A programmatic transaction and graphical technology, applied in visual/graphic programming, creation/generation of source code, instruments, etc., can solve the problem of increasing the threshold of quantitative transactions, inconvenient management of different models, and increasing the workload of practitioners with strategy building tools, etc. problem, to achieve the effect of intuitive and effective model management, and simplify the difficulty of development
- Summary
- Abstract
- Description
- Claims
- Application Information
AI Technical Summary
Problems solved by technology
Method used
Image
Examples
Embodiment 1
[0042] Such as figure 1 Shown:
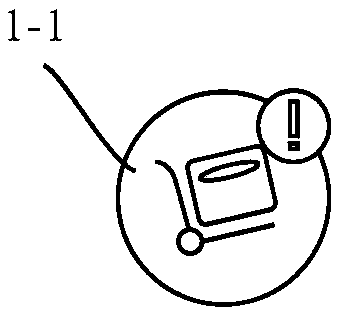
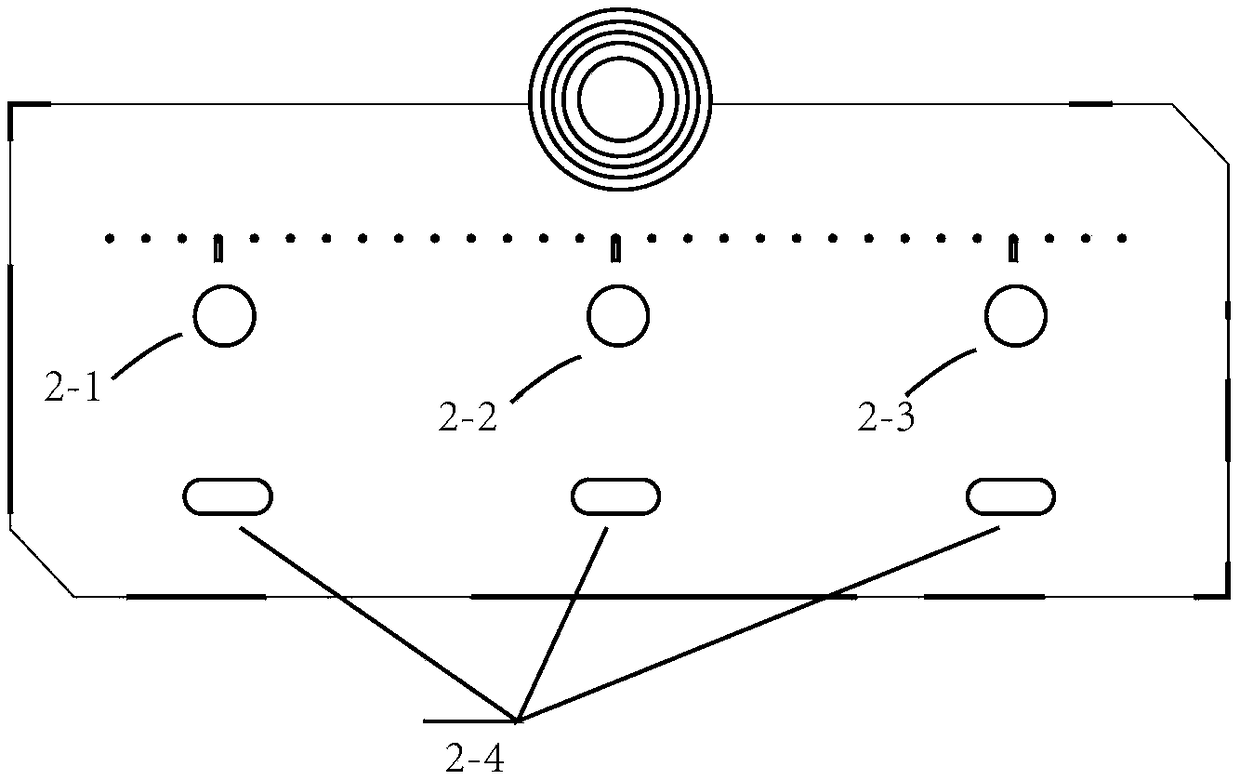
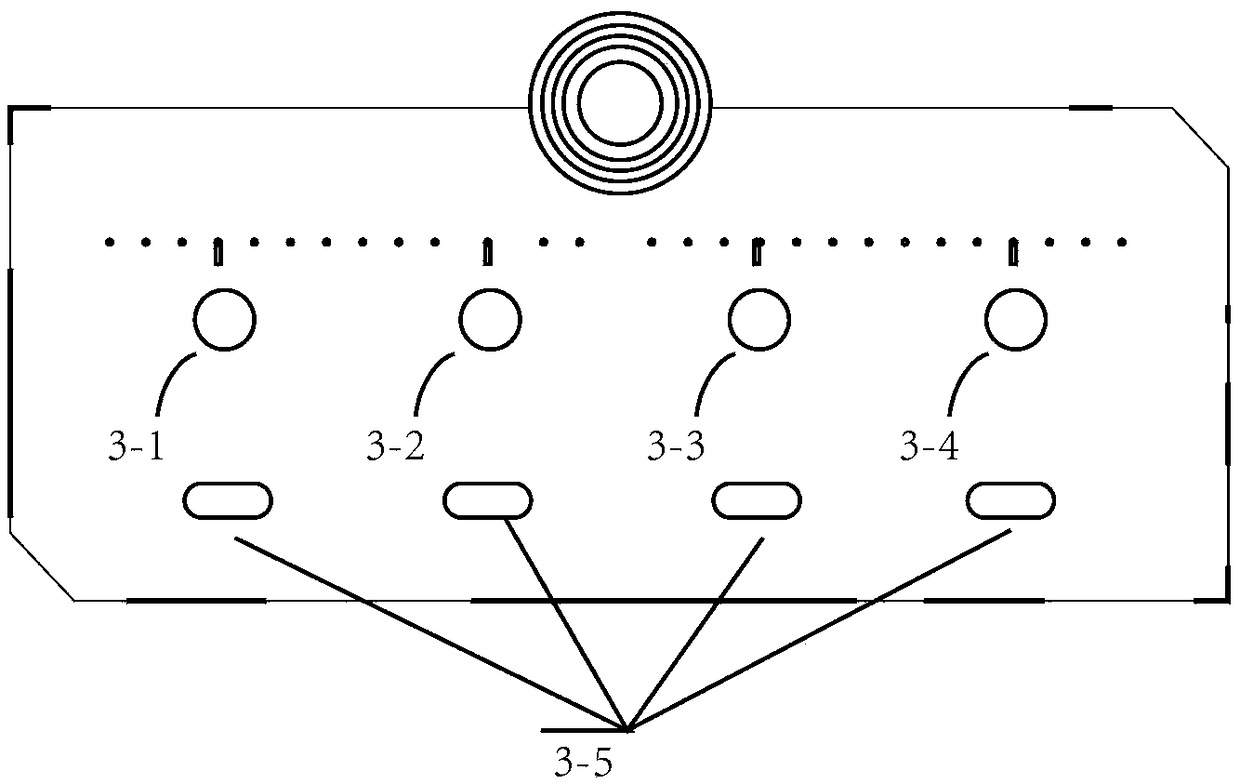
[0043] Variety module technical scheme diagram: figure 1 Among them, 1-1 represents a variety, in icon operation, pop-up such as figure 2 In the market type selection interface shown, there are three types of data to choose from: main force (continuous main force) 2-1, index (volume-weighted index) 2-2, and spot stock 2-3. After selecting one of the market types, pass 2 -4 is used to select the use button, and the market type icon will be displayed through the arrow connection after the variety icon, and the market frequency information can be customized in the pop-up display market data by operating on the market type icon, such as image 3 After customization, the market sub-icons of minute K line 3-1, daily line 3-2, second K line 3-3, and TICK3-4 will be generated. After operating on the sub icons, select the Add button 3-5 to pop up the market data Available market data in , such as Figure 4 As shown, the icons 4-1 to 4-9 are respe...
Embodiment 2
[0045] Such as Figure 5-7 Shown:
[0046] Function scheme diagram: such as Figure 5 Shown is an icon of a specific function, and the text and graphics in the icon represent the type of function. When the function inputs parameters, drag the line from the market data content or the output icon of the parameter to the function icon, and the input operation interface will pop up automatically, such as Figure 6 As shown, 6-1 in the figure is the input port, 6-2 fastlength is the length of the fast moving average, such as the 12-day moving average, 6-3slowlength is the length of the slow moving average, such as the 26-day moving average, and 6-4 signallength is the length of the DIF moving average, such as 9 The daily moving average and 6-5 price are market prices, and you can choose the corresponding data input key 6-6 as the input of specific corresponding parameters such as Figure 6 . The output interface can pop up by operating the function icon, such as Figure 7 As s...
Embodiment 3
[0048] Such as Figure 8 As shown: 8-1 in the figure represents a product, 8-2 represents the index, and 8-3 represents the closing price;
[0049] The variable module is divided into three parts. The first part on the left is the driving data source setting part. The contract name, market type and market frequency information of the driving market data can be set according to the variety module. The second part is the logical judgment condition. Based on the market data, the output of parameters and other variables as the basic elements, the logical condition is built by combining the operations that can be selected in the operator interface. The output bool value indicates whether to perform subsequent operations. The far right is the calculated output value when the market-driven data is updated.
PUM
 Abstract
Description
Claims
Application Information
 - R&D
- Intellectual Property
- Life Sciences
- Materials
- Tech Scout
- Unparalleled Data Quality
- Higher Quality Content
- 60% Fewer Hallucinations
Browse by: Latest US Patents, China's latest patents, Technical Efficacy Thesaurus, Application Domain, Technology Topic, Popular Technical Reports.
© 2025 PatSnap. All rights reserved.Legal|Privacy policy|Modern Slavery Act Transparency Statement|Sitemap|About US| Contact US: help@patsnap.com


