Industrial process fault diagnosis method for complex fault
A fault diagnosis and industrial process technology, which is applied in general control systems, instruments, test/monitoring control systems, etc., can solve problems such as large amount of calculation and inability to diagnose industrial process faults
- Summary
- Abstract
- Description
- Claims
- Application Information
AI Technical Summary
Problems solved by technology
Method used
Image
Examples
Embodiment 1
[0143] In embodiment 1, the Monte Carlo (Monte Carlo) numerical simulation example is specifically described as:
[0144]
[0145] where x is the sample under normal working conditions, t 1 , t 2 , t 3 It is three latent variable signals with mean value 0 and standard deviation 1, 0.8 and 0.6 respectively, conforming to Gaussian distribution, noise is white noise with mean value 0 and standard deviation 0.2, noise~N(0, 0.2); total 3000 normal samples to form the training set;
[0146] The fault samples to be detected are expressed in the following general form:
[0147]
[0148] In Embodiment 1, ξ=[0 1 1 0 0 0], f=t / 400 indicates a linearly increasing fault, and a fault occurs from the 200th sample, and there are a total of 1000 fault samples to be tested.
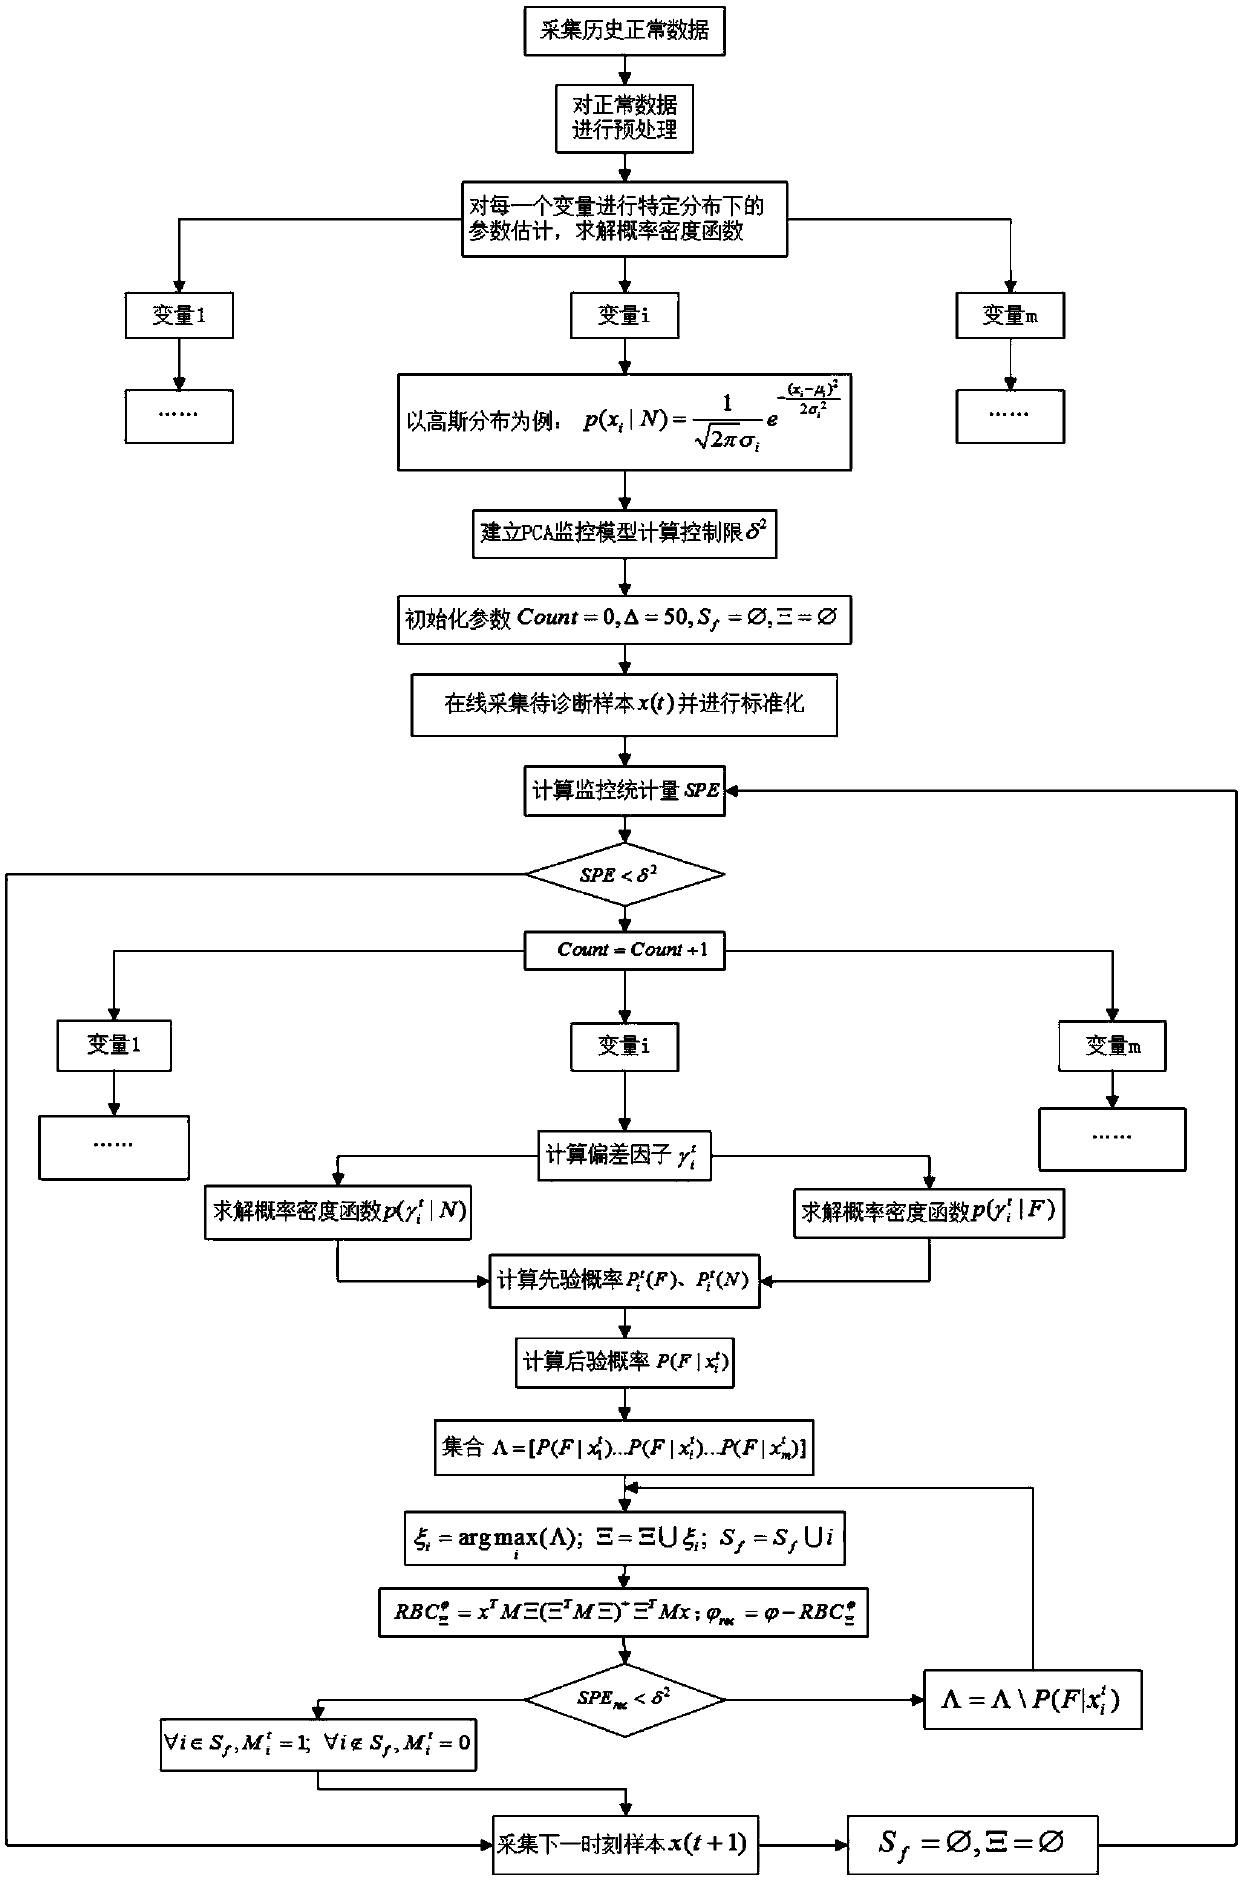
[0149] Using the fault diagnosis method provided in this example, the specific steps for fault diagnosis of Embodiment 1 are as follows:
[0150] (1) For normal sample set matrix X∈R 3000×6 Carry out standardiz...
Embodiment 2
[0163] Embodiment 2 improves the difficulty of diagnosis and expands variables to high-dimensional faults, specifically described as:
[0164]
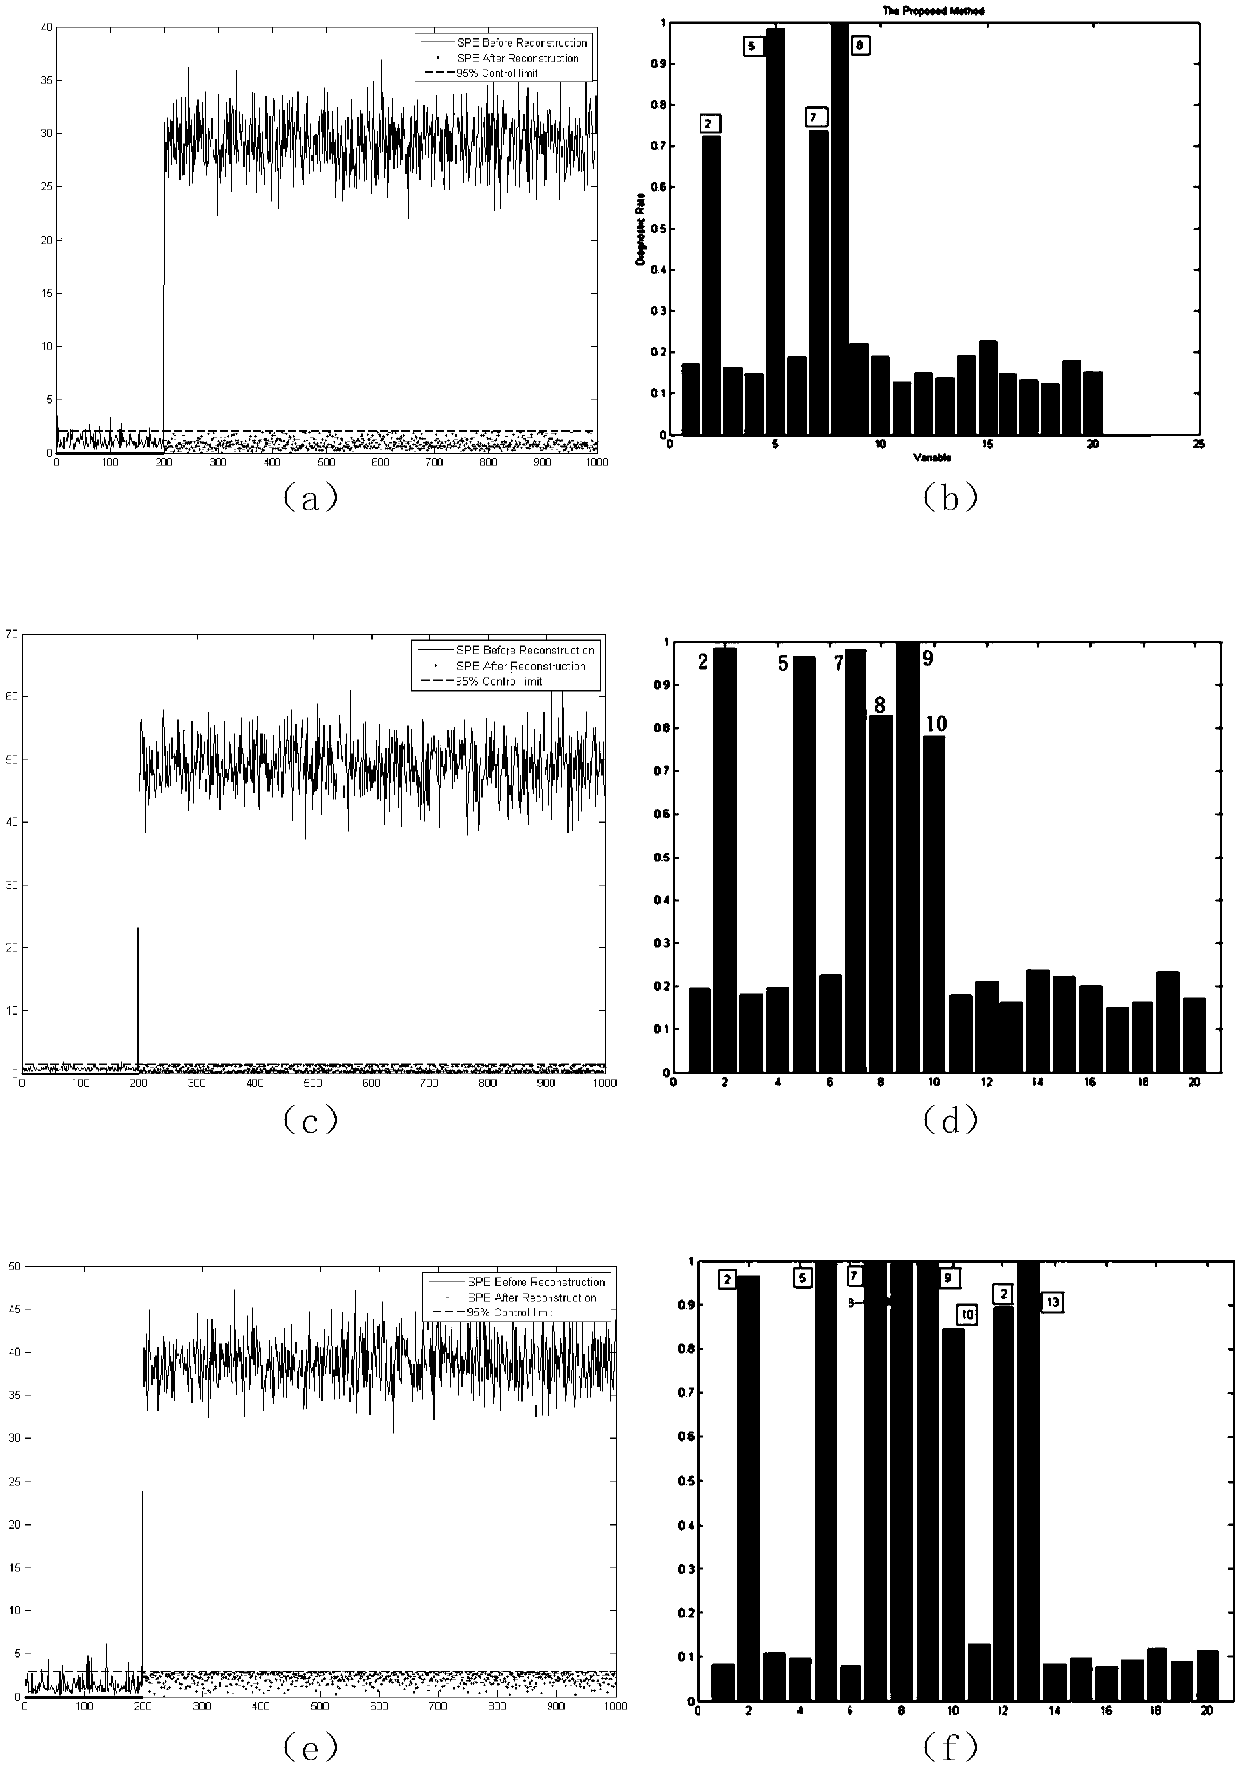
[0165] where A∈R 20×3 , the sample to be tested The fault is adjusted to a step fault with an amplitude of 2, and three sets of tests are carried out. The first set of fault directions is 2, 5, 7, and 8, the second set of fault directions is based on the first set plus 9, 10, and the third set Group fault direction is to add 12, 13 on the basis of the second group, other parameters are not changed, image 3 (a)(b) is the first set of test results, image 3 (c)(d) is the second set of test results, image 3 (e)(f) is the third group of test results, as can be seen from the figure, the present invention has carried out positioning and tracking to the fault variables well, even when the coefficient matrix A is constantly changing and the fault variables are constantly changing , also has a high accuracy rate, and the system after...
Embodiment 3
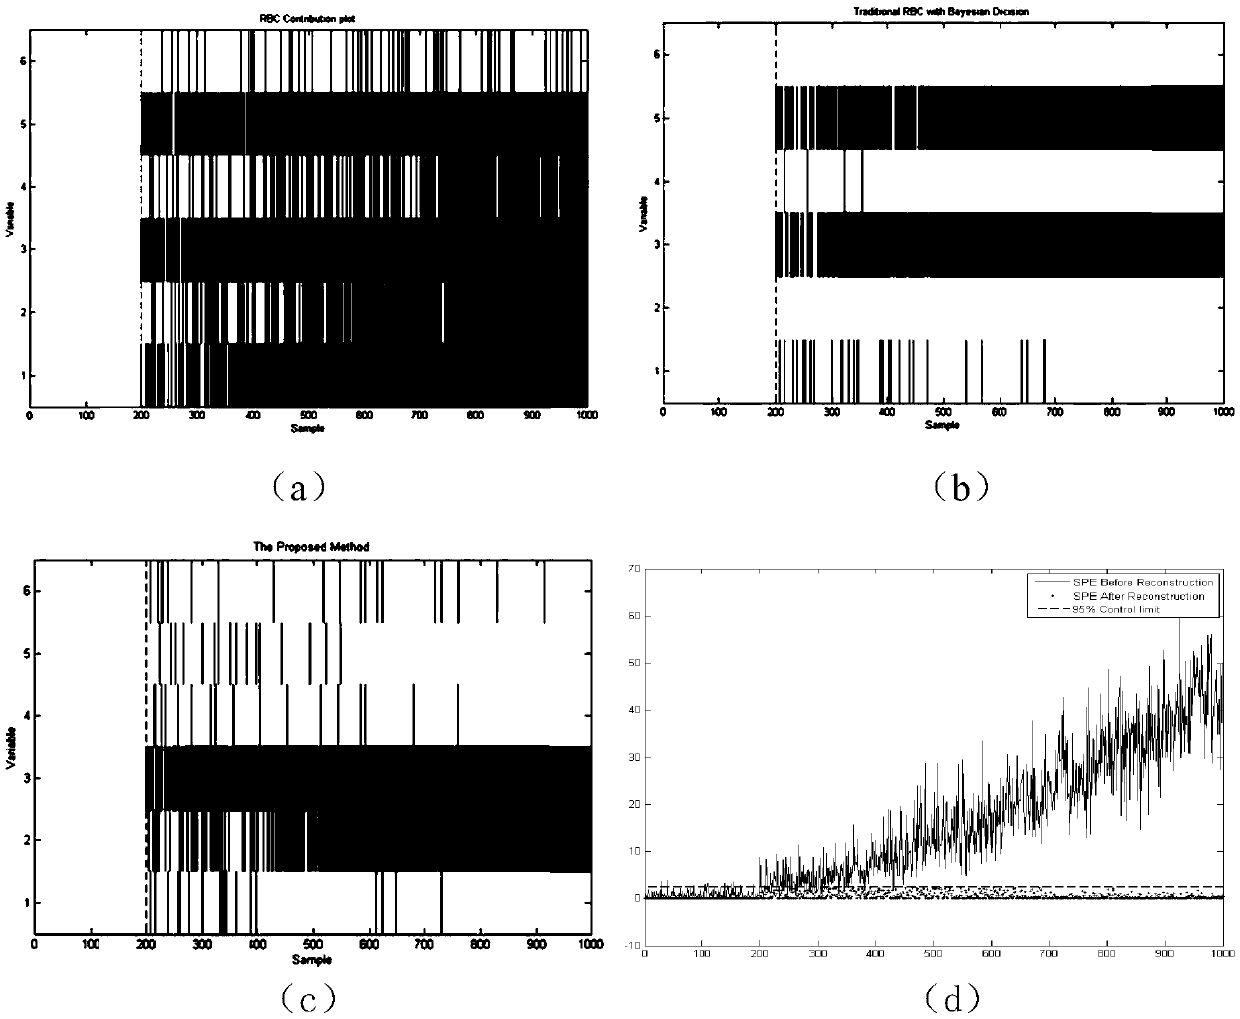
[0167] Embodiment 3 is to carry out the test of the 6th kind of fault in TE simulation data set, Figure 4 (a), (b), and (c) are respectively the traditional RBC contribution graph, the traditional RBC plus Bayesian filter, and the diagnosis results of the present invention, Figure 4 (d) is the change graph of each variable. From Figure 4 In (a), it can be seen that due to excessive interaction between variables and fault propagation, almost every variable is diagnosed as a fault, which is a failure diagnosis caused by too much coupling between variables; Figure 4 In (b), it can be seen that the Bayesian filter has filtered many variables, resulting in almost only one or two variables in the result, while the comparison Figure 4 (d) it can be seen that the diagnosis is not meaningful; Figure 4 (c) with Figure 4 (d) Contrast can be found, the present invention has pointed out all variables of failure accurately, and the system after diagnosis returns to normal state, ...
PUM
 Abstract
Description
Claims
Application Information
 - R&D
- Intellectual Property
- Life Sciences
- Materials
- Tech Scout
- Unparalleled Data Quality
- Higher Quality Content
- 60% Fewer Hallucinations
Browse by: Latest US Patents, China's latest patents, Technical Efficacy Thesaurus, Application Domain, Technology Topic, Popular Technical Reports.
© 2025 PatSnap. All rights reserved.Legal|Privacy policy|Modern Slavery Act Transparency Statement|Sitemap|About US| Contact US: help@patsnap.com


