

Screening method for pollutants in water
A technology for pollutants and screening, applied in measuring devices, instruments, scientific instruments, etc., can solve the problems of cumbersome operation, insufficient scanning speed, and lack of
- Summary
- Abstract
- Description
- Claims
- Application Information
AI Technical Summary
Problems solved by technology
Method used
Image

Examples
example 1
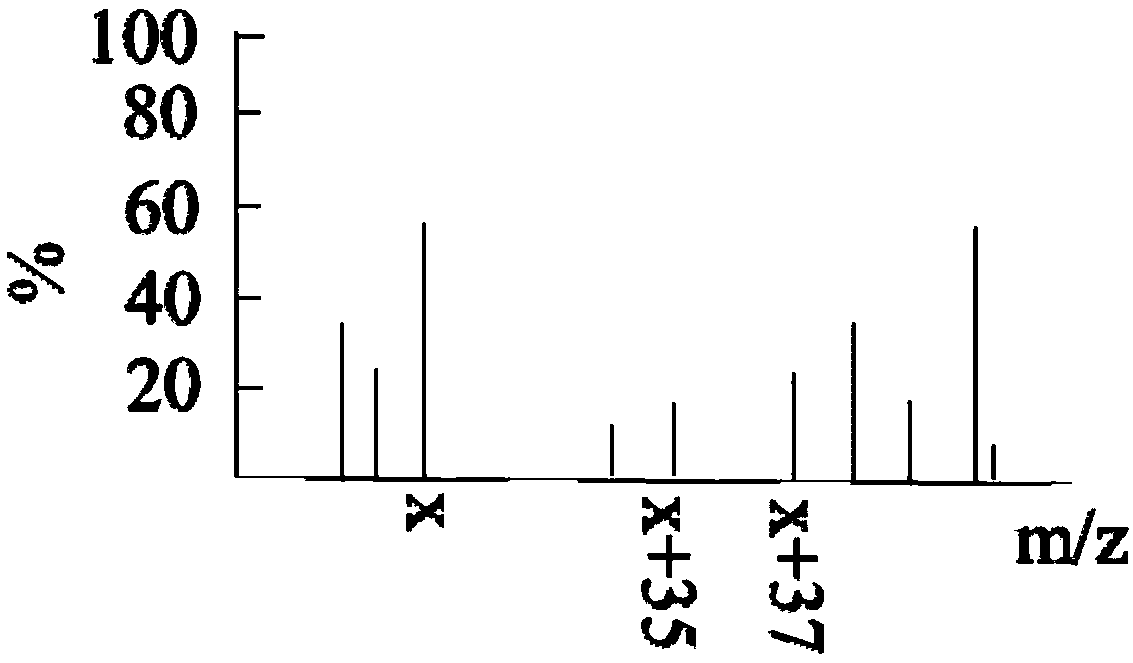
[0137] After the sample to be tested is analyzed by two-dimensional gas chromatography-EI mass spectrometry, the mass spectra arranged in the order of mass-to-charge ratio are obtained, and some of the mass spectra are as follows: Figure 4 shown. Take the existing chloroform as an example, in this figure, m / z=14, m / z+105 / 107 / 109 / 111=119 / 121 / 123 / 125, at m / z=119 / 121 / The mass spectrum peak can be observed at 123 / 125, and S / N>3, R>3%, and this signal exists in the corresponding split ECD detector result, and S / N>3, R>3%, therefore, The substance to be tested contains trichloro( 35 Cl and 37 Cl) Pollutants. It can be combined with NIST spectral library for further identification.
example 2
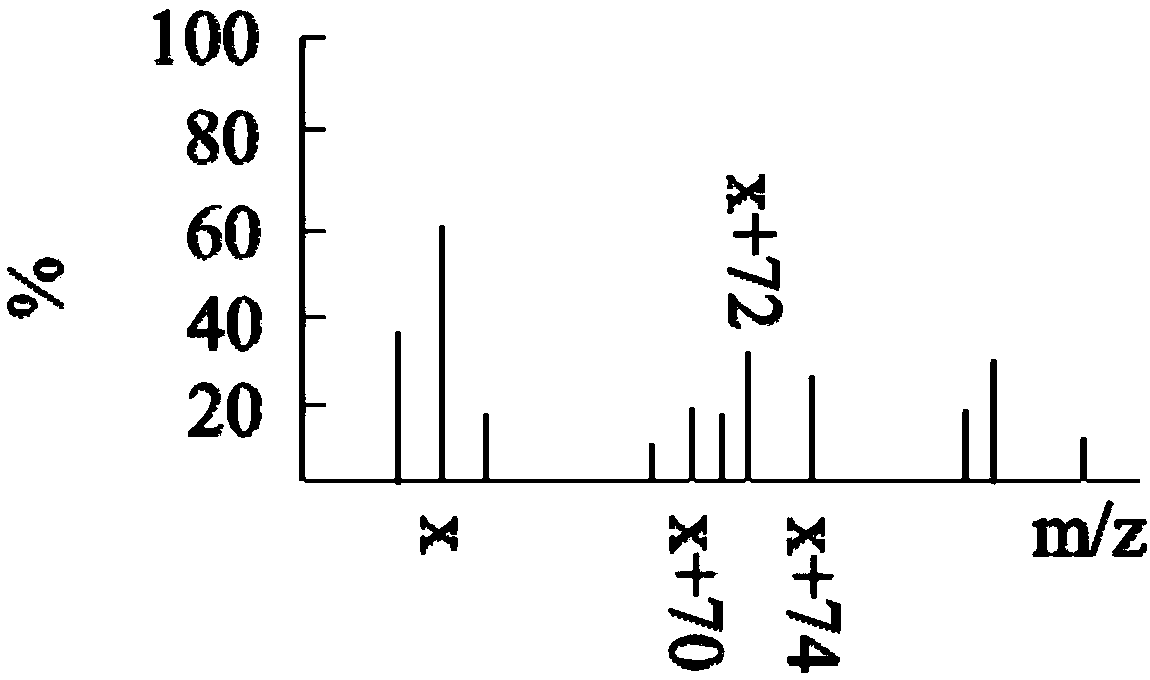
[0139] After the sample to be tested is analyzed by two-dimensional gas chromatography-EI mass spectrometry, the mass spectra arranged in the order of mass-to-charge ratio are obtained, and some of the mass spectra are as follows: Figure 5 shown. Taking the existing monobromoacetonitrile as an example, in this figure, m / z=40, m / z+79 / 81=119 / 121, mass spectrum peaks can be observed at m / z=119 / 121, and S / N>3, R>3%, there is this signal in the corresponding split ECD detector result, and S / N>3, R>3%, therefore, contain monobromo( 79 Br and 81 Br) pollutants. It can be combined with NIST spectral library for further identification.
example 3
[0141] After the sample to be tested is analyzed by two-dimensional gas chromatography-EI mass spectrometry, the mass spectra arranged in the order of mass-to-charge ratio are obtained, and some of the mass spectra are as follows: Figure 6 shown. Taking the existing nitrobenzene as an example, in this figure, m / z=77, m / z+46=123, a mass spectrum peak can be observed at m / z=123, and S / N>3, R >3%, the signal exists in the corresponding split ECD detector result, and S / N>3, R>3%, therefore, the analyte contains nitro-substituted pollutants. It can be combined with NIST spectral library for further identification.
PUM
 Abstract
Description
Claims
Application Information