Device and method for providing page framework for content development through data visualization development

A content and page technology, applied in other database browsing/visualization, electronic digital data processing, other database retrieval, etc., to achieve the effect of simplifying complexity and improving overall efficiency

Active Publication Date: 2019-09-24
BEIJING ACT TECH DEV CO LTD
View PDF8 Cites 2 Cited by
  • Summary
  • Abstract
  • Description
  • Claims
  • Application Information

AI Technical Summary

Problems solved by technology

The data visualization development device and method for providing a page frame for content development in the present invention can solve the problem of providi

Method used


Image

  • Device and method for providing page framework for content development through data visualization development
  • Device and method for providing page framework for content development through data visualization development
  • Device and method for providing page framework for content development through data visualization development

Examples


Embodiment Construction

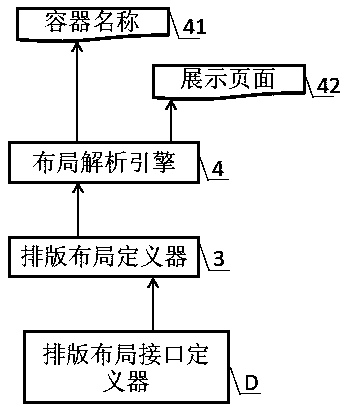
[0098] see figure 1 , Image 6 and Figure 7 , the method for realizing the data visualization development of the present invention to provide a page frame for content development includes the interface definition step S01, the typesetting layout input step S02, and the typesetting layout analysis step S03;

[0099] 1), interface definition steps

[0100] The interface standard for the typesetting layout defined by the typesetting layout interface definer D is:

[0101] According to the JSON data format definition, mode, minHeight, minWidth, Layouts;

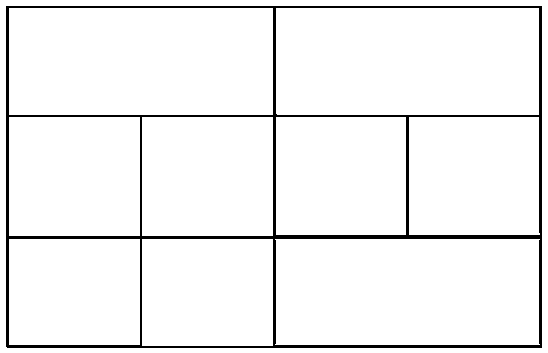
[0102] mode refers to the page layout format represented by the page width-to-height ratio. The value range of mode includes: 41, 21, 11, 12, and 14. There are five modes in total. 41 means the aspect ratio is 4 to 1, and 21 means wide The height ratio is 2:1, 11 means the aspect ratio is 1:1, 12 means the aspect ratio is 1:2, and 14 means the aspect ratio is 1:4;

[0103] minHeight and its value represent the minimum height...


PUM


Abstract

The invention discloses a method for providing a page framework for content development through data visualization development, and relates to the technical field of information. The method comprises an interface defining step, a typesetting layout inputting step and a typesetting layout analyzing step. According to the method, the complexity of the work of typesetting layout is greatly simplified, and meanwhile, various incompatible typesetting implementation is avoided, so that the typesetting of the data visualization page is carried out in one mode. In the production practice of the invention, when the method is used for developing a data visualization interface, the difficulty of typesetting layout is greatly reduced in the development process, most people can master the method of the typesetting layout after simple training, and the production efficiency is greatly improved.

Description

technical field [0001] The invention relates to the field of information technology, in particular to the technical field of linking page development and content development for data visualization in the field of software development. Background technique [0002] With the increasing popularity of big data technology, the data visualization system, a branch of the web system, has been greatly developed. Data visualization is a scientific and technological research on the visual representation of data. Among them, the visual representation of this data is defined as information extracted in a certain summary form, including various attributes and variables of the corresponding information unit. Data visualization mainly uses graphical means to convey and communicate information clearly and effectively. But that doesn't mean that data visualization has to be tedious in order to achieve its functional purpose, or extremely complex in order to look colorful. In order to effec...

Claims


Application Information

Patent Timeline
IPC IPC(8): G06F16/904G06F8/38
CPCG06F8/38G06F16/904
Inventor 林飞夏俊古元于龙王娜熊翱
Owner BEIJING ACT TECH DEV CO LTD
Why Eureka
Try Eureka