Meteorological radar and satellite big data visualization method based on WebGL

A weather radar and satellite data technology, which is applied in still image data browsing/visualization, climate sustainability, electrical digital data processing, etc., can solve problems such as fuzziness, low data display efficiency, and display freeze, etc., to reduce computing and memory usage, improve the efficiency of rendering and interaction, and improve efficiency

Pending Publication Date: 2019-10-01
NANJING NRIET IND CORP
View PDF6 Cites 4 Cited by
  • Summary
  • Abstract
  • Description
  • Claims
  • Application Information

AI Technical Summary

Problems solved by technology

With the increase in the amount of radar data and the increase in interaction requirements, there are certain bottlenecks in the efficiency and effect of visualization on the browser side. There are currently several problems: 1. Directly use pictures to display, which will be blurred after zooming in, which is not the same as thinning data. It is easy to analyze data; 2. The display efficiency of large amount of data on the browser side is not high, and the display is stuck

Method used


Image

  • Meteorological radar and satellite big data visualization method based on WebGL

Examples


Embodiment Construction

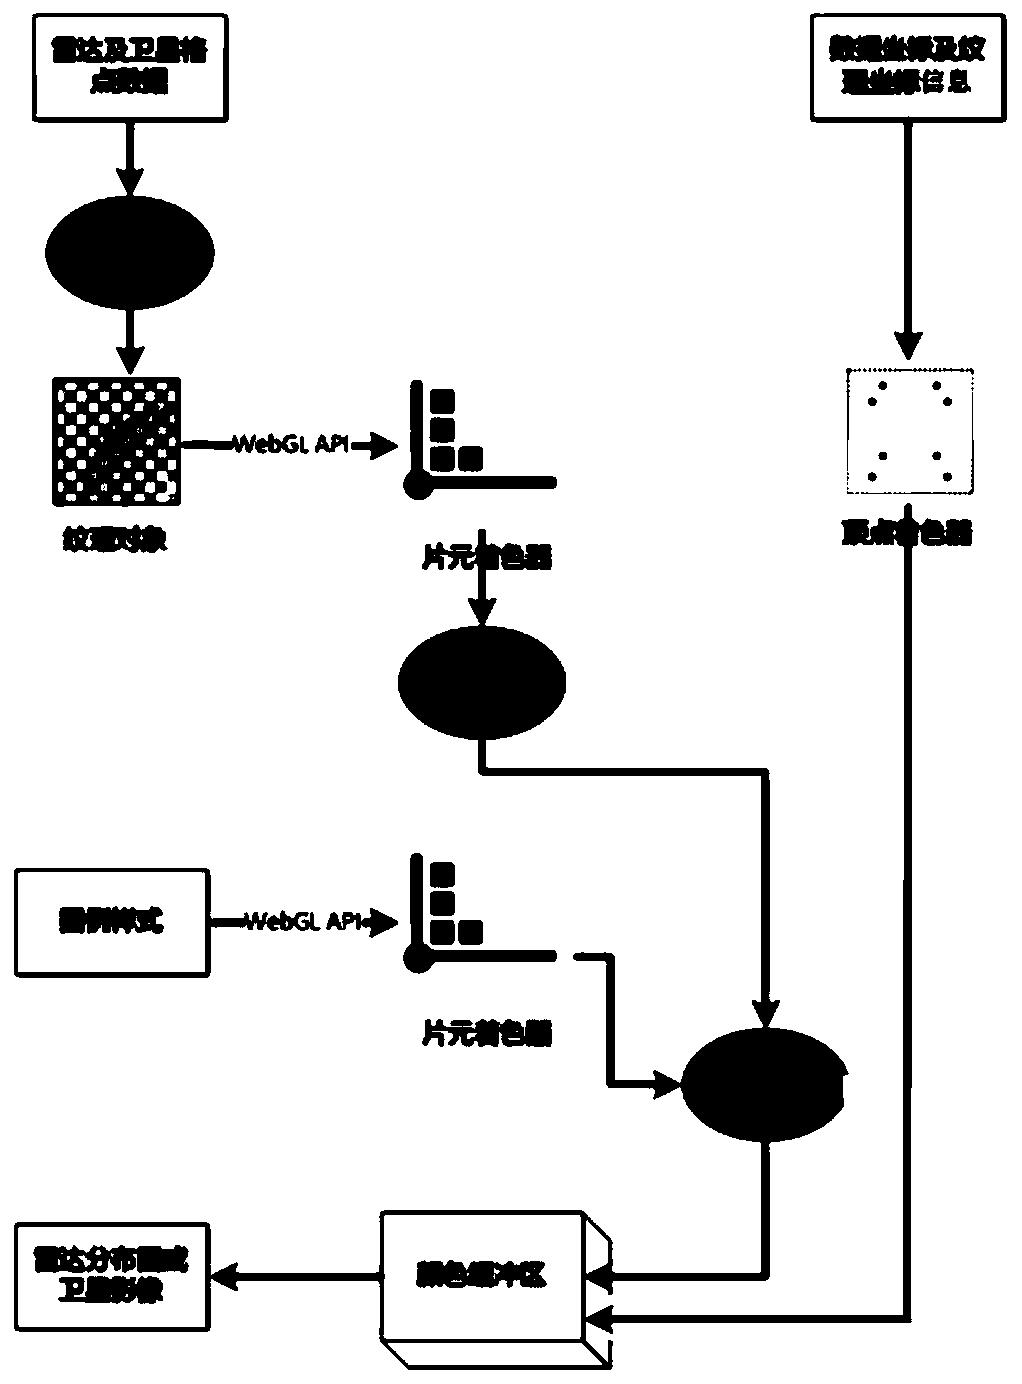
[0015] Such as figure 1 As shown, the present invention provides a kind of weather radar and satellite big data visualization technology based on WebGL, comprising the following steps:

[0016] Step 1-1, the meteorological radar and satellite data are converted and compressed through the original image file format raw to generate texture objects; the real data is compressed into the form of texture RGBA or LA (lumens and transparency) quantities supported by WebGL;

[0017] Step 1-2, transfer the compressed texture object from the CPU to the graphics processing unit GPU, and reach the fragment shader;

[0018] Steps 1-3, the fragment shader rasterizes the data;

[0019] Step 2, the coordinate projection information (real geographic coordinates) and the texture coordinate information of the data are transmitted to the vertex shader;

[0020] Step 3, the legend style is transferred from the CPU to the graphics processor GPU (RGBA format), and also transferred to the fragment s...


PUM


Abstract

The invention discloses a meteorological radar and satellite big data visualization method based on WebGL. The meteorological radar and satellite big data visualization method comprises the followingsteps: carrying out data conversion compression on meteorological radar and satellite data through an original image file format raw to generate a texture object; transmitting the compressed texture object from the CPU to a GPU to reach a chip shader; and enabling the chip shader to perform rasterization processing on the data; transmitting the coordinate projection information and the texture coordinate information of the data to a vertex shader; transmitting the legend style to the GPU through the CPU and transmitting the legend style to the chip shader object for rasterization processing; after rasterization processing and vertex shader processing, storing the weather data in a color buffer area, and finally displaying the weather data on a browser page according to geographic coordinates. WebGL and GPU display card resources are directly used for data interpolation and rendering, and the data visualization rendering and interaction efficiency can be improved to a great extent.

Description

technical field [0001] The invention relates to a weather radar and satellite big data visualization technology based on WebGL. Background technique [0002] Radar and satellites are an important means of meteorological observation. Meteorological application systems often need to visualize radar and satellite data to assist weather forecasting. Currently, the browser visualization technology in the WebGIS system generally renders data into pictures or extracts data in the background. , and then use the html image tag, svg image tag, and canvas tag to display radar data. With the increase in the amount of radar data and the increase in interaction requirements, there are certain bottlenecks in the efficiency and effect of visualization on the browser side. There are currently several problems: 1. Directly use pictures to display, which will be blurred after zooming in, which is not the same as thinning data. It is easy to analyze data; 2. The display efficiency of large amo...

Claims


Application Information

Patent Timeline
IPC IPC(8): G06T1/20G06F16/54G06F16/587G01S13/95
CPCG06T1/20G06F16/54G06F16/587G01S13/95Y02A90/10
Inventor 张杰坦
Owner NANJING NRIET IND CORP
Why Eureka
Try Eureka